Free Statistics

of Irreproducible Research!

Author's title

Author*The author of this computation has been verified*
R Software Modulerwasp_autocorrelation.wasp
Title produced by software(Partial) Autocorrelation Function
Date of computationWed, 16 Dec 2009 09:16:25 -0700
Cite this page as followsStatistical Computations at FreeStatistics.org, Office for Research Development and Education, URL https://freestatistics.org/blog/index.php?v=date/2009/Dec/16/t1260980638t5pp3cnvn9p0ayl.htm/, Retrieved Tue, 30 Apr 2024 17:10:35 +0000
Statistical Computations at FreeStatistics.org, Office for Research Development and Education, URL https://freestatistics.org/blog/index.php?pk=68459, Retrieved Tue, 30 Apr 2024 17:10:35 +0000
QR Codes:

Original text written by user:
IsPrivate?No (this computation is public)
User-defined keywords
Estimated Impact127
Family? (F = Feedback message, R = changed R code, M = changed R Module, P = changed Parameters, D = changed Data)
-     [(Partial) Autocorrelation Function] [] [2009-11-25 10:26:05] [3daae06e609b839af47edc9c5015e41f]
- R  D    [(Partial) Autocorrelation Function] [] [2009-12-16 16:16:25] [21503129a47c64de7f80e1fde84c3a45] [Current]
Feedback Forum

Post a new message
Dataseries X:
98,8
100,5
110,4
96,4
101,9
106,2
81
94,7
101
109,4
102,3
90,7
96,2
96,1
106
103,1
102
104,7
86
92,1
106,9
112,6
101,7
92
97,4
97
105,4
102,7
98,1
104,5
87,4
89,9
109,8
111,7
98,6
96,9
95,1
97
112,7
102,9
97,4
111,4
87,4
96,8
114,1
110,3
103,9
101,6
94,6
95,9
104,7
102,8
98,1
113,9
80,9
95,7
113,2
105,9
108,8
102,3


Summary of computational transaction
Raw Inputview raw input (R code)
Raw Outputview raw output of R engine
Computing time1 seconds
R Server'Gwilym Jenkins' @ 72.249.127.135

\begin{tabular}{lllllllll}
\hline
Summary of computational transaction \tabularnewline
Raw Input & view raw input (R code)  \tabularnewline
Raw Output & view raw output of R engine  \tabularnewline
Computing time & 1 seconds \tabularnewline
R Server & 'Gwilym Jenkins' @ 72.249.127.135 \tabularnewline
\hline
\end{tabular}
%Source: https://freestatistics.org/blog/index.php?pk=68459&T=0

[TABLE]
[ROW][C]Summary of computational transaction[/C][/ROW]
[ROW][C]Raw Input[/C][C]view raw input (R code) [/C][/ROW]
[ROW][C]Raw Output[/C][C]view raw output of R engine [/C][/ROW]
[ROW][C]Computing time[/C][C]1 seconds[/C][/ROW]
[ROW][C]R Server[/C][C]'Gwilym Jenkins' @ 72.249.127.135[/C][/ROW]
[/TABLE]
Source: https://freestatistics.org/blog/index.php?pk=68459&T=0

Globally Unique Identifier (entire table): ba.freestatistics.org/blog/index.php?pk=68459&T=0

As an alternative you can also use a QR Code:  

The GUIDs for individual cells are displayed in the table below:

Summary of computational transaction
Raw Inputview raw input (R code)
Raw Outputview raw output of R engine
Computing time1 seconds
R Server'Gwilym Jenkins' @ 72.249.127.135


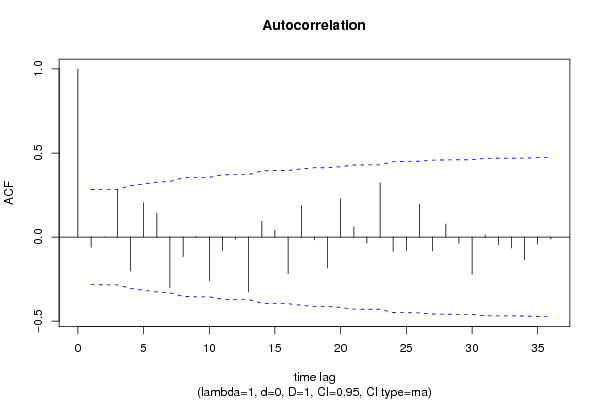
Autocorrelation Function
Time lag kACF(k)T-STATP-value
1-0.060373-0.41830.338806
20.002480.01720.493182
30.2824591.95690.028093
4-0.202054-1.39990.083991
50.2045741.41730.081423
60.1423070.98590.164556
7-0.300128-2.07930.021476
8-0.116228-0.80530.212322
90.0040920.02840.488749
10-0.258998-1.79440.039525
11-0.08011-0.5550.290729
12-0.012157-0.08420.466615
13-0.326559-2.26250.014116
140.0943040.65340.258321
150.0415930.28820.38723
16-0.217892-1.50960.06885
170.1876081.29980.099941
18-0.016322-0.11310.455219
19-0.183623-1.27220.10472
200.2266271.57010.061478
210.0605730.41970.338302
22-0.035253-0.24420.404042
230.3230862.23840.014934
24-0.085102-0.58960.279112
25-0.080365-0.55680.29013
260.1948031.34960.091733
27-0.082166-0.56930.285916
280.0775520.53730.296774
29-0.036764-0.25470.400017
30-0.220886-1.53030.066248
310.0136580.09460.462503
32-0.045517-0.31530.376931
33-0.064557-0.44730.328349
34-0.134789-0.93380.177528
35-0.042357-0.29350.385218
36-0.012112-0.08390.466737

\begin{tabular}{lllllllll}
\hline
Autocorrelation Function \tabularnewline
Time lag k & ACF(k) & T-STAT & P-value \tabularnewline
1 & -0.060373 & -0.4183 & 0.338806 \tabularnewline
2 & 0.00248 & 0.0172 & 0.493182 \tabularnewline
3 & 0.282459 & 1.9569 & 0.028093 \tabularnewline
4 & -0.202054 & -1.3999 & 0.083991 \tabularnewline
5 & 0.204574 & 1.4173 & 0.081423 \tabularnewline
6 & 0.142307 & 0.9859 & 0.164556 \tabularnewline
7 & -0.300128 & -2.0793 & 0.021476 \tabularnewline
8 & -0.116228 & -0.8053 & 0.212322 \tabularnewline
9 & 0.004092 & 0.0284 & 0.488749 \tabularnewline
10 & -0.258998 & -1.7944 & 0.039525 \tabularnewline
11 & -0.08011 & -0.555 & 0.290729 \tabularnewline
12 & -0.012157 & -0.0842 & 0.466615 \tabularnewline
13 & -0.326559 & -2.2625 & 0.014116 \tabularnewline
14 & 0.094304 & 0.6534 & 0.258321 \tabularnewline
15 & 0.041593 & 0.2882 & 0.38723 \tabularnewline
16 & -0.217892 & -1.5096 & 0.06885 \tabularnewline
17 & 0.187608 & 1.2998 & 0.099941 \tabularnewline
18 & -0.016322 & -0.1131 & 0.455219 \tabularnewline
19 & -0.183623 & -1.2722 & 0.10472 \tabularnewline
20 & 0.226627 & 1.5701 & 0.061478 \tabularnewline
21 & 0.060573 & 0.4197 & 0.338302 \tabularnewline
22 & -0.035253 & -0.2442 & 0.404042 \tabularnewline
23 & 0.323086 & 2.2384 & 0.014934 \tabularnewline
24 & -0.085102 & -0.5896 & 0.279112 \tabularnewline
25 & -0.080365 & -0.5568 & 0.29013 \tabularnewline
26 & 0.194803 & 1.3496 & 0.091733 \tabularnewline
27 & -0.082166 & -0.5693 & 0.285916 \tabularnewline
28 & 0.077552 & 0.5373 & 0.296774 \tabularnewline
29 & -0.036764 & -0.2547 & 0.400017 \tabularnewline
30 & -0.220886 & -1.5303 & 0.066248 \tabularnewline
31 & 0.013658 & 0.0946 & 0.462503 \tabularnewline
32 & -0.045517 & -0.3153 & 0.376931 \tabularnewline
33 & -0.064557 & -0.4473 & 0.328349 \tabularnewline
34 & -0.134789 & -0.9338 & 0.177528 \tabularnewline
35 & -0.042357 & -0.2935 & 0.385218 \tabularnewline
36 & -0.012112 & -0.0839 & 0.466737 \tabularnewline
\hline
\end{tabular}
%Source: https://freestatistics.org/blog/index.php?pk=68459&T=1

[TABLE]
[ROW][C]Autocorrelation Function[/C][/ROW]
[ROW][C]Time lag k[/C][C]ACF(k)[/C][C]T-STAT[/C][C]P-value[/C][/ROW]
[ROW][C]1[/C][C]-0.060373[/C][C]-0.4183[/C][C]0.338806[/C][/ROW]
[ROW][C]2[/C][C]0.00248[/C][C]0.0172[/C][C]0.493182[/C][/ROW]
[ROW][C]3[/C][C]0.282459[/C][C]1.9569[/C][C]0.028093[/C][/ROW]
[ROW][C]4[/C][C]-0.202054[/C][C]-1.3999[/C][C]0.083991[/C][/ROW]
[ROW][C]5[/C][C]0.204574[/C][C]1.4173[/C][C]0.081423[/C][/ROW]
[ROW][C]6[/C][C]0.142307[/C][C]0.9859[/C][C]0.164556[/C][/ROW]
[ROW][C]7[/C][C]-0.300128[/C][C]-2.0793[/C][C]0.021476[/C][/ROW]
[ROW][C]8[/C][C]-0.116228[/C][C]-0.8053[/C][C]0.212322[/C][/ROW]
[ROW][C]9[/C][C]0.004092[/C][C]0.0284[/C][C]0.488749[/C][/ROW]
[ROW][C]10[/C][C]-0.258998[/C][C]-1.7944[/C][C]0.039525[/C][/ROW]
[ROW][C]11[/C][C]-0.08011[/C][C]-0.555[/C][C]0.290729[/C][/ROW]
[ROW][C]12[/C][C]-0.012157[/C][C]-0.0842[/C][C]0.466615[/C][/ROW]
[ROW][C]13[/C][C]-0.326559[/C][C]-2.2625[/C][C]0.014116[/C][/ROW]
[ROW][C]14[/C][C]0.094304[/C][C]0.6534[/C][C]0.258321[/C][/ROW]
[ROW][C]15[/C][C]0.041593[/C][C]0.2882[/C][C]0.38723[/C][/ROW]
[ROW][C]16[/C][C]-0.217892[/C][C]-1.5096[/C][C]0.06885[/C][/ROW]
[ROW][C]17[/C][C]0.187608[/C][C]1.2998[/C][C]0.099941[/C][/ROW]
[ROW][C]18[/C][C]-0.016322[/C][C]-0.1131[/C][C]0.455219[/C][/ROW]
[ROW][C]19[/C][C]-0.183623[/C][C]-1.2722[/C][C]0.10472[/C][/ROW]
[ROW][C]20[/C][C]0.226627[/C][C]1.5701[/C][C]0.061478[/C][/ROW]
[ROW][C]21[/C][C]0.060573[/C][C]0.4197[/C][C]0.338302[/C][/ROW]
[ROW][C]22[/C][C]-0.035253[/C][C]-0.2442[/C][C]0.404042[/C][/ROW]
[ROW][C]23[/C][C]0.323086[/C][C]2.2384[/C][C]0.014934[/C][/ROW]
[ROW][C]24[/C][C]-0.085102[/C][C]-0.5896[/C][C]0.279112[/C][/ROW]
[ROW][C]25[/C][C]-0.080365[/C][C]-0.5568[/C][C]0.29013[/C][/ROW]
[ROW][C]26[/C][C]0.194803[/C][C]1.3496[/C][C]0.091733[/C][/ROW]
[ROW][C]27[/C][C]-0.082166[/C][C]-0.5693[/C][C]0.285916[/C][/ROW]
[ROW][C]28[/C][C]0.077552[/C][C]0.5373[/C][C]0.296774[/C][/ROW]
[ROW][C]29[/C][C]-0.036764[/C][C]-0.2547[/C][C]0.400017[/C][/ROW]
[ROW][C]30[/C][C]-0.220886[/C][C]-1.5303[/C][C]0.066248[/C][/ROW]
[ROW][C]31[/C][C]0.013658[/C][C]0.0946[/C][C]0.462503[/C][/ROW]
[ROW][C]32[/C][C]-0.045517[/C][C]-0.3153[/C][C]0.376931[/C][/ROW]
[ROW][C]33[/C][C]-0.064557[/C][C]-0.4473[/C][C]0.328349[/C][/ROW]
[ROW][C]34[/C][C]-0.134789[/C][C]-0.9338[/C][C]0.177528[/C][/ROW]
[ROW][C]35[/C][C]-0.042357[/C][C]-0.2935[/C][C]0.385218[/C][/ROW]
[ROW][C]36[/C][C]-0.012112[/C][C]-0.0839[/C][C]0.466737[/C][/ROW]
[/TABLE]
Source: https://freestatistics.org/blog/index.php?pk=68459&T=1

Globally Unique Identifier (entire table): ba.freestatistics.org/blog/index.php?pk=68459&T=1

As an alternative you can also use a QR Code:  

The GUIDs for individual cells are displayed in the table below:

Autocorrelation Function
Time lag kACF(k)T-STATP-value
1-0.060373-0.41830.338806
20.002480.01720.493182
30.2824591.95690.028093
4-0.202054-1.39990.083991
50.2045741.41730.081423
60.1423070.98590.164556
7-0.300128-2.07930.021476
8-0.116228-0.80530.212322
90.0040920.02840.488749
10-0.258998-1.79440.039525
11-0.08011-0.5550.290729
12-0.012157-0.08420.466615
13-0.326559-2.26250.014116
140.0943040.65340.258321
150.0415930.28820.38723
16-0.217892-1.50960.06885
170.1876081.29980.099941
18-0.016322-0.11310.455219
19-0.183623-1.27220.10472
200.2266271.57010.061478
210.0605730.41970.338302
22-0.035253-0.24420.404042
230.3230862.23840.014934
24-0.085102-0.58960.279112
25-0.080365-0.55680.29013
260.1948031.34960.091733
27-0.082166-0.56930.285916
280.0775520.53730.296774
29-0.036764-0.25470.400017
30-0.220886-1.53030.066248
310.0136580.09460.462503
32-0.045517-0.31530.376931
33-0.064557-0.44730.328349
34-0.134789-0.93380.177528
35-0.042357-0.29350.385218
36-0.012112-0.08390.466737


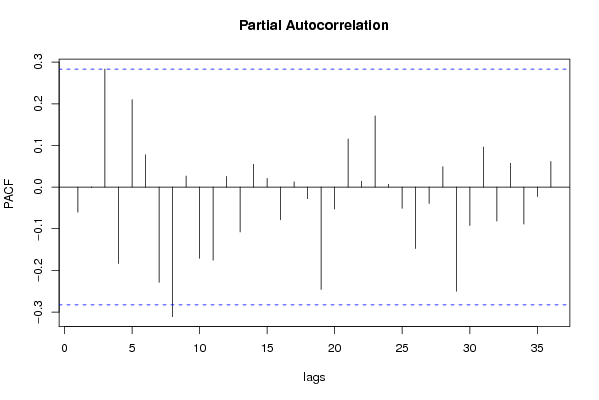
Partial Autocorrelation Function
Time lag kPACF(k)T-STATP-value
1-0.060373-0.41830.338806
2-0.001169-0.00810.496785
30.2835731.96460.027629
4-0.183354-1.27030.105048
50.2098981.45420.076197
60.0775170.53710.296855
7-0.22878-1.5850.059763
8-0.311083-2.15520.018093
90.0265320.18380.427466
10-0.170956-1.18440.12104
11-0.175658-1.2170.114778
120.0256090.17740.42996
13-0.10758-0.74530.229851
140.0546640.37870.353281
150.020780.1440.443065
16-0.07854-0.54410.294432
170.0127610.08840.46496
18-0.027871-0.19310.423848
19-0.245736-1.70250.047564
20-0.052582-0.36430.358617
210.115310.79890.214145
220.0141760.09820.461087
230.1708661.18380.121162
240.0065890.04570.481888
25-0.050992-0.35330.362711
26-0.14751-1.0220.155957
27-0.039361-0.27270.393128
280.0488650.33850.368214
29-0.250108-1.73280.044777
30-0.092198-0.63880.263006
310.096070.66560.254429
32-0.08167-0.56580.287075
330.057090.39550.347102
34-0.088933-0.61610.270354
35-0.022767-0.15770.437664
360.0616380.4270.335628

\begin{tabular}{lllllllll}
\hline
Partial Autocorrelation Function \tabularnewline
Time lag k & PACF(k) & T-STAT & P-value \tabularnewline
1 & -0.060373 & -0.4183 & 0.338806 \tabularnewline
2 & -0.001169 & -0.0081 & 0.496785 \tabularnewline
3 & 0.283573 & 1.9646 & 0.027629 \tabularnewline
4 & -0.183354 & -1.2703 & 0.105048 \tabularnewline
5 & 0.209898 & 1.4542 & 0.076197 \tabularnewline
6 & 0.077517 & 0.5371 & 0.296855 \tabularnewline
7 & -0.22878 & -1.585 & 0.059763 \tabularnewline
8 & -0.311083 & -2.1552 & 0.018093 \tabularnewline
9 & 0.026532 & 0.1838 & 0.427466 \tabularnewline
10 & -0.170956 & -1.1844 & 0.12104 \tabularnewline
11 & -0.175658 & -1.217 & 0.114778 \tabularnewline
12 & 0.025609 & 0.1774 & 0.42996 \tabularnewline
13 & -0.10758 & -0.7453 & 0.229851 \tabularnewline
14 & 0.054664 & 0.3787 & 0.353281 \tabularnewline
15 & 0.02078 & 0.144 & 0.443065 \tabularnewline
16 & -0.07854 & -0.5441 & 0.294432 \tabularnewline
17 & 0.012761 & 0.0884 & 0.46496 \tabularnewline
18 & -0.027871 & -0.1931 & 0.423848 \tabularnewline
19 & -0.245736 & -1.7025 & 0.047564 \tabularnewline
20 & -0.052582 & -0.3643 & 0.358617 \tabularnewline
21 & 0.11531 & 0.7989 & 0.214145 \tabularnewline
22 & 0.014176 & 0.0982 & 0.461087 \tabularnewline
23 & 0.170866 & 1.1838 & 0.121162 \tabularnewline
24 & 0.006589 & 0.0457 & 0.481888 \tabularnewline
25 & -0.050992 & -0.3533 & 0.362711 \tabularnewline
26 & -0.14751 & -1.022 & 0.155957 \tabularnewline
27 & -0.039361 & -0.2727 & 0.393128 \tabularnewline
28 & 0.048865 & 0.3385 & 0.368214 \tabularnewline
29 & -0.250108 & -1.7328 & 0.044777 \tabularnewline
30 & -0.092198 & -0.6388 & 0.263006 \tabularnewline
31 & 0.09607 & 0.6656 & 0.254429 \tabularnewline
32 & -0.08167 & -0.5658 & 0.287075 \tabularnewline
33 & 0.05709 & 0.3955 & 0.347102 \tabularnewline
34 & -0.088933 & -0.6161 & 0.270354 \tabularnewline
35 & -0.022767 & -0.1577 & 0.437664 \tabularnewline
36 & 0.061638 & 0.427 & 0.335628 \tabularnewline
\hline
\end{tabular}
%Source: https://freestatistics.org/blog/index.php?pk=68459&T=2

[TABLE]
[ROW][C]Partial Autocorrelation Function[/C][/ROW]
[ROW][C]Time lag k[/C][C]PACF(k)[/C][C]T-STAT[/C][C]P-value[/C][/ROW]
[ROW][C]1[/C][C]-0.060373[/C][C]-0.4183[/C][C]0.338806[/C][/ROW]
[ROW][C]2[/C][C]-0.001169[/C][C]-0.0081[/C][C]0.496785[/C][/ROW]
[ROW][C]3[/C][C]0.283573[/C][C]1.9646[/C][C]0.027629[/C][/ROW]
[ROW][C]4[/C][C]-0.183354[/C][C]-1.2703[/C][C]0.105048[/C][/ROW]
[ROW][C]5[/C][C]0.209898[/C][C]1.4542[/C][C]0.076197[/C][/ROW]
[ROW][C]6[/C][C]0.077517[/C][C]0.5371[/C][C]0.296855[/C][/ROW]
[ROW][C]7[/C][C]-0.22878[/C][C]-1.585[/C][C]0.059763[/C][/ROW]
[ROW][C]8[/C][C]-0.311083[/C][C]-2.1552[/C][C]0.018093[/C][/ROW]
[ROW][C]9[/C][C]0.026532[/C][C]0.1838[/C][C]0.427466[/C][/ROW]
[ROW][C]10[/C][C]-0.170956[/C][C]-1.1844[/C][C]0.12104[/C][/ROW]
[ROW][C]11[/C][C]-0.175658[/C][C]-1.217[/C][C]0.114778[/C][/ROW]
[ROW][C]12[/C][C]0.025609[/C][C]0.1774[/C][C]0.42996[/C][/ROW]
[ROW][C]13[/C][C]-0.10758[/C][C]-0.7453[/C][C]0.229851[/C][/ROW]
[ROW][C]14[/C][C]0.054664[/C][C]0.3787[/C][C]0.353281[/C][/ROW]
[ROW][C]15[/C][C]0.02078[/C][C]0.144[/C][C]0.443065[/C][/ROW]
[ROW][C]16[/C][C]-0.07854[/C][C]-0.5441[/C][C]0.294432[/C][/ROW]
[ROW][C]17[/C][C]0.012761[/C][C]0.0884[/C][C]0.46496[/C][/ROW]
[ROW][C]18[/C][C]-0.027871[/C][C]-0.1931[/C][C]0.423848[/C][/ROW]
[ROW][C]19[/C][C]-0.245736[/C][C]-1.7025[/C][C]0.047564[/C][/ROW]
[ROW][C]20[/C][C]-0.052582[/C][C]-0.3643[/C][C]0.358617[/C][/ROW]
[ROW][C]21[/C][C]0.11531[/C][C]0.7989[/C][C]0.214145[/C][/ROW]
[ROW][C]22[/C][C]0.014176[/C][C]0.0982[/C][C]0.461087[/C][/ROW]
[ROW][C]23[/C][C]0.170866[/C][C]1.1838[/C][C]0.121162[/C][/ROW]
[ROW][C]24[/C][C]0.006589[/C][C]0.0457[/C][C]0.481888[/C][/ROW]
[ROW][C]25[/C][C]-0.050992[/C][C]-0.3533[/C][C]0.362711[/C][/ROW]
[ROW][C]26[/C][C]-0.14751[/C][C]-1.022[/C][C]0.155957[/C][/ROW]
[ROW][C]27[/C][C]-0.039361[/C][C]-0.2727[/C][C]0.393128[/C][/ROW]
[ROW][C]28[/C][C]0.048865[/C][C]0.3385[/C][C]0.368214[/C][/ROW]
[ROW][C]29[/C][C]-0.250108[/C][C]-1.7328[/C][C]0.044777[/C][/ROW]
[ROW][C]30[/C][C]-0.092198[/C][C]-0.6388[/C][C]0.263006[/C][/ROW]
[ROW][C]31[/C][C]0.09607[/C][C]0.6656[/C][C]0.254429[/C][/ROW]
[ROW][C]32[/C][C]-0.08167[/C][C]-0.5658[/C][C]0.287075[/C][/ROW]
[ROW][C]33[/C][C]0.05709[/C][C]0.3955[/C][C]0.347102[/C][/ROW]
[ROW][C]34[/C][C]-0.088933[/C][C]-0.6161[/C][C]0.270354[/C][/ROW]
[ROW][C]35[/C][C]-0.022767[/C][C]-0.1577[/C][C]0.437664[/C][/ROW]
[ROW][C]36[/C][C]0.061638[/C][C]0.427[/C][C]0.335628[/C][/ROW]
[/TABLE]
Source: https://freestatistics.org/blog/index.php?pk=68459&T=2

Globally Unique Identifier (entire table): ba.freestatistics.org/blog/index.php?pk=68459&T=2

As an alternative you can also use a QR Code:  

The GUIDs for individual cells are displayed in the table below:

Partial Autocorrelation Function
Time lag kPACF(k)T-STATP-value
1-0.060373-0.41830.338806
2-0.001169-0.00810.496785
30.2835731.96460.027629
4-0.183354-1.27030.105048
50.2098981.45420.076197
60.0775170.53710.296855
7-0.22878-1.5850.059763
8-0.311083-2.15520.018093
90.0265320.18380.427466
10-0.170956-1.18440.12104
11-0.175658-1.2170.114778
120.0256090.17740.42996
13-0.10758-0.74530.229851
140.0546640.37870.353281
150.020780.1440.443065
16-0.07854-0.54410.294432
170.0127610.08840.46496
18-0.027871-0.19310.423848
19-0.245736-1.70250.047564
20-0.052582-0.36430.358617
210.115310.79890.214145
220.0141760.09820.461087
230.1708661.18380.121162
240.0065890.04570.481888
25-0.050992-0.35330.362711
26-0.14751-1.0220.155957
27-0.039361-0.27270.393128
280.0488650.33850.368214
29-0.250108-1.73280.044777
30-0.092198-0.63880.263006
310.096070.66560.254429
32-0.08167-0.56580.287075
330.057090.39550.347102
34-0.088933-0.61610.270354
35-0.022767-0.15770.437664
360.0616380.4270.335628


Parameters (Session):
par1 = 36 ; par2 = 1 ; par3 = 0 ; par4 = 1 ; par5 = 12 ; par6 = MA ; par7 = 0.95 ;
Parameters (R input):
par1 = 36 ; par2 = 1 ; par3 = 0 ; par4 = 1 ; par5 = 12 ; par6 = MA ; par7 = 0.95 ;
R code (references can be found in the software module):
if (par1 == 'Default') {
par1 = 10*log10(length(x))
} else {
par1 <- as.numeric(par1)
}
par2 <- as.numeric(par2)
par3 <- as.numeric(par3)
par4 <- as.numeric(par4)
par5 <- as.numeric(par5)
if (par6 == 'White Noise') par6 <- 'white' else par6 <- 'ma'
par7 <- as.numeric(par7)
if (par2 == 0) {
x <- log(x)
} else {
x <- (x ^ par2 - 1) / par2
}
if (par3 > 0) x <- diff(x,lag=1,difference=par3)
if (par4 > 0) x <- diff(x,lag=par5,difference=par4)
bitmap(file='pic1.png')
racf <- acf(x, par1, main='Autocorrelation', xlab='time lag', ylab='ACF', ci.type=par6, ci=par7, sub=paste('(lambda=',par2,', d=',par3,', D=',par4,', CI=', par7, ', CI type=',par6,')',sep=''))
dev.off()
bitmap(file='pic2.png')
rpacf <- pacf(x,par1,main='Partial Autocorrelation',xlab='lags',ylab='PACF')
dev.off()
(myacf <- c(racf$acf))
(mypacf <- c(rpacf$acf))
lengthx <- length(x)
sqrtn <- sqrt(lengthx)
load(file='createtable')
a<-table.start()
a<-table.row.start(a)
a<-table.element(a,'Autocorrelation Function',4,TRUE)
a<-table.row.end(a)
a<-table.row.start(a)
a<-table.element(a,'Time lag k',header=TRUE)
a<-table.element(a,hyperlink('basics.htm','ACF(k)','click here for more information about the Autocorrelation Function'),header=TRUE)
a<-table.element(a,'T-STAT',header=TRUE)
a<-table.element(a,'P-value',header=TRUE)
a<-table.row.end(a)
for (i in 2:(par1+1)) {
a<-table.row.start(a)
a<-table.element(a,i-1,header=TRUE)
a<-table.element(a,round(myacf[i],6))
mytstat <- myacf[i]*sqrtn
a<-table.element(a,round(mytstat,4))
a<-table.element(a,round(1-pt(abs(mytstat),lengthx),6))
a<-table.row.end(a)
}
a<-table.end(a)
table.save(a,file='mytable.tab')
a<-table.start()
a<-table.row.start(a)
a<-table.element(a,'Partial Autocorrelation Function',4,TRUE)
a<-table.row.end(a)
a<-table.row.start(a)
a<-table.element(a,'Time lag k',header=TRUE)
a<-table.element(a,hyperlink('basics.htm','PACF(k)','click here for more information about the Partial Autocorrelation Function'),header=TRUE)
a<-table.element(a,'T-STAT',header=TRUE)
a<-table.element(a,'P-value',header=TRUE)
a<-table.row.end(a)
for (i in 1:par1) {
a<-table.row.start(a)
a<-table.element(a,i,header=TRUE)
a<-table.element(a,round(mypacf[i],6))
mytstat <- mypacf[i]*sqrtn
a<-table.element(a,round(mytstat,4))
a<-table.element(a,round(1-pt(abs(mytstat),lengthx),6))
a<-table.row.end(a)
}
a<-table.end(a)
table.save(a,file='mytable1.tab')