| Multiple Linear Regression - Estimated Regression Equation |
| Y[t] = -23.3563271745923 + 0.0503661112985457X[t] + 0.137335934853832Y1[t] + 0.44197286432973Y2[t] + 0.71371757685287Y3[t] -7.3392913869526M1[t] -12.6020682925414M2[t] -6.88849991241403M3[t] -30.9409798345795M4[t] -20.1475895309494M5[t] -2.05730628225174M6[t] + 10.2155687017701M7[t] -10.1579795949487M8[t] -27.2356280091489M9[t] -22.8543489826544M10[t] -14.1311859451063M11[t] -0.0656504752053687t + e[t] |
| Multiple Linear Regression - Ordinary Least Squares | |||||
| Variable | Parameter | S.D. | T-STAT H0: parameter = 0 | 2-tail p-value | 1-tail p-value |
| (Intercept) | -23.3563271745923 | 38.666223 | -0.604 | 0.549138 | 0.274569 |
| X | 0.0503661112985457 | 0.135396 | 0.372 | 0.711816 | 0.355908 |
| Y1 | 0.137335934853832 | 0.140158 | 0.9799 | 0.332899 | 0.166449 |
| Y2 | 0.44197286432973 | 0.148912 | 2.968 | 0.004986 | 0.002493 |
| Y3 | 0.71371757685287 | 0.166002 | 4.2994 | 0.000103 | 5.2e-05 |
| M1 | -7.3392913869526 | 3.040656 | -2.4137 | 0.020342 | 0.010171 |
| M2 | -12.6020682925414 | 3.243173 | -3.8857 | 0.000365 | 0.000182 |
| M3 | -6.88849991241403 | 3.439432 | -2.0028 | 0.051841 | 0.02592 |
| M4 | -30.9409798345795 | 5.357523 | -5.7752 | 1e-06 | 0 |
| M5 | -20.1475895309494 | 6.038678 | -3.3364 | 0.001812 | 0.000906 |
| M6 | -2.05730628225174 | 5.568339 | -0.3695 | 0.713683 | 0.356841 |
| M7 | 10.2155687017701 | 4.84061 | 2.1104 | 0.04097 | 0.020485 |
| M8 | -10.1579795949487 | 4.406753 | -2.3051 | 0.026298 | 0.013149 |
| M9 | -27.2356280091489 | 4.669276 | -5.8329 | 1e-06 | 0 |
| M10 | -22.8543489826544 | 4.022714 | -5.6813 | 1e-06 | 1e-06 |
| M11 | -14.1311859451063 | 3.347037 | -4.222 | 0.000131 | 6.6e-05 |
| t | -0.0656504752053687 | 0.098949 | -0.6635 | 0.51074 | 0.25537 |
| Multiple Linear Regression - Regression Statistics | |
| Multiple R | 0.923644579935657 |
| R-squared | 0.853119310044516 |
| Adjusted R-squared | 0.795800016403352 |
| F-TEST (value) | 14.8836326453235 |
| F-TEST (DF numerator) | 16 |
| F-TEST (DF denominator) | 41 |
| p-value | 2.99338331899435e-12 |
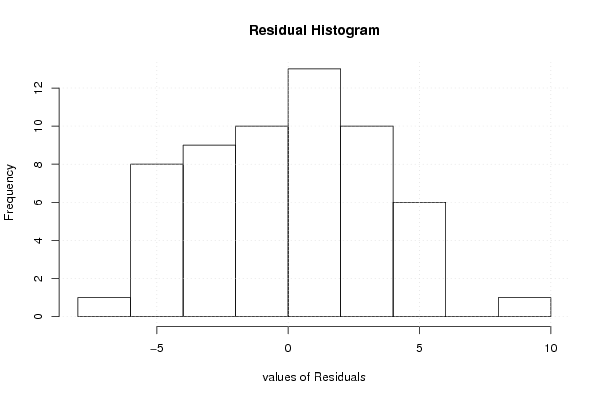
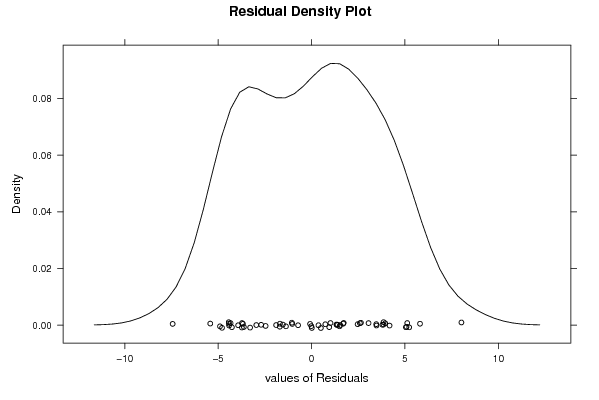
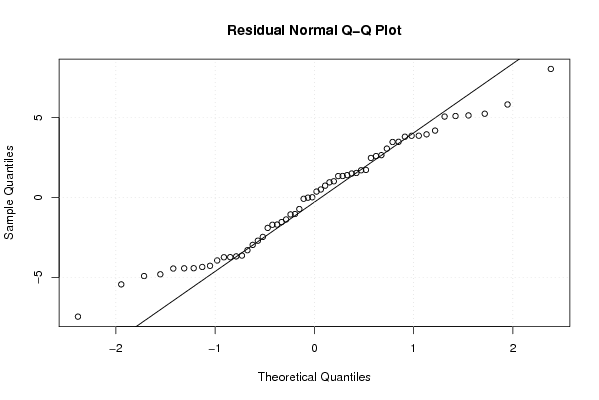
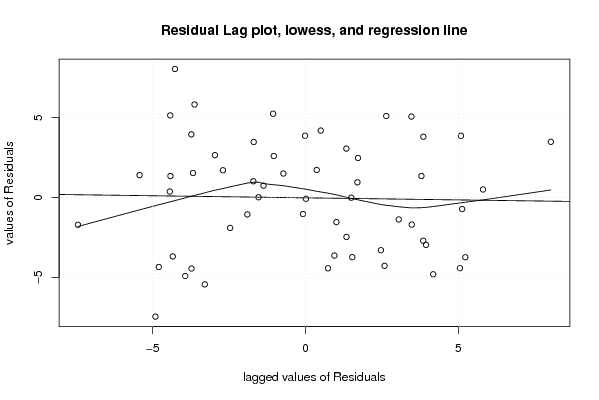
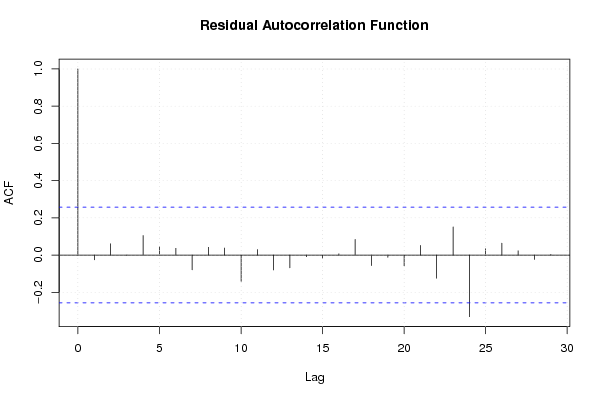
| Multiple Linear Regression - Residual Statistics | |
| Residual Standard Deviation | 4.12775134037727 |
| Sum Squared Residuals | 698.57157624744 |
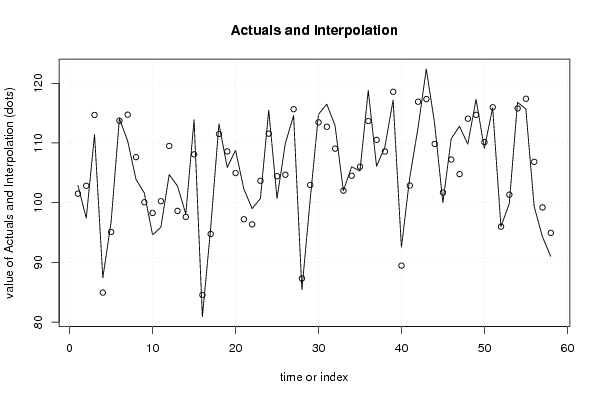
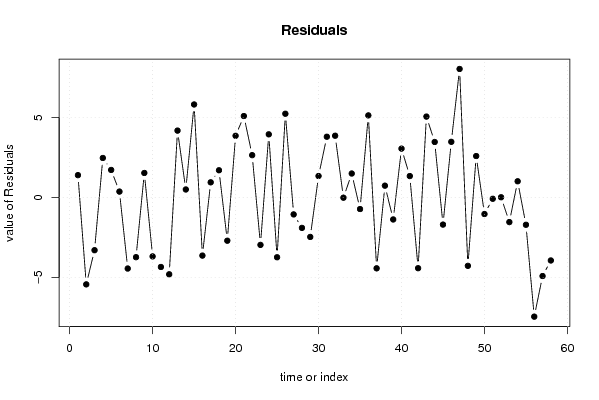
| Multiple Linear Regression - Actuals, Interpolation, and Residuals | |||
| Time or Index | Actuals | Interpolation Forecast | Residuals Prediction Error |
| 1 | 102.9 | 101.506333575794 | 1.39366642420611 |
| 2 | 97.4 | 102.824854731638 | -5.42485473163798 |
| 3 | 111.4 | 114.692189103620 | -3.29218910361967 |
| 4 | 87.4 | 84.935024905277 | 2.46497509472299 |
| 5 | 96.8 | 95.0821707268221 | 1.71782927317787 |
| 6 | 114.1 | 113.732092508669 | 0.367907491331412 |
| 7 | 110.3 | 114.736158435104 | -4.43615843510442 |
| 8 | 103.9 | 107.626497773072 | -3.72649777307151 |
| 9 | 101.6 | 100.070601650509 | 1.52939834949111 |
| 10 | 94.6 | 98.2777738713903 | -3.67777387139034 |
| 11 | 95.9 | 100.238506476044 | -4.33850647604386 |
| 12 | 104.7 | 109.495387627692 | -4.79538762769227 |
| 13 | 102.8 | 98.6257131214139 | 4.17428687858613 |
| 14 | 98.1 | 97.601710963915 | 0.498289036084906 |
| 15 | 113.9 | 108.095482320401 | 5.80451767959866 |
| 16 | 80.9 | 84.5271038420985 | -3.6271038420985 |
| 17 | 95.7 | 94.7543853559364 | 0.945614644063591 |
| 18 | 113.2 | 111.503223156660 | 1.69677684334033 |
| 19 | 105.9 | 108.598683768368 | -2.69868376836808 |
| 20 | 108.8 | 104.950816822218 | 3.84918317778176 |
| 21 | 102.3 | 97.2176172727142 | 5.08238272728578 |
| 22 | 99 | 96.359582463894 | 2.64041753610607 |
| 23 | 100.7 | 103.660111573352 | -2.96011157335197 |
| 24 | 115.5 | 111.559246762881 | 3.94075323711865 |
| 25 | 100.7 | 104.431864268411 | -3.73186426841052 |
| 26 | 109.9 | 104.674284990614 | 5.22571500938608 |
| 27 | 114.6 | 115.657881352832 | -1.05788135283217 |
| 28 | 85.4 | 87.3000756252388 | -1.90007562523883 |
| 29 | 100.5 | 102.963276993119 | -2.46327699311909 |
| 30 | 114.8 | 113.460181244386 | 1.33981875561393 |
| 31 | 116.5 | 112.709054959409 | 3.79094504059068 |
| 32 | 112.9 | 109.046647422846 | 3.85335257715387 |
| 33 | 102 | 102.013891607234 | -0.013891607233505 |
| 34 | 106 | 104.505142148977 | 1.49485785102269 |
| 35 | 105.3 | 106.022914285080 | -0.722914285079682 |
| 36 | 118.8 | 113.678487802414 | 5.12151219758574 |
| 37 | 106.1 | 110.521972029268 | -4.42197202926804 |
| 38 | 109.3 | 108.563846861395 | 0.736153138605223 |
| 39 | 117.2 | 118.572639445778 | -1.37263944577807 |
| 40 | 92.5 | 89.4509123238311 | 3.04908767616888 |
| 41 | 104.2 | 102.864133103292 | 1.33586689670847 |
| 42 | 112.5 | 116.915038754976 | -4.41503875497573 |
| 43 | 122.4 | 117.351114885784 | 5.04888511421591 |
| 44 | 113.3 | 109.837117290341 | 3.46288270965872 |
| 45 | 100 | 101.693082527210 | -1.69308252721041 |
| 46 | 110.7 | 107.225994090386 | 3.47400590961351 |
| 47 | 112.8 | 104.778467665524 | 8.02153233447551 |
| 48 | 109.8 | 114.066877807012 | -4.26687780701211 |
| 49 | 117.3 | 114.714117005114 | 2.58588299488632 |
| 50 | 109.1 | 110.135302452438 | -1.03530245243822 |
| 51 | 115.9 | 115.981807777369 | -0.0818077773687492 |
| 52 | 96 | 95.9868833035545 | 0.0131166964454565 |
| 53 | 99.8 | 101.336033820831 | -1.53603382083084 |
| 54 | 116.8 | 115.78946433531 | 1.01053566469005 |
| 55 | 115.7 | 117.404987951334 | -1.7049879513341 |
| 56 | 99.4 | 106.838920691523 | -7.43892069152284 |
| 57 | 94.3 | 99.204806942333 | -4.90480694233298 |
| 58 | 91 | 94.931507425352 | -3.93150742535194 |
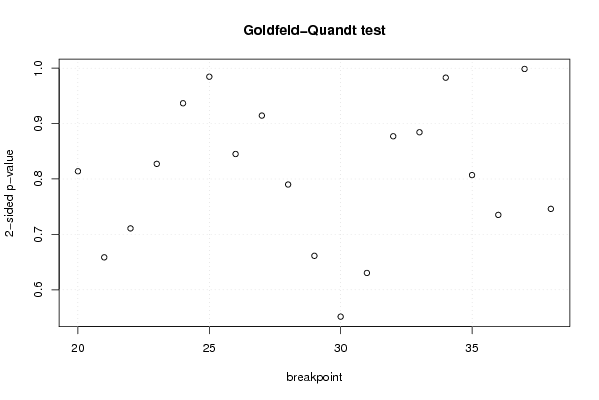
| Goldfeld-Quandt test for Heteroskedasticity | |||
| p-values | Alternative Hypothesis | ||
| breakpoint index | greater | 2-sided | less |
| 20 | 0.40697369271562 | 0.81394738543124 | 0.59302630728438 |
| 21 | 0.329293569748824 | 0.658587139497648 | 0.670706430251176 |
| 22 | 0.355428382348811 | 0.710856764697621 | 0.64457161765119 |
| 23 | 0.413657477709245 | 0.827314955418489 | 0.586342522290755 |
| 24 | 0.468361887497372 | 0.936723774994744 | 0.531638112502628 |
| 25 | 0.50771244766977 | 0.98457510466046 | 0.49228755233023 |
| 26 | 0.577441992966782 | 0.845116014066436 | 0.422558007033218 |
| 27 | 0.457230849199069 | 0.914461698398138 | 0.542769150800931 |
| 28 | 0.395009843265445 | 0.79001968653089 | 0.604990156734555 |
| 29 | 0.330658939987452 | 0.661317879974904 | 0.669341060012548 |
| 30 | 0.275750553341353 | 0.551501106682707 | 0.724249446658647 |
| 31 | 0.315197777164632 | 0.630395554329264 | 0.684802222835368 |
| 32 | 0.438567289170851 | 0.877134578341702 | 0.561432710829149 |
| 33 | 0.442181564738156 | 0.884363129476311 | 0.557818435261844 |
| 34 | 0.491445300571319 | 0.982890601142637 | 0.508554699428681 |
| 35 | 0.59647201526906 | 0.80705596946188 | 0.40352798473094 |
| 36 | 0.632417654979471 | 0.735164690041057 | 0.367582345020529 |
| 37 | 0.49932244015963 | 0.99864488031926 | 0.50067755984037 |
| 38 | 0.373043846448639 | 0.746087692897278 | 0.626956153551361 |
| Meta Analysis of Goldfeld-Quandt test for Heteroskedasticity | |||
| Description | # significant tests | % significant tests | OK/NOK |
| 1% type I error level | 0 | 0 | OK |
| 5% type I error level | 0 | 0 | OK |
| 10% type I error level | 0 | 0 | OK |