Free Statistics

of Irreproducible Research!

Author's title

Author*The author of this computation has been verified*
R Software Modulerwasp_multipleregression.wasp
Title produced by softwareMultiple Regression
Date of computationWed, 16 Dec 2009 08:21:57 -0700
Cite this page as followsStatistical Computations at FreeStatistics.org, Office for Research Development and Education, URL https://freestatistics.org/blog/index.php?v=date/2009/Dec/16/t1260977183y1innofha53fic5.htm/, Retrieved Tue, 30 Apr 2024 17:54:08 +0000
Statistical Computations at FreeStatistics.org, Office for Research Development and Education, URL https://freestatistics.org/blog/index.php?pk=68424, Retrieved Tue, 30 Apr 2024 17:54:08 +0000
QR Codes:

Original text written by user:
IsPrivate?No (this computation is public)
User-defined keywords
Estimated Impact102
Family? (F = Feedback message, R = changed R code, M = changed R Module, P = changed Parameters, D = changed Data)
-     [Multiple Regression] [Q1 The Seatbeltlaw] [2007-11-14 19:27:43] [8cd6641b921d30ebe00b648d1481bba0]
- RM D  [Multiple Regression] [Seatbelt] [2009-11-12 14:10:54] [b98453cac15ba1066b407e146608df68]
- R  D    [Multiple Regression] [Model 4, kijken n...] [2009-12-16 14:57:17] [075a06058fde559dd021d126a2b15a40]
-    D      [Multiple Regression] [Model 4, kijken n...] [2009-12-16 15:04:25] [075a06058fde559dd021d126a2b15a40]
-    D          [Multiple Regression] [Model 5, kijken n...] [2009-12-16 15:21:57] [154177ed6b2613a730375f7d341441cf] [Current]
Feedback Forum

Post a new message
Dataseries X:
102.9	120	112.7	97	95.1
97.4	114	102.9	112.7	97
111.4	116	97.4	102.9	112.7
87.4	153	111.4	97.4	102.9
96.8	162	87.4	111.4	97.4
114.1	161	96.8	87.4	111.4
110.3	149	114.1	96.8	87.4
103.9	139	110.3	114.1	96.8
101.6	135	103.9	110.3	114.1
94.6	130	101.6	103.9	110.3
95.9	127	94.6	101.6	103.9
104.7	122	95.9	94.6	101.6
102.8	117	104.7	95.9	94.6
98.1	112	102.8	104.7	95.9
113.9	113	98.1	102.8	104.7
80.9	149	113.9	98.1	102.8
95.7	157	80.9	113.9	98.1
113.2	157	95.7	80.9	113.9
105.9	147	113.2	95.7	80.9
108.8	137	105.9	113.2	95.7
102.3	132	108.8	105.9	113.2
99	125	102.3	108.8	105.9
100.7	123	99	102.3	108.8
115.5	117	100.7	99	102.3
100.7	114	115.5	100.7	99
109.9	111	100.7	115.5	100.7
114.6	112	109.9	100.7	115.5
85.4	144	114.6	109.9	100.7
100.5	150	85.4	114.6	109.9
114.8	149	100.5	85.4	114.6
116.5	134	114.8	100.5	85.4
112.9	123	116.5	114.8	100.5
102	116	112.9	116.5	114.8
106	117	102	112.9	116.5
105.3	111	106	102	112.9
118.8	105	105.3	106	102
106.1	102	118.8	105.3	106
109.3	95	106.1	118.8	105.3
117.2	93	109.3	106.1	118.8
92.5	124	117.2	109.3	106.1
104.2	130	92.5	117.2	109.3
112.5	124	104.2	92.5	117.2
122.4	115	112.5	104.2	92.5
113.3	106	122.4	112.5	104.2
100	105	113.3	122.4	112.5
110.7	105	100	113.3	122.4
112.8	101	110.7	100	113.3
109.8	95	112.8	110.7	100
117.3	93	109.8	112.8	110.7
109.1	84	117.3	109.8	112.8
115.9	87	109.1	117.3	109.8
96	116	115.9	109.1	117.3
99.8	120	96	115.9	109.1
116.8	117	99.8	96	115.9
115.7	109	116.8	99.8	96
99.4	105	115.7	116.8	99.8
94.3	107	99.4	115.7	116.8
91	109	94.3	99.4	115.7


Summary of computational transaction
Raw Inputview raw input (R code)
Raw Outputview raw output of R engine
Computing time3 seconds
R Server'Gwilym Jenkins' @ 72.249.127.135

\begin{tabular}{lllllllll}
\hline
Summary of computational transaction \tabularnewline
Raw Input & view raw input (R code)  \tabularnewline
Raw Output & view raw output of R engine  \tabularnewline
Computing time & 3 seconds \tabularnewline
R Server & 'Gwilym Jenkins' @ 72.249.127.135 \tabularnewline
\hline
\end{tabular}
%Source: https://freestatistics.org/blog/index.php?pk=68424&T=0

[TABLE]
[ROW][C]Summary of computational transaction[/C][/ROW]
[ROW][C]Raw Input[/C][C]view raw input (R code) [/C][/ROW]
[ROW][C]Raw Output[/C][C]view raw output of R engine [/C][/ROW]
[ROW][C]Computing time[/C][C]3 seconds[/C][/ROW]
[ROW][C]R Server[/C][C]'Gwilym Jenkins' @ 72.249.127.135[/C][/ROW]
[/TABLE]
Source: https://freestatistics.org/blog/index.php?pk=68424&T=0

Globally Unique Identifier (entire table): ba.freestatistics.org/blog/index.php?pk=68424&T=0

As an alternative you can also use a QR Code:  

The GUIDs for individual cells are displayed in the table below:

Summary of computational transaction
Raw Inputview raw input (R code)
Raw Outputview raw output of R engine
Computing time3 seconds
R Server'Gwilym Jenkins' @ 72.249.127.135


Multiple Linear Regression - Estimated Regression Equation
Y[t] = -23.3563271745923 + 0.0503661112985457X[t] + 0.137335934853832Y1[t] + 0.44197286432973Y2[t] + 0.71371757685287Y3[t] -7.3392913869526M1[t] -12.6020682925414M2[t] -6.88849991241403M3[t] -30.9409798345795M4[t] -20.1475895309494M5[t] -2.05730628225174M6[t] + 10.2155687017701M7[t] -10.1579795949487M8[t] -27.2356280091489M9[t] -22.8543489826544M10[t] -14.1311859451063M11[t] -0.0656504752053687t + e[t]

\begin{tabular}{lllllllll}
\hline
Multiple Linear Regression - Estimated Regression Equation \tabularnewline
Y[t] =  -23.3563271745923 +  0.0503661112985457X[t] +  0.137335934853832Y1[t] +  0.44197286432973Y2[t] +  0.71371757685287Y3[t] -7.3392913869526M1[t] -12.6020682925414M2[t] -6.88849991241403M3[t] -30.9409798345795M4[t] -20.1475895309494M5[t] -2.05730628225174M6[t] +  10.2155687017701M7[t] -10.1579795949487M8[t] -27.2356280091489M9[t] -22.8543489826544M10[t] -14.1311859451063M11[t] -0.0656504752053687t  + e[t] \tabularnewline
\hline
\end{tabular}
%Source: https://freestatistics.org/blog/index.php?pk=68424&T=1

[TABLE]
[ROW][C]Multiple Linear Regression - Estimated Regression Equation[/C][/ROW]
[ROW][C]Y[t] =  -23.3563271745923 +  0.0503661112985457X[t] +  0.137335934853832Y1[t] +  0.44197286432973Y2[t] +  0.71371757685287Y3[t] -7.3392913869526M1[t] -12.6020682925414M2[t] -6.88849991241403M3[t] -30.9409798345795M4[t] -20.1475895309494M5[t] -2.05730628225174M6[t] +  10.2155687017701M7[t] -10.1579795949487M8[t] -27.2356280091489M9[t] -22.8543489826544M10[t] -14.1311859451063M11[t] -0.0656504752053687t  + e[t][/C][/ROW]
[/TABLE]
Source: https://freestatistics.org/blog/index.php?pk=68424&T=1

Globally Unique Identifier (entire table): ba.freestatistics.org/blog/index.php?pk=68424&T=1

As an alternative you can also use a QR Code:  

The GUIDs for individual cells are displayed in the table below:

Multiple Linear Regression - Estimated Regression Equation
Y[t] = -23.3563271745923 + 0.0503661112985457X[t] + 0.137335934853832Y1[t] + 0.44197286432973Y2[t] + 0.71371757685287Y3[t] -7.3392913869526M1[t] -12.6020682925414M2[t] -6.88849991241403M3[t] -30.9409798345795M4[t] -20.1475895309494M5[t] -2.05730628225174M6[t] + 10.2155687017701M7[t] -10.1579795949487M8[t] -27.2356280091489M9[t] -22.8543489826544M10[t] -14.1311859451063M11[t] -0.0656504752053687t + e[t]


Multiple Linear Regression - Ordinary Least Squares
VariableParameterS.D.T-STATH0: parameter = 02-tail p-value1-tail p-value
(Intercept)-23.356327174592338.666223-0.6040.5491380.274569
X0.05036611129854570.1353960.3720.7118160.355908
Y10.1373359348538320.1401580.97990.3328990.166449
Y20.441972864329730.1489122.9680.0049860.002493
Y30.713717576852870.1660024.29940.0001035.2e-05
M1-7.33929138695263.040656-2.41370.0203420.010171
M2-12.60206829254143.243173-3.88570.0003650.000182
M3-6.888499912414033.439432-2.00280.0518410.02592
M4-30.94097983457955.357523-5.77521e-060
M5-20.14758953094946.038678-3.33640.0018120.000906
M6-2.057306282251745.568339-0.36950.7136830.356841
M710.21556870177014.840612.11040.040970.020485
M8-10.15797959494874.406753-2.30510.0262980.013149
M9-27.23562800914894.669276-5.83291e-060
M10-22.85434898265444.022714-5.68131e-061e-06
M11-14.13118594510633.347037-4.2220.0001316.6e-05
t-0.06565047520536870.098949-0.66350.510740.25537

\begin{tabular}{lllllllll}
\hline
Multiple Linear Regression - Ordinary Least Squares \tabularnewline
Variable & Parameter & S.D. & T-STATH0: parameter = 0 & 2-tail p-value & 1-tail p-value \tabularnewline
(Intercept) & -23.3563271745923 & 38.666223 & -0.604 & 0.549138 & 0.274569 \tabularnewline
X & 0.0503661112985457 & 0.135396 & 0.372 & 0.711816 & 0.355908 \tabularnewline
Y1 & 0.137335934853832 & 0.140158 & 0.9799 & 0.332899 & 0.166449 \tabularnewline
Y2 & 0.44197286432973 & 0.148912 & 2.968 & 0.004986 & 0.002493 \tabularnewline
Y3 & 0.71371757685287 & 0.166002 & 4.2994 & 0.000103 & 5.2e-05 \tabularnewline
M1 & -7.3392913869526 & 3.040656 & -2.4137 & 0.020342 & 0.010171 \tabularnewline
M2 & -12.6020682925414 & 3.243173 & -3.8857 & 0.000365 & 0.000182 \tabularnewline
M3 & -6.88849991241403 & 3.439432 & -2.0028 & 0.051841 & 0.02592 \tabularnewline
M4 & -30.9409798345795 & 5.357523 & -5.7752 & 1e-06 & 0 \tabularnewline
M5 & -20.1475895309494 & 6.038678 & -3.3364 & 0.001812 & 0.000906 \tabularnewline
M6 & -2.05730628225174 & 5.568339 & -0.3695 & 0.713683 & 0.356841 \tabularnewline
M7 & 10.2155687017701 & 4.84061 & 2.1104 & 0.04097 & 0.020485 \tabularnewline
M8 & -10.1579795949487 & 4.406753 & -2.3051 & 0.026298 & 0.013149 \tabularnewline
M9 & -27.2356280091489 & 4.669276 & -5.8329 & 1e-06 & 0 \tabularnewline
M10 & -22.8543489826544 & 4.022714 & -5.6813 & 1e-06 & 1e-06 \tabularnewline
M11 & -14.1311859451063 & 3.347037 & -4.222 & 0.000131 & 6.6e-05 \tabularnewline
t & -0.0656504752053687 & 0.098949 & -0.6635 & 0.51074 & 0.25537 \tabularnewline
\hline
\end{tabular}
%Source: https://freestatistics.org/blog/index.php?pk=68424&T=2

[TABLE]
[ROW][C]Multiple Linear Regression - Ordinary Least Squares[/C][/ROW]
[ROW][C]Variable[/C][C]Parameter[/C][C]S.D.[/C][C]T-STATH0: parameter = 0[/C][C]2-tail p-value[/C][C]1-tail p-value[/C][/ROW]
[ROW][C](Intercept)[/C][C]-23.3563271745923[/C][C]38.666223[/C][C]-0.604[/C][C]0.549138[/C][C]0.274569[/C][/ROW]
[ROW][C]X[/C][C]0.0503661112985457[/C][C]0.135396[/C][C]0.372[/C][C]0.711816[/C][C]0.355908[/C][/ROW]
[ROW][C]Y1[/C][C]0.137335934853832[/C][C]0.140158[/C][C]0.9799[/C][C]0.332899[/C][C]0.166449[/C][/ROW]
[ROW][C]Y2[/C][C]0.44197286432973[/C][C]0.148912[/C][C]2.968[/C][C]0.004986[/C][C]0.002493[/C][/ROW]
[ROW][C]Y3[/C][C]0.71371757685287[/C][C]0.166002[/C][C]4.2994[/C][C]0.000103[/C][C]5.2e-05[/C][/ROW]
[ROW][C]M1[/C][C]-7.3392913869526[/C][C]3.040656[/C][C]-2.4137[/C][C]0.020342[/C][C]0.010171[/C][/ROW]
[ROW][C]M2[/C][C]-12.6020682925414[/C][C]3.243173[/C][C]-3.8857[/C][C]0.000365[/C][C]0.000182[/C][/ROW]
[ROW][C]M3[/C][C]-6.88849991241403[/C][C]3.439432[/C][C]-2.0028[/C][C]0.051841[/C][C]0.02592[/C][/ROW]
[ROW][C]M4[/C][C]-30.9409798345795[/C][C]5.357523[/C][C]-5.7752[/C][C]1e-06[/C][C]0[/C][/ROW]
[ROW][C]M5[/C][C]-20.1475895309494[/C][C]6.038678[/C][C]-3.3364[/C][C]0.001812[/C][C]0.000906[/C][/ROW]
[ROW][C]M6[/C][C]-2.05730628225174[/C][C]5.568339[/C][C]-0.3695[/C][C]0.713683[/C][C]0.356841[/C][/ROW]
[ROW][C]M7[/C][C]10.2155687017701[/C][C]4.84061[/C][C]2.1104[/C][C]0.04097[/C][C]0.020485[/C][/ROW]
[ROW][C]M8[/C][C]-10.1579795949487[/C][C]4.406753[/C][C]-2.3051[/C][C]0.026298[/C][C]0.013149[/C][/ROW]
[ROW][C]M9[/C][C]-27.2356280091489[/C][C]4.669276[/C][C]-5.8329[/C][C]1e-06[/C][C]0[/C][/ROW]
[ROW][C]M10[/C][C]-22.8543489826544[/C][C]4.022714[/C][C]-5.6813[/C][C]1e-06[/C][C]1e-06[/C][/ROW]
[ROW][C]M11[/C][C]-14.1311859451063[/C][C]3.347037[/C][C]-4.222[/C][C]0.000131[/C][C]6.6e-05[/C][/ROW]
[ROW][C]t[/C][C]-0.0656504752053687[/C][C]0.098949[/C][C]-0.6635[/C][C]0.51074[/C][C]0.25537[/C][/ROW]
[/TABLE]
Source: https://freestatistics.org/blog/index.php?pk=68424&T=2

Globally Unique Identifier (entire table): ba.freestatistics.org/blog/index.php?pk=68424&T=2

As an alternative you can also use a QR Code:  

The GUIDs for individual cells are displayed in the table below:

Multiple Linear Regression - Ordinary Least Squares
VariableParameterS.D.T-STATH0: parameter = 02-tail p-value1-tail p-value
(Intercept)-23.356327174592338.666223-0.6040.5491380.274569
X0.05036611129854570.1353960.3720.7118160.355908
Y10.1373359348538320.1401580.97990.3328990.166449
Y20.441972864329730.1489122.9680.0049860.002493
Y30.713717576852870.1660024.29940.0001035.2e-05
M1-7.33929138695263.040656-2.41370.0203420.010171
M2-12.60206829254143.243173-3.88570.0003650.000182
M3-6.888499912414033.439432-2.00280.0518410.02592
M4-30.94097983457955.357523-5.77521e-060
M5-20.14758953094946.038678-3.33640.0018120.000906
M6-2.057306282251745.568339-0.36950.7136830.356841
M710.21556870177014.840612.11040.040970.020485
M8-10.15797959494874.406753-2.30510.0262980.013149
M9-27.23562800914894.669276-5.83291e-060
M10-22.85434898265444.022714-5.68131e-061e-06
M11-14.13118594510633.347037-4.2220.0001316.6e-05
t-0.06565047520536870.098949-0.66350.510740.25537


Multiple Linear Regression - Regression Statistics
Multiple R0.923644579935657
R-squared0.853119310044516
Adjusted R-squared0.795800016403352
F-TEST (value)14.8836326453235
F-TEST (DF numerator)16
F-TEST (DF denominator)41
p-value2.99338331899435e-12
Multiple Linear Regression - Residual Statistics
Residual Standard Deviation4.12775134037727
Sum Squared Residuals698.57157624744

\begin{tabular}{lllllllll}
\hline
Multiple Linear Regression - Regression Statistics \tabularnewline
Multiple R & 0.923644579935657 \tabularnewline
R-squared & 0.853119310044516 \tabularnewline
Adjusted R-squared & 0.795800016403352 \tabularnewline
F-TEST (value) & 14.8836326453235 \tabularnewline
F-TEST (DF numerator) & 16 \tabularnewline
F-TEST (DF denominator) & 41 \tabularnewline
p-value & 2.99338331899435e-12 \tabularnewline
Multiple Linear Regression - Residual Statistics \tabularnewline
Residual Standard Deviation & 4.12775134037727 \tabularnewline
Sum Squared Residuals & 698.57157624744 \tabularnewline
\hline
\end{tabular}
%Source: https://freestatistics.org/blog/index.php?pk=68424&T=3

[TABLE]
[ROW][C]Multiple Linear Regression - Regression Statistics[/C][/ROW]
[ROW][C]Multiple R[/C][C]0.923644579935657[/C][/ROW]
[ROW][C]R-squared[/C][C]0.853119310044516[/C][/ROW]
[ROW][C]Adjusted R-squared[/C][C]0.795800016403352[/C][/ROW]
[ROW][C]F-TEST (value)[/C][C]14.8836326453235[/C][/ROW]
[ROW][C]F-TEST (DF numerator)[/C][C]16[/C][/ROW]
[ROW][C]F-TEST (DF denominator)[/C][C]41[/C][/ROW]
[ROW][C]p-value[/C][C]2.99338331899435e-12[/C][/ROW]
[ROW][C]Multiple Linear Regression - Residual Statistics[/C][/ROW]
[ROW][C]Residual Standard Deviation[/C][C]4.12775134037727[/C][/ROW]
[ROW][C]Sum Squared Residuals[/C][C]698.57157624744[/C][/ROW]
[/TABLE]
Source: https://freestatistics.org/blog/index.php?pk=68424&T=3

Globally Unique Identifier (entire table): ba.freestatistics.org/blog/index.php?pk=68424&T=3

As an alternative you can also use a QR Code:  

The GUIDs for individual cells are displayed in the table below:

Multiple Linear Regression - Regression Statistics
Multiple R0.923644579935657
R-squared0.853119310044516
Adjusted R-squared0.795800016403352
F-TEST (value)14.8836326453235
F-TEST (DF numerator)16
F-TEST (DF denominator)41
p-value2.99338331899435e-12
Multiple Linear Regression - Residual Statistics
Residual Standard Deviation4.12775134037727
Sum Squared Residuals698.57157624744


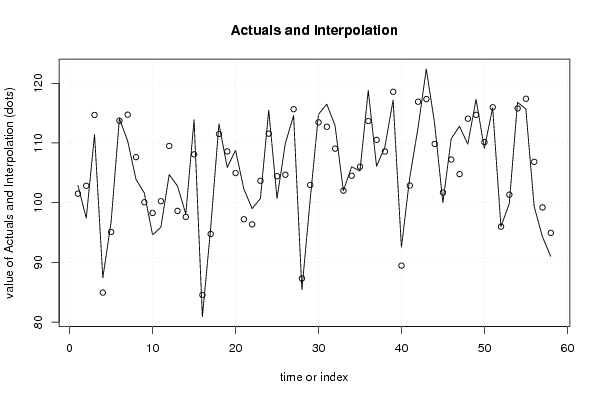
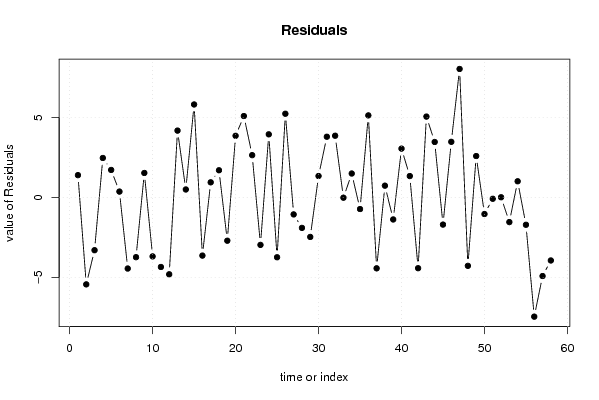
Multiple Linear Regression - Actuals, Interpolation, and Residuals
Time or IndexActualsInterpolationForecastResidualsPrediction Error
1102.9101.5063335757941.39366642420611
297.4102.824854731638-5.42485473163798
3111.4114.692189103620-3.29218910361967
487.484.9350249052772.46497509472299
596.895.08217072682211.71782927317787
6114.1113.7320925086690.367907491331412
7110.3114.736158435104-4.43615843510442
8103.9107.626497773072-3.72649777307151
9101.6100.0706016505091.52939834949111
1094.698.2777738713903-3.67777387139034
1195.9100.238506476044-4.33850647604386
12104.7109.495387627692-4.79538762769227
13102.898.62571312141394.17428687858613
1498.197.6017109639150.498289036084906
15113.9108.0954823204015.80451767959866
1680.984.5271038420985-3.6271038420985
1795.794.75438535593640.945614644063591
18113.2111.5032231566601.69677684334033
19105.9108.598683768368-2.69868376836808
20108.8104.9508168222183.84918317778176
21102.397.21761727271425.08238272728578
229996.3595824638942.64041753610607
23100.7103.660111573352-2.96011157335197
24115.5111.5592467628813.94075323711865
25100.7104.431864268411-3.73186426841052
26109.9104.6742849906145.22571500938608
27114.6115.657881352832-1.05788135283217
2885.487.3000756252388-1.90007562523883
29100.5102.963276993119-2.46327699311909
30114.8113.4601812443861.33981875561393
31116.5112.7090549594093.79094504059068
32112.9109.0466474228463.85335257715387
33102102.013891607234-0.013891607233505
34106104.5051421489771.49485785102269
35105.3106.022914285080-0.722914285079682
36118.8113.6784878024145.12151219758574
37106.1110.521972029268-4.42197202926804
38109.3108.5638468613950.736153138605223
39117.2118.572639445778-1.37263944577807
4092.589.45091232383113.04908767616888
41104.2102.8641331032921.33586689670847
42112.5116.915038754976-4.41503875497573
43122.4117.3511148857845.04888511421591
44113.3109.8371172903413.46288270965872
45100101.693082527210-1.69308252721041
46110.7107.2259940903863.47400590961351
47112.8104.7784676655248.02153233447551
48109.8114.066877807012-4.26687780701211
49117.3114.7141170051142.58588299488632
50109.1110.135302452438-1.03530245243822
51115.9115.981807777369-0.0818077773687492
529695.98688330355450.0131166964454565
5399.8101.336033820831-1.53603382083084
54116.8115.789464335311.01053566469005
55115.7117.404987951334-1.7049879513341
5699.4106.838920691523-7.43892069152284
5794.399.204806942333-4.90480694233298
589194.931507425352-3.93150742535194

\begin{tabular}{lllllllll}
\hline
Multiple Linear Regression - Actuals, Interpolation, and Residuals \tabularnewline
Time or Index & Actuals & InterpolationForecast & ResidualsPrediction Error \tabularnewline
1 & 102.9 & 101.506333575794 & 1.39366642420611 \tabularnewline
2 & 97.4 & 102.824854731638 & -5.42485473163798 \tabularnewline
3 & 111.4 & 114.692189103620 & -3.29218910361967 \tabularnewline
4 & 87.4 & 84.935024905277 & 2.46497509472299 \tabularnewline
5 & 96.8 & 95.0821707268221 & 1.71782927317787 \tabularnewline
6 & 114.1 & 113.732092508669 & 0.367907491331412 \tabularnewline
7 & 110.3 & 114.736158435104 & -4.43615843510442 \tabularnewline
8 & 103.9 & 107.626497773072 & -3.72649777307151 \tabularnewline
9 & 101.6 & 100.070601650509 & 1.52939834949111 \tabularnewline
10 & 94.6 & 98.2777738713903 & -3.67777387139034 \tabularnewline
11 & 95.9 & 100.238506476044 & -4.33850647604386 \tabularnewline
12 & 104.7 & 109.495387627692 & -4.79538762769227 \tabularnewline
13 & 102.8 & 98.6257131214139 & 4.17428687858613 \tabularnewline
14 & 98.1 & 97.601710963915 & 0.498289036084906 \tabularnewline
15 & 113.9 & 108.095482320401 & 5.80451767959866 \tabularnewline
16 & 80.9 & 84.5271038420985 & -3.6271038420985 \tabularnewline
17 & 95.7 & 94.7543853559364 & 0.945614644063591 \tabularnewline
18 & 113.2 & 111.503223156660 & 1.69677684334033 \tabularnewline
19 & 105.9 & 108.598683768368 & -2.69868376836808 \tabularnewline
20 & 108.8 & 104.950816822218 & 3.84918317778176 \tabularnewline
21 & 102.3 & 97.2176172727142 & 5.08238272728578 \tabularnewline
22 & 99 & 96.359582463894 & 2.64041753610607 \tabularnewline
23 & 100.7 & 103.660111573352 & -2.96011157335197 \tabularnewline
24 & 115.5 & 111.559246762881 & 3.94075323711865 \tabularnewline
25 & 100.7 & 104.431864268411 & -3.73186426841052 \tabularnewline
26 & 109.9 & 104.674284990614 & 5.22571500938608 \tabularnewline
27 & 114.6 & 115.657881352832 & -1.05788135283217 \tabularnewline
28 & 85.4 & 87.3000756252388 & -1.90007562523883 \tabularnewline
29 & 100.5 & 102.963276993119 & -2.46327699311909 \tabularnewline
30 & 114.8 & 113.460181244386 & 1.33981875561393 \tabularnewline
31 & 116.5 & 112.709054959409 & 3.79094504059068 \tabularnewline
32 & 112.9 & 109.046647422846 & 3.85335257715387 \tabularnewline
33 & 102 & 102.013891607234 & -0.013891607233505 \tabularnewline
34 & 106 & 104.505142148977 & 1.49485785102269 \tabularnewline
35 & 105.3 & 106.022914285080 & -0.722914285079682 \tabularnewline
36 & 118.8 & 113.678487802414 & 5.12151219758574 \tabularnewline
37 & 106.1 & 110.521972029268 & -4.42197202926804 \tabularnewline
38 & 109.3 & 108.563846861395 & 0.736153138605223 \tabularnewline
39 & 117.2 & 118.572639445778 & -1.37263944577807 \tabularnewline
40 & 92.5 & 89.4509123238311 & 3.04908767616888 \tabularnewline
41 & 104.2 & 102.864133103292 & 1.33586689670847 \tabularnewline
42 & 112.5 & 116.915038754976 & -4.41503875497573 \tabularnewline
43 & 122.4 & 117.351114885784 & 5.04888511421591 \tabularnewline
44 & 113.3 & 109.837117290341 & 3.46288270965872 \tabularnewline
45 & 100 & 101.693082527210 & -1.69308252721041 \tabularnewline
46 & 110.7 & 107.225994090386 & 3.47400590961351 \tabularnewline
47 & 112.8 & 104.778467665524 & 8.02153233447551 \tabularnewline
48 & 109.8 & 114.066877807012 & -4.26687780701211 \tabularnewline
49 & 117.3 & 114.714117005114 & 2.58588299488632 \tabularnewline
50 & 109.1 & 110.135302452438 & -1.03530245243822 \tabularnewline
51 & 115.9 & 115.981807777369 & -0.0818077773687492 \tabularnewline
52 & 96 & 95.9868833035545 & 0.0131166964454565 \tabularnewline
53 & 99.8 & 101.336033820831 & -1.53603382083084 \tabularnewline
54 & 116.8 & 115.78946433531 & 1.01053566469005 \tabularnewline
55 & 115.7 & 117.404987951334 & -1.7049879513341 \tabularnewline
56 & 99.4 & 106.838920691523 & -7.43892069152284 \tabularnewline
57 & 94.3 & 99.204806942333 & -4.90480694233298 \tabularnewline
58 & 91 & 94.931507425352 & -3.93150742535194 \tabularnewline
\hline
\end{tabular}
%Source: https://freestatistics.org/blog/index.php?pk=68424&T=4

[TABLE]
[ROW][C]Multiple Linear Regression - Actuals, Interpolation, and Residuals[/C][/ROW]
[ROW][C]Time or Index[/C][C]Actuals[/C][C]InterpolationForecast[/C][C]ResidualsPrediction Error[/C][/ROW]
[ROW][C]1[/C][C]102.9[/C][C]101.506333575794[/C][C]1.39366642420611[/C][/ROW]
[ROW][C]2[/C][C]97.4[/C][C]102.824854731638[/C][C]-5.42485473163798[/C][/ROW]
[ROW][C]3[/C][C]111.4[/C][C]114.692189103620[/C][C]-3.29218910361967[/C][/ROW]
[ROW][C]4[/C][C]87.4[/C][C]84.935024905277[/C][C]2.46497509472299[/C][/ROW]
[ROW][C]5[/C][C]96.8[/C][C]95.0821707268221[/C][C]1.71782927317787[/C][/ROW]
[ROW][C]6[/C][C]114.1[/C][C]113.732092508669[/C][C]0.367907491331412[/C][/ROW]
[ROW][C]7[/C][C]110.3[/C][C]114.736158435104[/C][C]-4.43615843510442[/C][/ROW]
[ROW][C]8[/C][C]103.9[/C][C]107.626497773072[/C][C]-3.72649777307151[/C][/ROW]
[ROW][C]9[/C][C]101.6[/C][C]100.070601650509[/C][C]1.52939834949111[/C][/ROW]
[ROW][C]10[/C][C]94.6[/C][C]98.2777738713903[/C][C]-3.67777387139034[/C][/ROW]
[ROW][C]11[/C][C]95.9[/C][C]100.238506476044[/C][C]-4.33850647604386[/C][/ROW]
[ROW][C]12[/C][C]104.7[/C][C]109.495387627692[/C][C]-4.79538762769227[/C][/ROW]
[ROW][C]13[/C][C]102.8[/C][C]98.6257131214139[/C][C]4.17428687858613[/C][/ROW]
[ROW][C]14[/C][C]98.1[/C][C]97.601710963915[/C][C]0.498289036084906[/C][/ROW]
[ROW][C]15[/C][C]113.9[/C][C]108.095482320401[/C][C]5.80451767959866[/C][/ROW]
[ROW][C]16[/C][C]80.9[/C][C]84.5271038420985[/C][C]-3.6271038420985[/C][/ROW]
[ROW][C]17[/C][C]95.7[/C][C]94.7543853559364[/C][C]0.945614644063591[/C][/ROW]
[ROW][C]18[/C][C]113.2[/C][C]111.503223156660[/C][C]1.69677684334033[/C][/ROW]
[ROW][C]19[/C][C]105.9[/C][C]108.598683768368[/C][C]-2.69868376836808[/C][/ROW]
[ROW][C]20[/C][C]108.8[/C][C]104.950816822218[/C][C]3.84918317778176[/C][/ROW]
[ROW][C]21[/C][C]102.3[/C][C]97.2176172727142[/C][C]5.08238272728578[/C][/ROW]
[ROW][C]22[/C][C]99[/C][C]96.359582463894[/C][C]2.64041753610607[/C][/ROW]
[ROW][C]23[/C][C]100.7[/C][C]103.660111573352[/C][C]-2.96011157335197[/C][/ROW]
[ROW][C]24[/C][C]115.5[/C][C]111.559246762881[/C][C]3.94075323711865[/C][/ROW]
[ROW][C]25[/C][C]100.7[/C][C]104.431864268411[/C][C]-3.73186426841052[/C][/ROW]
[ROW][C]26[/C][C]109.9[/C][C]104.674284990614[/C][C]5.22571500938608[/C][/ROW]
[ROW][C]27[/C][C]114.6[/C][C]115.657881352832[/C][C]-1.05788135283217[/C][/ROW]
[ROW][C]28[/C][C]85.4[/C][C]87.3000756252388[/C][C]-1.90007562523883[/C][/ROW]
[ROW][C]29[/C][C]100.5[/C][C]102.963276993119[/C][C]-2.46327699311909[/C][/ROW]
[ROW][C]30[/C][C]114.8[/C][C]113.460181244386[/C][C]1.33981875561393[/C][/ROW]
[ROW][C]31[/C][C]116.5[/C][C]112.709054959409[/C][C]3.79094504059068[/C][/ROW]
[ROW][C]32[/C][C]112.9[/C][C]109.046647422846[/C][C]3.85335257715387[/C][/ROW]
[ROW][C]33[/C][C]102[/C][C]102.013891607234[/C][C]-0.013891607233505[/C][/ROW]
[ROW][C]34[/C][C]106[/C][C]104.505142148977[/C][C]1.49485785102269[/C][/ROW]
[ROW][C]35[/C][C]105.3[/C][C]106.022914285080[/C][C]-0.722914285079682[/C][/ROW]
[ROW][C]36[/C][C]118.8[/C][C]113.678487802414[/C][C]5.12151219758574[/C][/ROW]
[ROW][C]37[/C][C]106.1[/C][C]110.521972029268[/C][C]-4.42197202926804[/C][/ROW]
[ROW][C]38[/C][C]109.3[/C][C]108.563846861395[/C][C]0.736153138605223[/C][/ROW]
[ROW][C]39[/C][C]117.2[/C][C]118.572639445778[/C][C]-1.37263944577807[/C][/ROW]
[ROW][C]40[/C][C]92.5[/C][C]89.4509123238311[/C][C]3.04908767616888[/C][/ROW]
[ROW][C]41[/C][C]104.2[/C][C]102.864133103292[/C][C]1.33586689670847[/C][/ROW]
[ROW][C]42[/C][C]112.5[/C][C]116.915038754976[/C][C]-4.41503875497573[/C][/ROW]
[ROW][C]43[/C][C]122.4[/C][C]117.351114885784[/C][C]5.04888511421591[/C][/ROW]
[ROW][C]44[/C][C]113.3[/C][C]109.837117290341[/C][C]3.46288270965872[/C][/ROW]
[ROW][C]45[/C][C]100[/C][C]101.693082527210[/C][C]-1.69308252721041[/C][/ROW]
[ROW][C]46[/C][C]110.7[/C][C]107.225994090386[/C][C]3.47400590961351[/C][/ROW]
[ROW][C]47[/C][C]112.8[/C][C]104.778467665524[/C][C]8.02153233447551[/C][/ROW]
[ROW][C]48[/C][C]109.8[/C][C]114.066877807012[/C][C]-4.26687780701211[/C][/ROW]
[ROW][C]49[/C][C]117.3[/C][C]114.714117005114[/C][C]2.58588299488632[/C][/ROW]
[ROW][C]50[/C][C]109.1[/C][C]110.135302452438[/C][C]-1.03530245243822[/C][/ROW]
[ROW][C]51[/C][C]115.9[/C][C]115.981807777369[/C][C]-0.0818077773687492[/C][/ROW]
[ROW][C]52[/C][C]96[/C][C]95.9868833035545[/C][C]0.0131166964454565[/C][/ROW]
[ROW][C]53[/C][C]99.8[/C][C]101.336033820831[/C][C]-1.53603382083084[/C][/ROW]
[ROW][C]54[/C][C]116.8[/C][C]115.78946433531[/C][C]1.01053566469005[/C][/ROW]
[ROW][C]55[/C][C]115.7[/C][C]117.404987951334[/C][C]-1.7049879513341[/C][/ROW]
[ROW][C]56[/C][C]99.4[/C][C]106.838920691523[/C][C]-7.43892069152284[/C][/ROW]
[ROW][C]57[/C][C]94.3[/C][C]99.204806942333[/C][C]-4.90480694233298[/C][/ROW]
[ROW][C]58[/C][C]91[/C][C]94.931507425352[/C][C]-3.93150742535194[/C][/ROW]
[/TABLE]
Source: https://freestatistics.org/blog/index.php?pk=68424&T=4

Globally Unique Identifier (entire table): ba.freestatistics.org/blog/index.php?pk=68424&T=4

As an alternative you can also use a QR Code:  

The GUIDs for individual cells are displayed in the table below:

Multiple Linear Regression - Actuals, Interpolation, and Residuals
Time or IndexActualsInterpolationForecastResidualsPrediction Error
1102.9101.5063335757941.39366642420611
297.4102.824854731638-5.42485473163798
3111.4114.692189103620-3.29218910361967
487.484.9350249052772.46497509472299
596.895.08217072682211.71782927317787
6114.1113.7320925086690.367907491331412
7110.3114.736158435104-4.43615843510442
8103.9107.626497773072-3.72649777307151
9101.6100.0706016505091.52939834949111
1094.698.2777738713903-3.67777387139034
1195.9100.238506476044-4.33850647604386
12104.7109.495387627692-4.79538762769227
13102.898.62571312141394.17428687858613
1498.197.6017109639150.498289036084906
15113.9108.0954823204015.80451767959866
1680.984.5271038420985-3.6271038420985
1795.794.75438535593640.945614644063591
18113.2111.5032231566601.69677684334033
19105.9108.598683768368-2.69868376836808
20108.8104.9508168222183.84918317778176
21102.397.21761727271425.08238272728578
229996.3595824638942.64041753610607
23100.7103.660111573352-2.96011157335197
24115.5111.5592467628813.94075323711865
25100.7104.431864268411-3.73186426841052
26109.9104.6742849906145.22571500938608
27114.6115.657881352832-1.05788135283217
2885.487.3000756252388-1.90007562523883
29100.5102.963276993119-2.46327699311909
30114.8113.4601812443861.33981875561393
31116.5112.7090549594093.79094504059068
32112.9109.0466474228463.85335257715387
33102102.013891607234-0.013891607233505
34106104.5051421489771.49485785102269
35105.3106.022914285080-0.722914285079682
36118.8113.6784878024145.12151219758574
37106.1110.521972029268-4.42197202926804
38109.3108.5638468613950.736153138605223
39117.2118.572639445778-1.37263944577807
4092.589.45091232383113.04908767616888
41104.2102.8641331032921.33586689670847
42112.5116.915038754976-4.41503875497573
43122.4117.3511148857845.04888511421591
44113.3109.8371172903413.46288270965872
45100101.693082527210-1.69308252721041
46110.7107.2259940903863.47400590961351
47112.8104.7784676655248.02153233447551
48109.8114.066877807012-4.26687780701211
49117.3114.7141170051142.58588299488632
50109.1110.135302452438-1.03530245243822
51115.9115.981807777369-0.0818077773687492
529695.98688330355450.0131166964454565
5399.8101.336033820831-1.53603382083084
54116.8115.789464335311.01053566469005
55115.7117.404987951334-1.7049879513341
5699.4106.838920691523-7.43892069152284
5794.399.204806942333-4.90480694233298
589194.931507425352-3.93150742535194


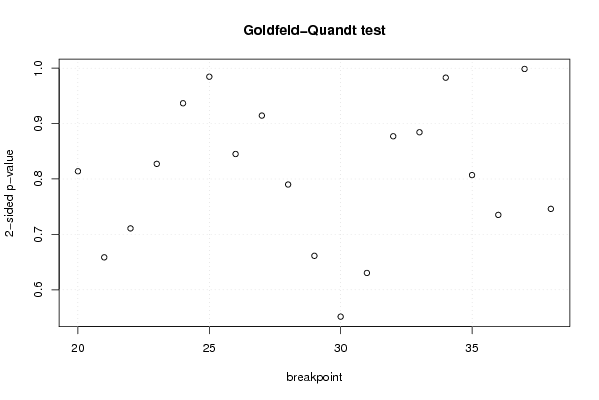
Goldfeld-Quandt test for Heteroskedasticity
p-valuesAlternative Hypothesis
breakpoint indexgreater2-sidedless
200.406973692715620.813947385431240.59302630728438
210.3292935697488240.6585871394976480.670706430251176
220.3554283823488110.7108567646976210.64457161765119
230.4136574777092450.8273149554184890.586342522290755
240.4683618874973720.9367237749947440.531638112502628
250.507712447669770.984575104660460.49228755233023
260.5774419929667820.8451160140664360.422558007033218
270.4572308491990690.9144616983981380.542769150800931
280.3950098432654450.790019686530890.604990156734555
290.3306589399874520.6613178799749040.669341060012548
300.2757505533413530.5515011066827070.724249446658647
310.3151977771646320.6303955543292640.684802222835368
320.4385672891708510.8771345783417020.561432710829149
330.4421815647381560.8843631294763110.557818435261844
340.4914453005713190.9828906011426370.508554699428681
350.596472015269060.807055969461880.40352798473094
360.6324176549794710.7351646900410570.367582345020529
370.499322440159630.998644880319260.50067755984037
380.3730438464486390.7460876928972780.626956153551361

\begin{tabular}{lllllllll}
\hline
Goldfeld-Quandt test for Heteroskedasticity \tabularnewline
p-values & Alternative Hypothesis \tabularnewline
breakpoint index & greater & 2-sided & less \tabularnewline
20 & 0.40697369271562 & 0.81394738543124 & 0.59302630728438 \tabularnewline
21 & 0.329293569748824 & 0.658587139497648 & 0.670706430251176 \tabularnewline
22 & 0.355428382348811 & 0.710856764697621 & 0.64457161765119 \tabularnewline
23 & 0.413657477709245 & 0.827314955418489 & 0.586342522290755 \tabularnewline
24 & 0.468361887497372 & 0.936723774994744 & 0.531638112502628 \tabularnewline
25 & 0.50771244766977 & 0.98457510466046 & 0.49228755233023 \tabularnewline
26 & 0.577441992966782 & 0.845116014066436 & 0.422558007033218 \tabularnewline
27 & 0.457230849199069 & 0.914461698398138 & 0.542769150800931 \tabularnewline
28 & 0.395009843265445 & 0.79001968653089 & 0.604990156734555 \tabularnewline
29 & 0.330658939987452 & 0.661317879974904 & 0.669341060012548 \tabularnewline
30 & 0.275750553341353 & 0.551501106682707 & 0.724249446658647 \tabularnewline
31 & 0.315197777164632 & 0.630395554329264 & 0.684802222835368 \tabularnewline
32 & 0.438567289170851 & 0.877134578341702 & 0.561432710829149 \tabularnewline
33 & 0.442181564738156 & 0.884363129476311 & 0.557818435261844 \tabularnewline
34 & 0.491445300571319 & 0.982890601142637 & 0.508554699428681 \tabularnewline
35 & 0.59647201526906 & 0.80705596946188 & 0.40352798473094 \tabularnewline
36 & 0.632417654979471 & 0.735164690041057 & 0.367582345020529 \tabularnewline
37 & 0.49932244015963 & 0.99864488031926 & 0.50067755984037 \tabularnewline
38 & 0.373043846448639 & 0.746087692897278 & 0.626956153551361 \tabularnewline
\hline
\end{tabular}
%Source: https://freestatistics.org/blog/index.php?pk=68424&T=5

[TABLE]
[ROW][C]Goldfeld-Quandt test for Heteroskedasticity[/C][/ROW]
[ROW][C]p-values[/C][C]Alternative Hypothesis[/C][/ROW]
[ROW][C]breakpoint index[/C][C]greater[/C][C]2-sided[/C][C]less[/C][/ROW]
[ROW][C]20[/C][C]0.40697369271562[/C][C]0.81394738543124[/C][C]0.59302630728438[/C][/ROW]
[ROW][C]21[/C][C]0.329293569748824[/C][C]0.658587139497648[/C][C]0.670706430251176[/C][/ROW]
[ROW][C]22[/C][C]0.355428382348811[/C][C]0.710856764697621[/C][C]0.64457161765119[/C][/ROW]
[ROW][C]23[/C][C]0.413657477709245[/C][C]0.827314955418489[/C][C]0.586342522290755[/C][/ROW]
[ROW][C]24[/C][C]0.468361887497372[/C][C]0.936723774994744[/C][C]0.531638112502628[/C][/ROW]
[ROW][C]25[/C][C]0.50771244766977[/C][C]0.98457510466046[/C][C]0.49228755233023[/C][/ROW]
[ROW][C]26[/C][C]0.577441992966782[/C][C]0.845116014066436[/C][C]0.422558007033218[/C][/ROW]
[ROW][C]27[/C][C]0.457230849199069[/C][C]0.914461698398138[/C][C]0.542769150800931[/C][/ROW]
[ROW][C]28[/C][C]0.395009843265445[/C][C]0.79001968653089[/C][C]0.604990156734555[/C][/ROW]
[ROW][C]29[/C][C]0.330658939987452[/C][C]0.661317879974904[/C][C]0.669341060012548[/C][/ROW]
[ROW][C]30[/C][C]0.275750553341353[/C][C]0.551501106682707[/C][C]0.724249446658647[/C][/ROW]
[ROW][C]31[/C][C]0.315197777164632[/C][C]0.630395554329264[/C][C]0.684802222835368[/C][/ROW]
[ROW][C]32[/C][C]0.438567289170851[/C][C]0.877134578341702[/C][C]0.561432710829149[/C][/ROW]
[ROW][C]33[/C][C]0.442181564738156[/C][C]0.884363129476311[/C][C]0.557818435261844[/C][/ROW]
[ROW][C]34[/C][C]0.491445300571319[/C][C]0.982890601142637[/C][C]0.508554699428681[/C][/ROW]
[ROW][C]35[/C][C]0.59647201526906[/C][C]0.80705596946188[/C][C]0.40352798473094[/C][/ROW]
[ROW][C]36[/C][C]0.632417654979471[/C][C]0.735164690041057[/C][C]0.367582345020529[/C][/ROW]
[ROW][C]37[/C][C]0.49932244015963[/C][C]0.99864488031926[/C][C]0.50067755984037[/C][/ROW]
[ROW][C]38[/C][C]0.373043846448639[/C][C]0.746087692897278[/C][C]0.626956153551361[/C][/ROW]
[/TABLE]
Source: https://freestatistics.org/blog/index.php?pk=68424&T=5

Globally Unique Identifier (entire table): ba.freestatistics.org/blog/index.php?pk=68424&T=5

As an alternative you can also use a QR Code:  

The GUIDs for individual cells are displayed in the table below:

Goldfeld-Quandt test for Heteroskedasticity
p-valuesAlternative Hypothesis
breakpoint indexgreater2-sidedless
200.406973692715620.813947385431240.59302630728438
210.3292935697488240.6585871394976480.670706430251176
220.3554283823488110.7108567646976210.64457161765119
230.4136574777092450.8273149554184890.586342522290755
240.4683618874973720.9367237749947440.531638112502628
250.507712447669770.984575104660460.49228755233023
260.5774419929667820.8451160140664360.422558007033218
270.4572308491990690.9144616983981380.542769150800931
280.3950098432654450.790019686530890.604990156734555
290.3306589399874520.6613178799749040.669341060012548
300.2757505533413530.5515011066827070.724249446658647
310.3151977771646320.6303955543292640.684802222835368
320.4385672891708510.8771345783417020.561432710829149
330.4421815647381560.8843631294763110.557818435261844
340.4914453005713190.9828906011426370.508554699428681
350.596472015269060.807055969461880.40352798473094
360.6324176549794710.7351646900410570.367582345020529
370.499322440159630.998644880319260.50067755984037
380.3730438464486390.7460876928972780.626956153551361


Meta Analysis of Goldfeld-Quandt test for Heteroskedasticity
Description# significant tests% significant testsOK/NOK
1% type I error level00OK
5% type I error level00OK
10% type I error level00OK

\begin{tabular}{lllllllll}
\hline
Meta Analysis of Goldfeld-Quandt test for Heteroskedasticity \tabularnewline
Description & # significant tests & % significant tests & OK/NOK \tabularnewline
1% type I error level & 0 & 0 & OK \tabularnewline
5% type I error level & 0 & 0 & OK \tabularnewline
10% type I error level & 0 & 0 & OK \tabularnewline
\hline
\end{tabular}
%Source: https://freestatistics.org/blog/index.php?pk=68424&T=6

[TABLE]
[ROW][C]Meta Analysis of Goldfeld-Quandt test for Heteroskedasticity[/C][/ROW]
[ROW][C]Description[/C][C]# significant tests[/C][C]% significant tests[/C][C]OK/NOK[/C][/ROW]
[ROW][C]1% type I error level[/C][C]0[/C][C]0[/C][C]OK[/C][/ROW]
[ROW][C]5% type I error level[/C][C]0[/C][C]0[/C][C]OK[/C][/ROW]
[ROW][C]10% type I error level[/C][C]0[/C][C]0[/C][C]OK[/C][/ROW]
[/TABLE]
Source: https://freestatistics.org/blog/index.php?pk=68424&T=6

Globally Unique Identifier (entire table): ba.freestatistics.org/blog/index.php?pk=68424&T=6

As an alternative you can also use a QR Code:  

The GUIDs for individual cells are displayed in the table below:

Meta Analysis of Goldfeld-Quandt test for Heteroskedasticity
Description# significant tests% significant testsOK/NOK
1% type I error level00OK
5% type I error level00OK
10% type I error level00OK


Parameters (Session):
par1 = 1 ; par2 = Include Monthly Dummies ; par3 = Linear Trend ;
Parameters (R input):
par1 = 1 ; par2 = Include Monthly Dummies ; par3 = Linear Trend ;
R code (references can be found in the software module):
library(lattice)
library(lmtest)
n25 <- 25 #minimum number of obs. for Goldfeld-Quandt test
par1 <- as.numeric(par1)
x <- t(y)
k <- length(x[1,])
n <- length(x[,1])
x1 <- cbind(x[,par1], x[,1:k!=par1])
mycolnames <- c(colnames(x)[par1], colnames(x)[1:k!=par1])
colnames(x1) <- mycolnames #colnames(x)[par1]
x <- x1
if (par3 == 'First Differences'){
x2 <- array(0, dim=c(n-1,k), dimnames=list(1:(n-1), paste('(1-B)',colnames(x),sep='')))
for (i in 1:n-1) {
for (j in 1:k) {
x2[i,j] <- x[i+1,j] - x[i,j]
}
}
x <- x2
}
if (par2 == 'Include Monthly Dummies'){
x2 <- array(0, dim=c(n,11), dimnames=list(1:n, paste('M', seq(1:11), sep ='')))
for (i in 1:11){
x2[seq(i,n,12),i] <- 1
}
x <- cbind(x, x2)
}
if (par2 == 'Include Quarterly Dummies'){
x2 <- array(0, dim=c(n,3), dimnames=list(1:n, paste('Q', seq(1:3), sep ='')))
for (i in 1:3){
x2[seq(i,n,4),i] <- 1
}
x <- cbind(x, x2)
}
k <- length(x[1,])
if (par3 == 'Linear Trend'){
x <- cbind(x, c(1:n))
colnames(x)[k+1] <- 't'
}
x
k <- length(x[1,])
df <- as.data.frame(x)
(mylm <- lm(df))
(mysum <- summary(mylm))
if (n > n25) {
kp3 <- k + 3
nmkm3 <- n - k - 3
gqarr <- array(NA, dim=c(nmkm3-kp3+1,3))
numgqtests <- 0
numsignificant1 <- 0
numsignificant5 <- 0
numsignificant10 <- 0
for (mypoint in kp3:nmkm3) {
j <- 0
numgqtests <- numgqtests + 1
for (myalt in c('greater', 'two.sided', 'less')) {
j <- j + 1
gqarr[mypoint-kp3+1,j] <- gqtest(mylm, point=mypoint, alternative=myalt)$p.value
}
if (gqarr[mypoint-kp3+1,2] < 0.01) numsignificant1 <- numsignificant1 + 1
if (gqarr[mypoint-kp3+1,2] < 0.05) numsignificant5 <- numsignificant5 + 1
if (gqarr[mypoint-kp3+1,2] < 0.10) numsignificant10 <- numsignificant10 + 1
}
gqarr
}
bitmap(file='test0.png')
plot(x[,1], type='l', main='Actuals and Interpolation', ylab='value of Actuals and Interpolation (dots)', xlab='time or index')
points(x[,1]-mysum$resid)
grid()
dev.off()
bitmap(file='test1.png')
plot(mysum$resid, type='b', pch=19, main='Residuals', ylab='value of Residuals', xlab='time or index')
grid()
dev.off()
bitmap(file='test2.png')
hist(mysum$resid, main='Residual Histogram', xlab='values of Residuals')
grid()
dev.off()
bitmap(file='test3.png')
densityplot(~mysum$resid,col='black',main='Residual Density Plot', xlab='values of Residuals')
dev.off()
bitmap(file='test4.png')
qqnorm(mysum$resid, main='Residual Normal Q-Q Plot')
qqline(mysum$resid)
grid()
dev.off()
(myerror <- as.ts(mysum$resid))
bitmap(file='test5.png')
dum <- cbind(lag(myerror,k=1),myerror)
dum
dum1 <- dum[2:length(myerror),]
dum1
z <- as.data.frame(dum1)
z
plot(z,main=paste('Residual Lag plot, lowess, and regression line'), ylab='values of Residuals', xlab='lagged values of Residuals')
lines(lowess(z))
abline(lm(z))
grid()
dev.off()
bitmap(file='test6.png')
acf(mysum$resid, lag.max=length(mysum$resid)/2, main='Residual Autocorrelation Function')
grid()
dev.off()
bitmap(file='test7.png')
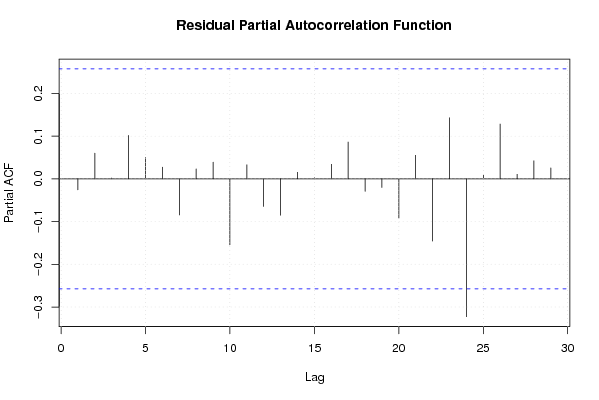
pacf(mysum$resid, lag.max=length(mysum$resid)/2, main='Residual Partial Autocorrelation Function')
grid()
dev.off()
bitmap(file='test8.png')
opar <- par(mfrow = c(2,2), oma = c(0, 0, 1.1, 0))
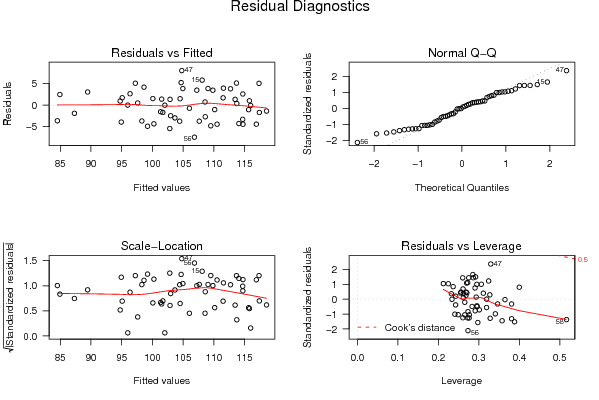
plot(mylm, las = 1, sub='Residual Diagnostics')
par(opar)
dev.off()
if (n > n25) {
bitmap(file='test9.png')
plot(kp3:nmkm3,gqarr[,2], main='Goldfeld-Quandt test',ylab='2-sided p-value',xlab='breakpoint')
grid()
dev.off()
}
load(file='createtable')
a<-table.start()
a<-table.row.start(a)
a<-table.element(a, 'Multiple Linear Regression - Estimated Regression Equation', 1, TRUE)
a<-table.row.end(a)
myeq <- colnames(x)[1]
myeq <- paste(myeq, '[t] = ', sep='')
for (i in 1:k){
if (mysum$coefficients[i,1] > 0) myeq <- paste(myeq, '+', '')
myeq <- paste(myeq, mysum$coefficients[i,1], sep=' ')
if (rownames(mysum$coefficients)[i] != '(Intercept)') {
myeq <- paste(myeq, rownames(mysum$coefficients)[i], sep='')
if (rownames(mysum$coefficients)[i] != 't') myeq <- paste(myeq, '[t]', sep='')
}
}
myeq <- paste(myeq, ' + e[t]')
a<-table.row.start(a)
a<-table.element(a, myeq)
a<-table.row.end(a)
a<-table.end(a)
table.save(a,file='mytable1.tab')
a<-table.start()
a<-table.row.start(a)
a<-table.element(a,hyperlink('ols1.htm','Multiple Linear Regression - Ordinary Least Squares',''), 6, TRUE)
a<-table.row.end(a)
a<-table.row.start(a)
a<-table.element(a,'Variable',header=TRUE)
a<-table.element(a,'Parameter',header=TRUE)
a<-table.element(a,'S.D.',header=TRUE)
a<-table.element(a,'T-STAT
H0: parameter = 0',header=TRUE)
a<-table.element(a,'2-tail p-value',header=TRUE)
a<-table.element(a,'1-tail p-value',header=TRUE)
a<-table.row.end(a)
for (i in 1:k){
a<-table.row.start(a)
a<-table.element(a,rownames(mysum$coefficients)[i],header=TRUE)
a<-table.element(a,mysum$coefficients[i,1])
a<-table.element(a, round(mysum$coefficients[i,2],6))
a<-table.element(a, round(mysum$coefficients[i,3],4))
a<-table.element(a, round(mysum$coefficients[i,4],6))
a<-table.element(a, round(mysum$coefficients[i,4]/2,6))
a<-table.row.end(a)
}
a<-table.end(a)
table.save(a,file='mytable2.tab')
a<-table.start()
a<-table.row.start(a)
a<-table.element(a, 'Multiple Linear Regression - Regression Statistics', 2, TRUE)
a<-table.row.end(a)
a<-table.row.start(a)
a<-table.element(a, 'Multiple R',1,TRUE)
a<-table.element(a, sqrt(mysum$r.squared))
a<-table.row.end(a)
a<-table.row.start(a)
a<-table.element(a, 'R-squared',1,TRUE)
a<-table.element(a, mysum$r.squared)
a<-table.row.end(a)
a<-table.row.start(a)
a<-table.element(a, 'Adjusted R-squared',1,TRUE)
a<-table.element(a, mysum$adj.r.squared)
a<-table.row.end(a)
a<-table.row.start(a)
a<-table.element(a, 'F-TEST (value)',1,TRUE)
a<-table.element(a, mysum$fstatistic[1])
a<-table.row.end(a)
a<-table.row.start(a)
a<-table.element(a, 'F-TEST (DF numerator)',1,TRUE)
a<-table.element(a, mysum$fstatistic[2])
a<-table.row.end(a)
a<-table.row.start(a)
a<-table.element(a, 'F-TEST (DF denominator)',1,TRUE)
a<-table.element(a, mysum$fstatistic[3])
a<-table.row.end(a)
a<-table.row.start(a)
a<-table.element(a, 'p-value',1,TRUE)
a<-table.element(a, 1-pf(mysum$fstatistic[1],mysum$fstatistic[2],mysum$fstatistic[3]))
a<-table.row.end(a)
a<-table.row.start(a)
a<-table.element(a, 'Multiple Linear Regression - Residual Statistics', 2, TRUE)
a<-table.row.end(a)
a<-table.row.start(a)
a<-table.element(a, 'Residual Standard Deviation',1,TRUE)
a<-table.element(a, mysum$sigma)
a<-table.row.end(a)
a<-table.row.start(a)
a<-table.element(a, 'Sum Squared Residuals',1,TRUE)
a<-table.element(a, sum(myerror*myerror))
a<-table.row.end(a)
a<-table.end(a)
table.save(a,file='mytable3.tab')
a<-table.start()
a<-table.row.start(a)
a<-table.element(a, 'Multiple Linear Regression - Actuals, Interpolation, and Residuals', 4, TRUE)
a<-table.row.end(a)
a<-table.row.start(a)
a<-table.element(a, 'Time or Index', 1, TRUE)
a<-table.element(a, 'Actuals', 1, TRUE)
a<-table.element(a, 'Interpolation
Forecast', 1, TRUE)
a<-table.element(a, 'Residuals
Prediction Error', 1, TRUE)
a<-table.row.end(a)
for (i in 1:n) {
a<-table.row.start(a)
a<-table.element(a,i, 1, TRUE)
a<-table.element(a,x[i])
a<-table.element(a,x[i]-mysum$resid[i])
a<-table.element(a,mysum$resid[i])
a<-table.row.end(a)
}
a<-table.end(a)
table.save(a,file='mytable4.tab')
if (n > n25) {
a<-table.start()
a<-table.row.start(a)
a<-table.element(a,'Goldfeld-Quandt test for Heteroskedasticity',4,TRUE)
a<-table.row.end(a)
a<-table.row.start(a)
a<-table.element(a,'p-values',header=TRUE)
a<-table.element(a,'Alternative Hypothesis',3,header=TRUE)
a<-table.row.end(a)
a<-table.row.start(a)
a<-table.element(a,'breakpoint index',header=TRUE)
a<-table.element(a,'greater',header=TRUE)
a<-table.element(a,'2-sided',header=TRUE)
a<-table.element(a,'less',header=TRUE)
a<-table.row.end(a)
for (mypoint in kp3:nmkm3) {
a<-table.row.start(a)
a<-table.element(a,mypoint,header=TRUE)
a<-table.element(a,gqarr[mypoint-kp3+1,1])
a<-table.element(a,gqarr[mypoint-kp3+1,2])
a<-table.element(a,gqarr[mypoint-kp3+1,3])
a<-table.row.end(a)
}
a<-table.end(a)
table.save(a,file='mytable5.tab')
a<-table.start()
a<-table.row.start(a)
a<-table.element(a,'Meta Analysis of Goldfeld-Quandt test for Heteroskedasticity',4,TRUE)
a<-table.row.end(a)
a<-table.row.start(a)
a<-table.element(a,'Description',header=TRUE)
a<-table.element(a,'# significant tests',header=TRUE)
a<-table.element(a,'% significant tests',header=TRUE)
a<-table.element(a,'OK/NOK',header=TRUE)
a<-table.row.end(a)
a<-table.row.start(a)
a<-table.element(a,'1% type I error level',header=TRUE)
a<-table.element(a,numsignificant1)
a<-table.element(a,numsignificant1/numgqtests)
if (numsignificant1/numgqtests < 0.01) dum <- 'OK' else dum <- 'NOK'
a<-table.element(a,dum)
a<-table.row.end(a)
a<-table.row.start(a)
a<-table.element(a,'5% type I error level',header=TRUE)
a<-table.element(a,numsignificant5)
a<-table.element(a,numsignificant5/numgqtests)
if (numsignificant5/numgqtests < 0.05) dum <- 'OK' else dum <- 'NOK'
a<-table.element(a,dum)
a<-table.row.end(a)
a<-table.row.start(a)
a<-table.element(a,'10% type I error level',header=TRUE)
a<-table.element(a,numsignificant10)
a<-table.element(a,numsignificant10/numgqtests)
if (numsignificant10/numgqtests < 0.1) dum <- 'OK' else dum <- 'NOK'
a<-table.element(a,dum)
a<-table.row.end(a)
a<-table.end(a)
table.save(a,file='mytable6.tab')
}