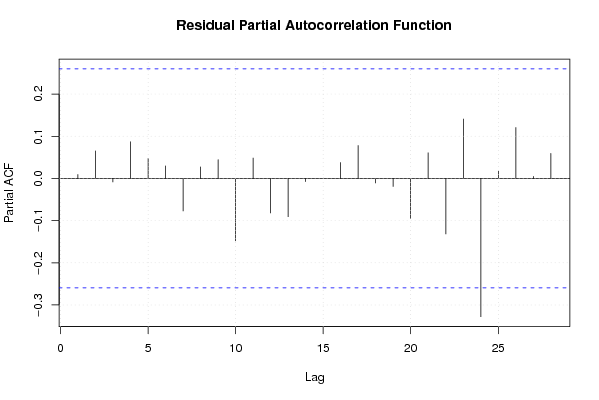
| Multiple Linear Regression - Estimated Regression Equation |
| Y[t] = -38.0009327756717 + 0.0702381579760955X[t] + 0.121123120132540Y1[t] + 0.452742857897186Y2[t] + 0.733822466637121Y3[t] + 0.0310925954506842Y4[t] -4.98250336335315M1[t] + 0.511931555884507M2[t] -24.2147514902035M3[t] -13.8700341648047M4[t] + 4.55421564347214M5[t] + 17.3762426394411M6[t] -2.40026840685621M7[t] -20.1709936068584M8[t] -16.2763932431094M9[t] -7.26353676755452M10[t] + 7.27102447826702M11[t] -0.056984051960174t + e[t] |
| Multiple Linear Regression - Ordinary Least Squares | |||||
| Variable | Parameter | S.D. | T-STAT H0: parameter = 0 | 2-tail p-value | 1-tail p-value |
| (Intercept) | -38.0009327756717 | 47.006737 | -0.8084 | 0.423756 | 0.211878 |
| X | 0.0702381579760955 | 0.147125 | 0.4774 | 0.635739 | 0.317869 |
| Y1 | 0.121123120132540 | 0.164451 | 0.7365 | 0.465815 | 0.232908 |
| Y2 | 0.452742857897186 | 0.154436 | 2.9316 | 0.005616 | 0.002808 |
| Y3 | 0.733822466637121 | 0.185307 | 3.96 | 0.000309 | 0.000154 |
| Y4 | 0.0310925954506842 | 0.205663 | 0.1512 | 0.880611 | 0.440306 |
| M1 | -4.98250336335315 | 3.398698 | -1.466 | 0.150664 | 0.075332 |
| M2 | 0.511931555884507 | 3.916573 | 0.1307 | 0.896677 | 0.448339 |
| M3 | -24.2147514902035 | 6.27432 | -3.8593 | 0.000416 | 0.000208 |
| M4 | -13.8700341648047 | 8.073987 | -1.7179 | 0.093752 | 0.046876 |
| M5 | 4.55421564347214 | 6.980102 | 0.6525 | 0.517934 | 0.258967 |
| M6 | 17.3762426394411 | 5.258601 | 3.3043 | 0.002048 | 0.001024 |
| M7 | -2.40026840685621 | 4.933543 | -0.4865 | 0.629321 | 0.314661 |
| M8 | -20.1709936068584 | 4.983499 | -4.0476 | 0.000237 | 0.000119 |
| M9 | -16.2763932431094 | 6.51345 | -2.4989 | 0.016779 | 0.008389 |
| M10 | -7.26353676755452 | 5.493703 | -1.3222 | 0.193818 | 0.096909 |
| M11 | 7.27102447826702 | 4.006508 | 1.8148 | 0.077251 | 0.038625 |
| t | -0.056984051960174 | 0.107224 | -0.5314 | 0.598123 | 0.299062 |
| Multiple Linear Regression - Regression Statistics | |
| Multiple R | 0.92390862741869 |
| R-squared | 0.853607151818689 |
| Adjusted R-squared | 0.789794884662732 |
| F-TEST (value) | 13.3768504060902 |
| F-TEST (DF numerator) | 17 |
| F-TEST (DF denominator) | 39 |
| p-value | 2.49332776647293e-11 |
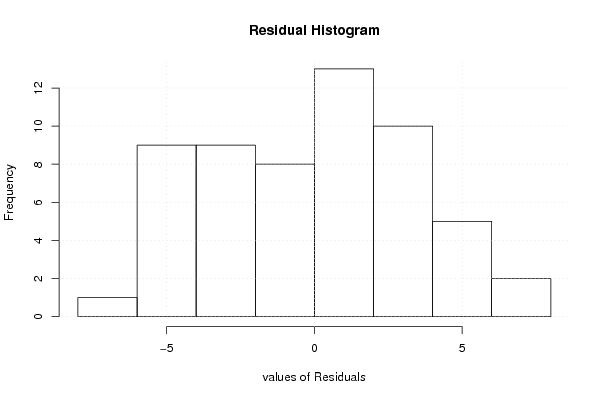
| Multiple Linear Regression - Residual Statistics | |
| Residual Standard Deviation | 4.22248137423918 |
| Sum Squared Residuals | 695.344609276074 |
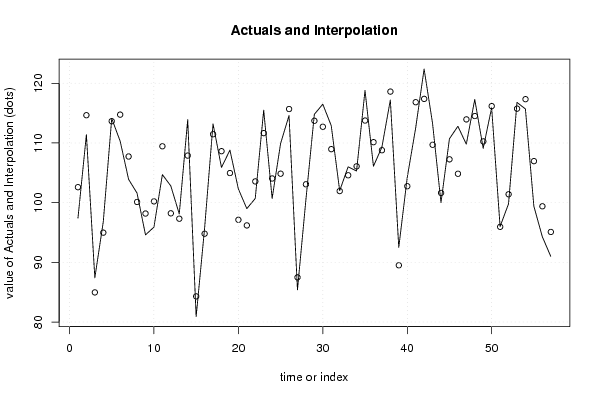
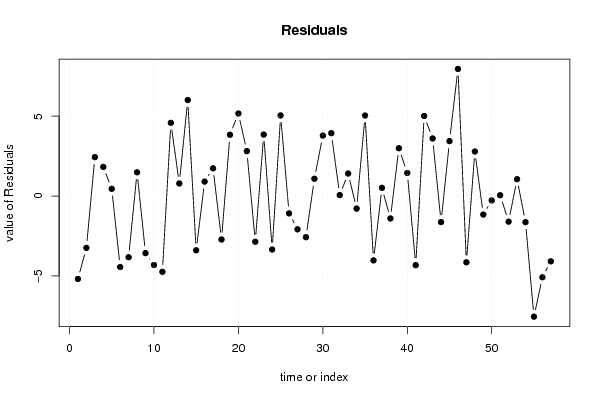
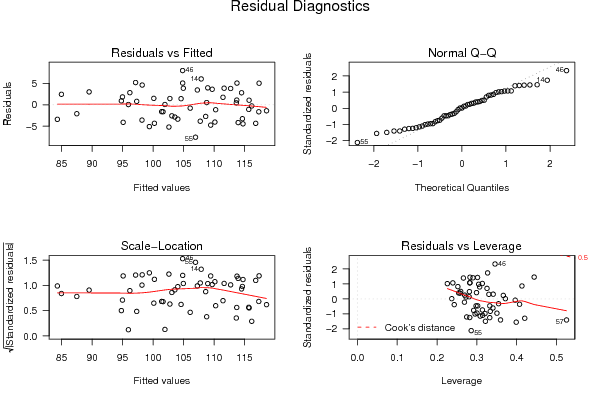
| Multiple Linear Regression - Actuals, Interpolation, and Residuals | |||
| Time or Index | Actuals | Interpolation Forecast | Residuals Prediction Error |
| 1 | 97.4 | 102.592104056102 | -5.19210405610183 |
| 2 | 111.4 | 114.647062728769 | -3.24706272876941 |
| 3 | 87.4 | 84.9645390147898 | 2.43546098521025 |
| 4 | 96.8 | 94.975129835472 | 1.82487016452801 |
| 5 | 114.1 | 113.647391431467 | 0.45260856853307 |
| 6 | 110.3 | 114.744346459308 | -4.44434645930778 |
| 7 | 103.9 | 107.732362261979 | -3.83236226197947 |
| 8 | 101.6 | 100.115488619314 | 1.48451138068626 |
| 9 | 94.6 | 98.1751532024511 | -3.57515320245115 |
| 10 | 95.9 | 100.216525088836 | -4.31652508883601 |
| 11 | 104.7 | 109.444387259559 | -4.74438725955913 |
| 12 | 102.8 | 98.2113668758878 | 4.58863312411224 |
| 13 | 98.1 | 97.3110129304108 | 0.788987069589157 |
| 14 | 113.9 | 107.887269941529 | 6.01273005847063 |
| 15 | 80.9 | 84.2973825499535 | -3.39738254995349 |
| 16 | 95.7 | 94.7952537530518 | 0.904746246948233 |
| 17 | 113.2 | 111.462887150971 | 1.73711284902876 |
| 18 | 105.9 | 108.620919023513 | -2.72091902351273 |
| 19 | 108.8 | 104.958360438084 | 3.84163956191573 |
| 20 | 102.3 | 97.127758160796 | 5.17224183920394 |
| 21 | 99 | 96.1865777877286 | 2.8134222122714 |
| 22 | 100.7 | 103.560548229060 | -2.86054822905963 |
| 23 | 115.5 | 111.648876841895 | 3.85112315810527 |
| 24 | 100.7 | 104.048722863794 | -3.34872286379412 |
| 25 | 109.9 | 104.851385721765 | 5.04861427823489 |
| 26 | 114.6 | 115.686243073855 | -1.08624307385528 |
| 27 | 85.4 | 87.4843078947599 | -2.08430789475992 |
| 28 | 100.5 | 103.075562720693 | -2.57556272069307 |
| 29 | 114.8 | 113.716475453778 | 1.08352454622203 |
| 30 | 116.5 | 112.714942973102 | 3.78505702689751 |
| 31 | 112.9 | 108.961775768324 | 3.93822423167648 |
| 32 | 102 | 101.939178500693 | 0.0608214993073078 |
| 33 | 106 | 104.589038980811 | 1.41096101918897 |
| 34 | 105.3 | 106.084174318372 | -0.784174318372481 |
| 35 | 118.8 | 113.755909581906 | 5.04409041809384 |
| 36 | 106.1 | 110.131809275148 | -4.03180927514797 |
| 37 | 109.3 | 108.785114365087 | 0.514885634912531 |
| 38 | 117.2 | 118.604687088328 | -1.40468708832829 |
| 39 | 92.5 | 89.50425739415 | 2.99574260585008 |
| 40 | 104.2 | 102.751703056574 | 1.44829694342579 |
| 41 | 112.5 | 116.8286255724 | -4.32862557240002 |
| 42 | 122.4 | 117.384155007245 | 5.01584499275535 |
| 43 | 113.3 | 109.693136849083 | 3.60686315091651 |
| 44 | 100 | 101.629633178982 | -1.62963317898212 |
| 45 | 110.7 | 107.259262948092 | 3.44073705190798 |
| 46 | 112.8 | 104.838752363732 | 7.96124763626811 |
| 47 | 109.8 | 113.95082631664 | -4.15082631663997 |
| 48 | 117.3 | 114.508100985170 | 2.79189901482985 |
| 49 | 109.1 | 110.260382926635 | -1.16038292663474 |
| 50 | 115.9 | 116.174737167518 | -0.274737167517643 |
| 51 | 96 | 95.949513146347 | 0.0504868536530736 |
| 52 | 99.8 | 101.402350634209 | -1.60235063420896 |
| 53 | 116.8 | 115.744620391384 | 1.05537960861616 |
| 54 | 115.7 | 117.335636536832 | -1.63563653683234 |
| 55 | 99.4 | 106.954364682529 | -7.55436468252923 |
| 56 | 94.3 | 99.3879415402154 | -5.08794154021538 |
| 57 | 91 | 95.0899670809172 | -4.0899670809172 |
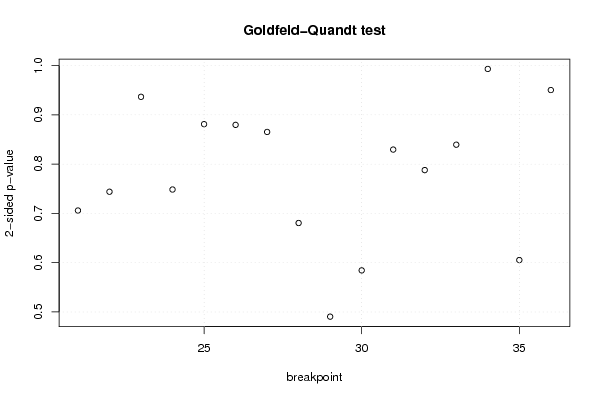
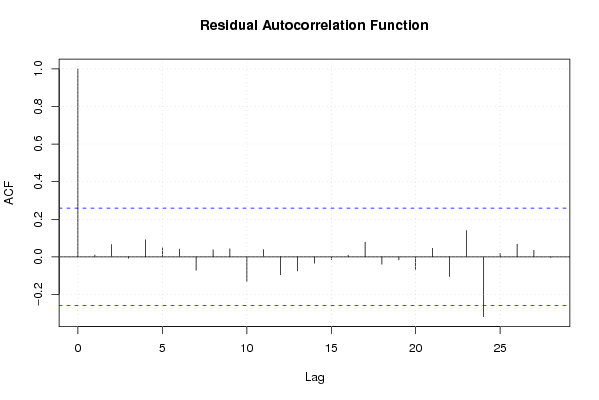
| Goldfeld-Quandt test for Heteroskedasticity | |||
| p-values | Alternative Hypothesis | ||
| breakpoint index | greater | 2-sided | less |
| 21 | 0.64706550254988 | 0.705868994900239 | 0.352934497450120 |
| 22 | 0.628010871146624 | 0.743978257706752 | 0.371989128853376 |
| 23 | 0.531717741698212 | 0.936564516603575 | 0.468282258301788 |
| 24 | 0.625776461342083 | 0.748447077315834 | 0.374223538657917 |
| 25 | 0.559425704967485 | 0.88114859006503 | 0.440574295032515 |
| 26 | 0.439845004034697 | 0.879690008069394 | 0.560154995965303 |
| 27 | 0.432664097214060 | 0.865328194428119 | 0.56733590278594 |
| 28 | 0.340267138540383 | 0.680534277080765 | 0.659732861459617 |
| 29 | 0.245235547546132 | 0.490471095092263 | 0.754764452453868 |
| 30 | 0.29218705964853 | 0.58437411929706 | 0.70781294035147 |
| 31 | 0.414777800044649 | 0.829555600089297 | 0.585222199955351 |
| 32 | 0.393943039723842 | 0.787886079447683 | 0.606056960276158 |
| 33 | 0.419715160409991 | 0.839430320819981 | 0.580284839590009 |
| 34 | 0.496584289689892 | 0.993168579379785 | 0.503415710310108 |
| 35 | 0.697338152570744 | 0.605323694858512 | 0.302661847429256 |
| 36 | 0.524833090136734 | 0.950333819726532 | 0.475166909863266 |
| Meta Analysis of Goldfeld-Quandt test for Heteroskedasticity | |||
| Description | # significant tests | % significant tests | OK/NOK |
| 1% type I error level | 0 | 0 | OK |
| 5% type I error level | 0 | 0 | OK |
| 10% type I error level | 0 | 0 | OK |