Free Statistics

of Irreproducible Research!

Author's title

Author*The author of this computation has been verified*
R Software Modulerwasp_multipleregression.wasp
Title produced by softwareMultiple Regression
Date of computationWed, 16 Dec 2009 08:04:25 -0700
Cite this page as followsStatistical Computations at FreeStatistics.org, Office for Research Development and Education, URL https://freestatistics.org/blog/index.php?v=date/2009/Dec/16/t12609764702h7sc6lvhuu5dfn.htm/, Retrieved Tue, 30 Apr 2024 16:53:31 +0000
Statistical Computations at FreeStatistics.org, Office for Research Development and Education, URL https://freestatistics.org/blog/index.php?pk=68414, Retrieved Tue, 30 Apr 2024 16:53:31 +0000
QR Codes:

Original text written by user:
IsPrivate?No (this computation is public)
User-defined keywords
Estimated Impact130
Family? (F = Feedback message, R = changed R code, M = changed R Module, P = changed Parameters, D = changed Data)
-     [Multiple Regression] [Q1 The Seatbeltlaw] [2007-11-14 19:27:43] [8cd6641b921d30ebe00b648d1481bba0]
- RM D  [Multiple Regression] [Seatbelt] [2009-11-12 14:10:54] [b98453cac15ba1066b407e146608df68]
- R  D    [Multiple Regression] [Model 4, kijken n...] [2009-12-16 14:57:17] [075a06058fde559dd021d126a2b15a40]
-    D        [Multiple Regression] [Model 4, kijken n...] [2009-12-16 15:04:25] [154177ed6b2613a730375f7d341441cf] [Current]
-    D          [Multiple Regression] [Model 5, kijken n...] [2009-12-16 15:21:57] [075a06058fde559dd021d126a2b15a40]
Feedback Forum

Post a new message
Dataseries X:
97.4	114	102.9	112.7	97	95.1
111.4	116	97.4	102.9	112.7	97
87.4	153	111.4	97.4	102.9	112.7
96.8	162	87.4	111.4	97.4	102.9
114.1	161	96.8	87.4	111.4	97.4
110.3	149	114.1	96.8	87.4	111.4
103.9	139	110.3	114.1	96.8	87.4
101.6	135	103.9	110.3	114.1	96.8
94.6	130	101.6	103.9	110.3	114.1
95.9	127	94.6	101.6	103.9	110.3
104.7	122	95.9	94.6	101.6	103.9
102.8	117	104.7	95.9	94.6	101.6
98.1	112	102.8	104.7	95.9	94.6
113.9	113	98.1	102.8	104.7	95.9
80.9	149	113.9	98.1	102.8	104.7
95.7	157	80.9	113.9	98.1	102.8
113.2	157	95.7	80.9	113.9	98.1
105.9	147	113.2	95.7	80.9	113.9
108.8	137	105.9	113.2	95.7	80.9
102.3	132	108.8	105.9	113.2	95.7
99	125	102.3	108.8	105.9	113.2
100.7	123	99	102.3	108.8	105.9
115.5	117	100.7	99	102.3	108.8
100.7	114	115.5	100.7	99	102.3
109.9	111	100.7	115.5	100.7	99
114.6	112	109.9	100.7	115.5	100.7
85.4	144	114.6	109.9	100.7	115.5
100.5	150	85.4	114.6	109.9	100.7
114.8	149	100.5	85.4	114.6	109.9
116.5	134	114.8	100.5	85.4	114.6
112.9	123	116.5	114.8	100.5	85.4
102	116	112.9	116.5	114.8	100.5
106	117	102	112.9	116.5	114.8
105.3	111	106	102	112.9	116.5
118.8	105	105.3	106	102	112.9
106.1	102	118.8	105.3	106	102
109.3	95	106.1	118.8	105.3	106
117.2	93	109.3	106.1	118.8	105.3
92.5	124	117.2	109.3	106.1	118.8
104.2	130	92.5	117.2	109.3	106.1
112.5	124	104.2	92.5	117.2	109.3
122.4	115	112.5	104.2	92.5	117.2
113.3	106	122.4	112.5	104.2	92.5
100	105	113.3	122.4	112.5	104.2
110.7	105	100	113.3	122.4	112.5
112.8	101	110.7	100	113.3	122.4
109.8	95	112.8	110.7	100	113.3
117.3	93	109.8	112.8	110.7	100
109.1	84	117.3	109.8	112.8	110.7
115.9	87	109.1	117.3	109.8	112.8
96	116	115.9	109.1	117.3	109.8
99.8	120	96	115.9	109.1	117.3
116.8	117	99.8	96	115.9	109.1
115.7	109	116.8	99.8	96	115.9
99.4	105	115.7	116.8	99.8	96
94.3	107	99.4	115.7	116.8	99.8
91	109	94.3	99.4	115.7	116.8


Summary of computational transaction
Raw Inputview raw input (R code)
Raw Outputview raw output of R engine
Computing time4 seconds
R Server'Gwilym Jenkins' @ 72.249.127.135

\begin{tabular}{lllllllll}
\hline
Summary of computational transaction \tabularnewline
Raw Input & view raw input (R code)  \tabularnewline
Raw Output & view raw output of R engine  \tabularnewline
Computing time & 4 seconds \tabularnewline
R Server & 'Gwilym Jenkins' @ 72.249.127.135 \tabularnewline
\hline
\end{tabular}
%Source: https://freestatistics.org/blog/index.php?pk=68414&T=0

[TABLE]
[ROW][C]Summary of computational transaction[/C][/ROW]
[ROW][C]Raw Input[/C][C]view raw input (R code) [/C][/ROW]
[ROW][C]Raw Output[/C][C]view raw output of R engine [/C][/ROW]
[ROW][C]Computing time[/C][C]4 seconds[/C][/ROW]
[ROW][C]R Server[/C][C]'Gwilym Jenkins' @ 72.249.127.135[/C][/ROW]
[/TABLE]
Source: https://freestatistics.org/blog/index.php?pk=68414&T=0

Globally Unique Identifier (entire table): ba.freestatistics.org/blog/index.php?pk=68414&T=0

As an alternative you can also use a QR Code:  

The GUIDs for individual cells are displayed in the table below:

Summary of computational transaction
Raw Inputview raw input (R code)
Raw Outputview raw output of R engine
Computing time4 seconds
R Server'Gwilym Jenkins' @ 72.249.127.135


Multiple Linear Regression - Estimated Regression Equation
Y[t] = -38.0009327756717 + 0.0702381579760955X[t] + 0.121123120132540Y1[t] + 0.452742857897186Y2[t] + 0.733822466637121Y3[t] + 0.0310925954506842Y4[t] -4.98250336335315M1[t] + 0.511931555884507M2[t] -24.2147514902035M3[t] -13.8700341648047M4[t] + 4.55421564347214M5[t] + 17.3762426394411M6[t] -2.40026840685621M7[t] -20.1709936068584M8[t] -16.2763932431094M9[t] -7.26353676755452M10[t] + 7.27102447826702M11[t] -0.056984051960174t + e[t]

\begin{tabular}{lllllllll}
\hline
Multiple Linear Regression - Estimated Regression Equation \tabularnewline
Y[t] =  -38.0009327756717 +  0.0702381579760955X[t] +  0.121123120132540Y1[t] +  0.452742857897186Y2[t] +  0.733822466637121Y3[t] +  0.0310925954506842Y4[t] -4.98250336335315M1[t] +  0.511931555884507M2[t] -24.2147514902035M3[t] -13.8700341648047M4[t] +  4.55421564347214M5[t] +  17.3762426394411M6[t] -2.40026840685621M7[t] -20.1709936068584M8[t] -16.2763932431094M9[t] -7.26353676755452M10[t] +  7.27102447826702M11[t] -0.056984051960174t  + e[t] \tabularnewline
\hline
\end{tabular}
%Source: https://freestatistics.org/blog/index.php?pk=68414&T=1

[TABLE]
[ROW][C]Multiple Linear Regression - Estimated Regression Equation[/C][/ROW]
[ROW][C]Y[t] =  -38.0009327756717 +  0.0702381579760955X[t] +  0.121123120132540Y1[t] +  0.452742857897186Y2[t] +  0.733822466637121Y3[t] +  0.0310925954506842Y4[t] -4.98250336335315M1[t] +  0.511931555884507M2[t] -24.2147514902035M3[t] -13.8700341648047M4[t] +  4.55421564347214M5[t] +  17.3762426394411M6[t] -2.40026840685621M7[t] -20.1709936068584M8[t] -16.2763932431094M9[t] -7.26353676755452M10[t] +  7.27102447826702M11[t] -0.056984051960174t  + e[t][/C][/ROW]
[/TABLE]
Source: https://freestatistics.org/blog/index.php?pk=68414&T=1

Globally Unique Identifier (entire table): ba.freestatistics.org/blog/index.php?pk=68414&T=1

As an alternative you can also use a QR Code:  

The GUIDs for individual cells are displayed in the table below:

Multiple Linear Regression - Estimated Regression Equation
Y[t] = -38.0009327756717 + 0.0702381579760955X[t] + 0.121123120132540Y1[t] + 0.452742857897186Y2[t] + 0.733822466637121Y3[t] + 0.0310925954506842Y4[t] -4.98250336335315M1[t] + 0.511931555884507M2[t] -24.2147514902035M3[t] -13.8700341648047M4[t] + 4.55421564347214M5[t] + 17.3762426394411M6[t] -2.40026840685621M7[t] -20.1709936068584M8[t] -16.2763932431094M9[t] -7.26353676755452M10[t] + 7.27102447826702M11[t] -0.056984051960174t + e[t]


Multiple Linear Regression - Ordinary Least Squares
VariableParameterS.D.T-STATH0: parameter = 02-tail p-value1-tail p-value
(Intercept)-38.000932775671747.006737-0.80840.4237560.211878
X0.07023815797609550.1471250.47740.6357390.317869
Y10.1211231201325400.1644510.73650.4658150.232908
Y20.4527428578971860.1544362.93160.0056160.002808
Y30.7338224666371210.1853073.960.0003090.000154
Y40.03109259545068420.2056630.15120.8806110.440306
M1-4.982503363353153.398698-1.4660.1506640.075332
M20.5119315558845073.9165730.13070.8966770.448339
M3-24.21475149020356.27432-3.85930.0004160.000208
M4-13.87003416480478.073987-1.71790.0937520.046876
M54.554215643472146.9801020.65250.5179340.258967
M617.37624263944115.2586013.30430.0020480.001024
M7-2.400268406856214.933543-0.48650.6293210.314661
M8-20.17099360685844.983499-4.04760.0002370.000119
M9-16.27639324310946.51345-2.49890.0167790.008389
M10-7.263536767554525.493703-1.32220.1938180.096909
M117.271024478267024.0065081.81480.0772510.038625
t-0.0569840519601740.107224-0.53140.5981230.299062

\begin{tabular}{lllllllll}
\hline
Multiple Linear Regression - Ordinary Least Squares \tabularnewline
Variable & Parameter & S.D. & T-STATH0: parameter = 0 & 2-tail p-value & 1-tail p-value \tabularnewline
(Intercept) & -38.0009327756717 & 47.006737 & -0.8084 & 0.423756 & 0.211878 \tabularnewline
X & 0.0702381579760955 & 0.147125 & 0.4774 & 0.635739 & 0.317869 \tabularnewline
Y1 & 0.121123120132540 & 0.164451 & 0.7365 & 0.465815 & 0.232908 \tabularnewline
Y2 & 0.452742857897186 & 0.154436 & 2.9316 & 0.005616 & 0.002808 \tabularnewline
Y3 & 0.733822466637121 & 0.185307 & 3.96 & 0.000309 & 0.000154 \tabularnewline
Y4 & 0.0310925954506842 & 0.205663 & 0.1512 & 0.880611 & 0.440306 \tabularnewline
M1 & -4.98250336335315 & 3.398698 & -1.466 & 0.150664 & 0.075332 \tabularnewline
M2 & 0.511931555884507 & 3.916573 & 0.1307 & 0.896677 & 0.448339 \tabularnewline
M3 & -24.2147514902035 & 6.27432 & -3.8593 & 0.000416 & 0.000208 \tabularnewline
M4 & -13.8700341648047 & 8.073987 & -1.7179 & 0.093752 & 0.046876 \tabularnewline
M5 & 4.55421564347214 & 6.980102 & 0.6525 & 0.517934 & 0.258967 \tabularnewline
M6 & 17.3762426394411 & 5.258601 & 3.3043 & 0.002048 & 0.001024 \tabularnewline
M7 & -2.40026840685621 & 4.933543 & -0.4865 & 0.629321 & 0.314661 \tabularnewline
M8 & -20.1709936068584 & 4.983499 & -4.0476 & 0.000237 & 0.000119 \tabularnewline
M9 & -16.2763932431094 & 6.51345 & -2.4989 & 0.016779 & 0.008389 \tabularnewline
M10 & -7.26353676755452 & 5.493703 & -1.3222 & 0.193818 & 0.096909 \tabularnewline
M11 & 7.27102447826702 & 4.006508 & 1.8148 & 0.077251 & 0.038625 \tabularnewline
t & -0.056984051960174 & 0.107224 & -0.5314 & 0.598123 & 0.299062 \tabularnewline
\hline
\end{tabular}
%Source: https://freestatistics.org/blog/index.php?pk=68414&T=2

[TABLE]
[ROW][C]Multiple Linear Regression - Ordinary Least Squares[/C][/ROW]
[ROW][C]Variable[/C][C]Parameter[/C][C]S.D.[/C][C]T-STATH0: parameter = 0[/C][C]2-tail p-value[/C][C]1-tail p-value[/C][/ROW]
[ROW][C](Intercept)[/C][C]-38.0009327756717[/C][C]47.006737[/C][C]-0.8084[/C][C]0.423756[/C][C]0.211878[/C][/ROW]
[ROW][C]X[/C][C]0.0702381579760955[/C][C]0.147125[/C][C]0.4774[/C][C]0.635739[/C][C]0.317869[/C][/ROW]
[ROW][C]Y1[/C][C]0.121123120132540[/C][C]0.164451[/C][C]0.7365[/C][C]0.465815[/C][C]0.232908[/C][/ROW]
[ROW][C]Y2[/C][C]0.452742857897186[/C][C]0.154436[/C][C]2.9316[/C][C]0.005616[/C][C]0.002808[/C][/ROW]
[ROW][C]Y3[/C][C]0.733822466637121[/C][C]0.185307[/C][C]3.96[/C][C]0.000309[/C][C]0.000154[/C][/ROW]
[ROW][C]Y4[/C][C]0.0310925954506842[/C][C]0.205663[/C][C]0.1512[/C][C]0.880611[/C][C]0.440306[/C][/ROW]
[ROW][C]M1[/C][C]-4.98250336335315[/C][C]3.398698[/C][C]-1.466[/C][C]0.150664[/C][C]0.075332[/C][/ROW]
[ROW][C]M2[/C][C]0.511931555884507[/C][C]3.916573[/C][C]0.1307[/C][C]0.896677[/C][C]0.448339[/C][/ROW]
[ROW][C]M3[/C][C]-24.2147514902035[/C][C]6.27432[/C][C]-3.8593[/C][C]0.000416[/C][C]0.000208[/C][/ROW]
[ROW][C]M4[/C][C]-13.8700341648047[/C][C]8.073987[/C][C]-1.7179[/C][C]0.093752[/C][C]0.046876[/C][/ROW]
[ROW][C]M5[/C][C]4.55421564347214[/C][C]6.980102[/C][C]0.6525[/C][C]0.517934[/C][C]0.258967[/C][/ROW]
[ROW][C]M6[/C][C]17.3762426394411[/C][C]5.258601[/C][C]3.3043[/C][C]0.002048[/C][C]0.001024[/C][/ROW]
[ROW][C]M7[/C][C]-2.40026840685621[/C][C]4.933543[/C][C]-0.4865[/C][C]0.629321[/C][C]0.314661[/C][/ROW]
[ROW][C]M8[/C][C]-20.1709936068584[/C][C]4.983499[/C][C]-4.0476[/C][C]0.000237[/C][C]0.000119[/C][/ROW]
[ROW][C]M9[/C][C]-16.2763932431094[/C][C]6.51345[/C][C]-2.4989[/C][C]0.016779[/C][C]0.008389[/C][/ROW]
[ROW][C]M10[/C][C]-7.26353676755452[/C][C]5.493703[/C][C]-1.3222[/C][C]0.193818[/C][C]0.096909[/C][/ROW]
[ROW][C]M11[/C][C]7.27102447826702[/C][C]4.006508[/C][C]1.8148[/C][C]0.077251[/C][C]0.038625[/C][/ROW]
[ROW][C]t[/C][C]-0.056984051960174[/C][C]0.107224[/C][C]-0.5314[/C][C]0.598123[/C][C]0.299062[/C][/ROW]
[/TABLE]
Source: https://freestatistics.org/blog/index.php?pk=68414&T=2

Globally Unique Identifier (entire table): ba.freestatistics.org/blog/index.php?pk=68414&T=2

As an alternative you can also use a QR Code:  

The GUIDs for individual cells are displayed in the table below:

Multiple Linear Regression - Ordinary Least Squares
VariableParameterS.D.T-STATH0: parameter = 02-tail p-value1-tail p-value
(Intercept)-38.000932775671747.006737-0.80840.4237560.211878
X0.07023815797609550.1471250.47740.6357390.317869
Y10.1211231201325400.1644510.73650.4658150.232908
Y20.4527428578971860.1544362.93160.0056160.002808
Y30.7338224666371210.1853073.960.0003090.000154
Y40.03109259545068420.2056630.15120.8806110.440306
M1-4.982503363353153.398698-1.4660.1506640.075332
M20.5119315558845073.9165730.13070.8966770.448339
M3-24.21475149020356.27432-3.85930.0004160.000208
M4-13.87003416480478.073987-1.71790.0937520.046876
M54.554215643472146.9801020.65250.5179340.258967
M617.37624263944115.2586013.30430.0020480.001024
M7-2.400268406856214.933543-0.48650.6293210.314661
M8-20.17099360685844.983499-4.04760.0002370.000119
M9-16.27639324310946.51345-2.49890.0167790.008389
M10-7.263536767554525.493703-1.32220.1938180.096909
M117.271024478267024.0065081.81480.0772510.038625
t-0.0569840519601740.107224-0.53140.5981230.299062


Multiple Linear Regression - Regression Statistics
Multiple R0.92390862741869
R-squared0.853607151818689
Adjusted R-squared0.789794884662732
F-TEST (value)13.3768504060902
F-TEST (DF numerator)17
F-TEST (DF denominator)39
p-value2.49332776647293e-11
Multiple Linear Regression - Residual Statistics
Residual Standard Deviation4.22248137423918
Sum Squared Residuals695.344609276074

\begin{tabular}{lllllllll}
\hline
Multiple Linear Regression - Regression Statistics \tabularnewline
Multiple R & 0.92390862741869 \tabularnewline
R-squared & 0.853607151818689 \tabularnewline
Adjusted R-squared & 0.789794884662732 \tabularnewline
F-TEST (value) & 13.3768504060902 \tabularnewline
F-TEST (DF numerator) & 17 \tabularnewline
F-TEST (DF denominator) & 39 \tabularnewline
p-value & 2.49332776647293e-11 \tabularnewline
Multiple Linear Regression - Residual Statistics \tabularnewline
Residual Standard Deviation & 4.22248137423918 \tabularnewline
Sum Squared Residuals & 695.344609276074 \tabularnewline
\hline
\end{tabular}
%Source: https://freestatistics.org/blog/index.php?pk=68414&T=3

[TABLE]
[ROW][C]Multiple Linear Regression - Regression Statistics[/C][/ROW]
[ROW][C]Multiple R[/C][C]0.92390862741869[/C][/ROW]
[ROW][C]R-squared[/C][C]0.853607151818689[/C][/ROW]
[ROW][C]Adjusted R-squared[/C][C]0.789794884662732[/C][/ROW]
[ROW][C]F-TEST (value)[/C][C]13.3768504060902[/C][/ROW]
[ROW][C]F-TEST (DF numerator)[/C][C]17[/C][/ROW]
[ROW][C]F-TEST (DF denominator)[/C][C]39[/C][/ROW]
[ROW][C]p-value[/C][C]2.49332776647293e-11[/C][/ROW]
[ROW][C]Multiple Linear Regression - Residual Statistics[/C][/ROW]
[ROW][C]Residual Standard Deviation[/C][C]4.22248137423918[/C][/ROW]
[ROW][C]Sum Squared Residuals[/C][C]695.344609276074[/C][/ROW]
[/TABLE]
Source: https://freestatistics.org/blog/index.php?pk=68414&T=3

Globally Unique Identifier (entire table): ba.freestatistics.org/blog/index.php?pk=68414&T=3

As an alternative you can also use a QR Code:  

The GUIDs for individual cells are displayed in the table below:

Multiple Linear Regression - Regression Statistics
Multiple R0.92390862741869
R-squared0.853607151818689
Adjusted R-squared0.789794884662732
F-TEST (value)13.3768504060902
F-TEST (DF numerator)17
F-TEST (DF denominator)39
p-value2.49332776647293e-11
Multiple Linear Regression - Residual Statistics
Residual Standard Deviation4.22248137423918
Sum Squared Residuals695.344609276074


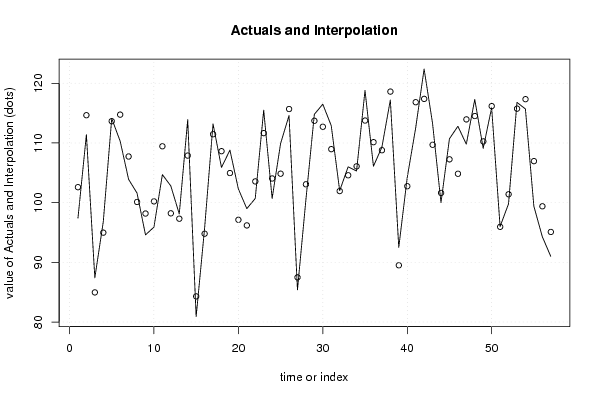
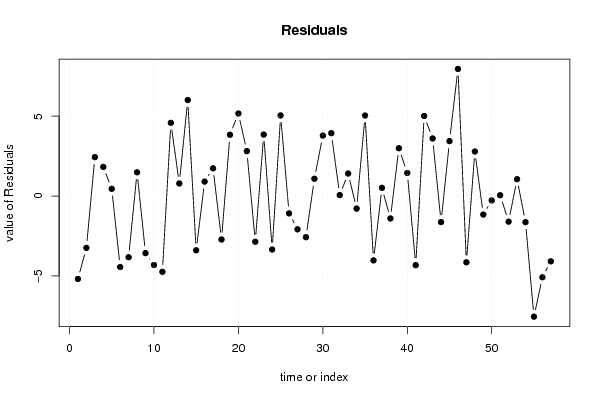
Multiple Linear Regression - Actuals, Interpolation, and Residuals
Time or IndexActualsInterpolationForecastResidualsPrediction Error
197.4102.592104056102-5.19210405610183
2111.4114.647062728769-3.24706272876941
387.484.96453901478982.43546098521025
496.894.9751298354721.82487016452801
5114.1113.6473914314670.45260856853307
6110.3114.744346459308-4.44434645930778
7103.9107.732362261979-3.83236226197947
8101.6100.1154886193141.48451138068626
994.698.1751532024511-3.57515320245115
1095.9100.216525088836-4.31652508883601
11104.7109.444387259559-4.74438725955913
12102.898.21136687588784.58863312411224
1398.197.31101293041080.788987069589157
14113.9107.8872699415296.01273005847063
1580.984.2973825499535-3.39738254995349
1695.794.79525375305180.904746246948233
17113.2111.4628871509711.73711284902876
18105.9108.620919023513-2.72091902351273
19108.8104.9583604380843.84163956191573
20102.397.1277581607965.17224183920394
219996.18657778772862.8134222122714
22100.7103.560548229060-2.86054822905963
23115.5111.6488768418953.85112315810527
24100.7104.048722863794-3.34872286379412
25109.9104.8513857217655.04861427823489
26114.6115.686243073855-1.08624307385528
2785.487.4843078947599-2.08430789475992
28100.5103.075562720693-2.57556272069307
29114.8113.7164754537781.08352454622203
30116.5112.7149429731023.78505702689751
31112.9108.9617757683243.93822423167648
32102101.9391785006930.0608214993073078
33106104.5890389808111.41096101918897
34105.3106.084174318372-0.784174318372481
35118.8113.7559095819065.04409041809384
36106.1110.131809275148-4.03180927514797
37109.3108.7851143650870.514885634912531
38117.2118.604687088328-1.40468708832829
3992.589.504257394152.99574260585008
40104.2102.7517030565741.44829694342579
41112.5116.8286255724-4.32862557240002
42122.4117.3841550072455.01584499275535
43113.3109.6931368490833.60686315091651
44100101.629633178982-1.62963317898212
45110.7107.2592629480923.44073705190798
46112.8104.8387523637327.96124763626811
47109.8113.95082631664-4.15082631663997
48117.3114.5081009851702.79189901482985
49109.1110.260382926635-1.16038292663474
50115.9116.174737167518-0.274737167517643
519695.9495131463470.0504868536530736
5299.8101.402350634209-1.60235063420896
53116.8115.7446203913841.05537960861616
54115.7117.335636536832-1.63563653683234
5599.4106.954364682529-7.55436468252923
5694.399.3879415402154-5.08794154021538
579195.0899670809172-4.0899670809172

\begin{tabular}{lllllllll}
\hline
Multiple Linear Regression - Actuals, Interpolation, and Residuals \tabularnewline
Time or Index & Actuals & InterpolationForecast & ResidualsPrediction Error \tabularnewline
1 & 97.4 & 102.592104056102 & -5.19210405610183 \tabularnewline
2 & 111.4 & 114.647062728769 & -3.24706272876941 \tabularnewline
3 & 87.4 & 84.9645390147898 & 2.43546098521025 \tabularnewline
4 & 96.8 & 94.975129835472 & 1.82487016452801 \tabularnewline
5 & 114.1 & 113.647391431467 & 0.45260856853307 \tabularnewline
6 & 110.3 & 114.744346459308 & -4.44434645930778 \tabularnewline
7 & 103.9 & 107.732362261979 & -3.83236226197947 \tabularnewline
8 & 101.6 & 100.115488619314 & 1.48451138068626 \tabularnewline
9 & 94.6 & 98.1751532024511 & -3.57515320245115 \tabularnewline
10 & 95.9 & 100.216525088836 & -4.31652508883601 \tabularnewline
11 & 104.7 & 109.444387259559 & -4.74438725955913 \tabularnewline
12 & 102.8 & 98.2113668758878 & 4.58863312411224 \tabularnewline
13 & 98.1 & 97.3110129304108 & 0.788987069589157 \tabularnewline
14 & 113.9 & 107.887269941529 & 6.01273005847063 \tabularnewline
15 & 80.9 & 84.2973825499535 & -3.39738254995349 \tabularnewline
16 & 95.7 & 94.7952537530518 & 0.904746246948233 \tabularnewline
17 & 113.2 & 111.462887150971 & 1.73711284902876 \tabularnewline
18 & 105.9 & 108.620919023513 & -2.72091902351273 \tabularnewline
19 & 108.8 & 104.958360438084 & 3.84163956191573 \tabularnewline
20 & 102.3 & 97.127758160796 & 5.17224183920394 \tabularnewline
21 & 99 & 96.1865777877286 & 2.8134222122714 \tabularnewline
22 & 100.7 & 103.560548229060 & -2.86054822905963 \tabularnewline
23 & 115.5 & 111.648876841895 & 3.85112315810527 \tabularnewline
24 & 100.7 & 104.048722863794 & -3.34872286379412 \tabularnewline
25 & 109.9 & 104.851385721765 & 5.04861427823489 \tabularnewline
26 & 114.6 & 115.686243073855 & -1.08624307385528 \tabularnewline
27 & 85.4 & 87.4843078947599 & -2.08430789475992 \tabularnewline
28 & 100.5 & 103.075562720693 & -2.57556272069307 \tabularnewline
29 & 114.8 & 113.716475453778 & 1.08352454622203 \tabularnewline
30 & 116.5 & 112.714942973102 & 3.78505702689751 \tabularnewline
31 & 112.9 & 108.961775768324 & 3.93822423167648 \tabularnewline
32 & 102 & 101.939178500693 & 0.0608214993073078 \tabularnewline
33 & 106 & 104.589038980811 & 1.41096101918897 \tabularnewline
34 & 105.3 & 106.084174318372 & -0.784174318372481 \tabularnewline
35 & 118.8 & 113.755909581906 & 5.04409041809384 \tabularnewline
36 & 106.1 & 110.131809275148 & -4.03180927514797 \tabularnewline
37 & 109.3 & 108.785114365087 & 0.514885634912531 \tabularnewline
38 & 117.2 & 118.604687088328 & -1.40468708832829 \tabularnewline
39 & 92.5 & 89.50425739415 & 2.99574260585008 \tabularnewline
40 & 104.2 & 102.751703056574 & 1.44829694342579 \tabularnewline
41 & 112.5 & 116.8286255724 & -4.32862557240002 \tabularnewline
42 & 122.4 & 117.384155007245 & 5.01584499275535 \tabularnewline
43 & 113.3 & 109.693136849083 & 3.60686315091651 \tabularnewline
44 & 100 & 101.629633178982 & -1.62963317898212 \tabularnewline
45 & 110.7 & 107.259262948092 & 3.44073705190798 \tabularnewline
46 & 112.8 & 104.838752363732 & 7.96124763626811 \tabularnewline
47 & 109.8 & 113.95082631664 & -4.15082631663997 \tabularnewline
48 & 117.3 & 114.508100985170 & 2.79189901482985 \tabularnewline
49 & 109.1 & 110.260382926635 & -1.16038292663474 \tabularnewline
50 & 115.9 & 116.174737167518 & -0.274737167517643 \tabularnewline
51 & 96 & 95.949513146347 & 0.0504868536530736 \tabularnewline
52 & 99.8 & 101.402350634209 & -1.60235063420896 \tabularnewline
53 & 116.8 & 115.744620391384 & 1.05537960861616 \tabularnewline
54 & 115.7 & 117.335636536832 & -1.63563653683234 \tabularnewline
55 & 99.4 & 106.954364682529 & -7.55436468252923 \tabularnewline
56 & 94.3 & 99.3879415402154 & -5.08794154021538 \tabularnewline
57 & 91 & 95.0899670809172 & -4.0899670809172 \tabularnewline
\hline
\end{tabular}
%Source: https://freestatistics.org/blog/index.php?pk=68414&T=4

[TABLE]
[ROW][C]Multiple Linear Regression - Actuals, Interpolation, and Residuals[/C][/ROW]
[ROW][C]Time or Index[/C][C]Actuals[/C][C]InterpolationForecast[/C][C]ResidualsPrediction Error[/C][/ROW]
[ROW][C]1[/C][C]97.4[/C][C]102.592104056102[/C][C]-5.19210405610183[/C][/ROW]
[ROW][C]2[/C][C]111.4[/C][C]114.647062728769[/C][C]-3.24706272876941[/C][/ROW]
[ROW][C]3[/C][C]87.4[/C][C]84.9645390147898[/C][C]2.43546098521025[/C][/ROW]
[ROW][C]4[/C][C]96.8[/C][C]94.975129835472[/C][C]1.82487016452801[/C][/ROW]
[ROW][C]5[/C][C]114.1[/C][C]113.647391431467[/C][C]0.45260856853307[/C][/ROW]
[ROW][C]6[/C][C]110.3[/C][C]114.744346459308[/C][C]-4.44434645930778[/C][/ROW]
[ROW][C]7[/C][C]103.9[/C][C]107.732362261979[/C][C]-3.83236226197947[/C][/ROW]
[ROW][C]8[/C][C]101.6[/C][C]100.115488619314[/C][C]1.48451138068626[/C][/ROW]
[ROW][C]9[/C][C]94.6[/C][C]98.1751532024511[/C][C]-3.57515320245115[/C][/ROW]
[ROW][C]10[/C][C]95.9[/C][C]100.216525088836[/C][C]-4.31652508883601[/C][/ROW]
[ROW][C]11[/C][C]104.7[/C][C]109.444387259559[/C][C]-4.74438725955913[/C][/ROW]
[ROW][C]12[/C][C]102.8[/C][C]98.2113668758878[/C][C]4.58863312411224[/C][/ROW]
[ROW][C]13[/C][C]98.1[/C][C]97.3110129304108[/C][C]0.788987069589157[/C][/ROW]
[ROW][C]14[/C][C]113.9[/C][C]107.887269941529[/C][C]6.01273005847063[/C][/ROW]
[ROW][C]15[/C][C]80.9[/C][C]84.2973825499535[/C][C]-3.39738254995349[/C][/ROW]
[ROW][C]16[/C][C]95.7[/C][C]94.7952537530518[/C][C]0.904746246948233[/C][/ROW]
[ROW][C]17[/C][C]113.2[/C][C]111.462887150971[/C][C]1.73711284902876[/C][/ROW]
[ROW][C]18[/C][C]105.9[/C][C]108.620919023513[/C][C]-2.72091902351273[/C][/ROW]
[ROW][C]19[/C][C]108.8[/C][C]104.958360438084[/C][C]3.84163956191573[/C][/ROW]
[ROW][C]20[/C][C]102.3[/C][C]97.127758160796[/C][C]5.17224183920394[/C][/ROW]
[ROW][C]21[/C][C]99[/C][C]96.1865777877286[/C][C]2.8134222122714[/C][/ROW]
[ROW][C]22[/C][C]100.7[/C][C]103.560548229060[/C][C]-2.86054822905963[/C][/ROW]
[ROW][C]23[/C][C]115.5[/C][C]111.648876841895[/C][C]3.85112315810527[/C][/ROW]
[ROW][C]24[/C][C]100.7[/C][C]104.048722863794[/C][C]-3.34872286379412[/C][/ROW]
[ROW][C]25[/C][C]109.9[/C][C]104.851385721765[/C][C]5.04861427823489[/C][/ROW]
[ROW][C]26[/C][C]114.6[/C][C]115.686243073855[/C][C]-1.08624307385528[/C][/ROW]
[ROW][C]27[/C][C]85.4[/C][C]87.4843078947599[/C][C]-2.08430789475992[/C][/ROW]
[ROW][C]28[/C][C]100.5[/C][C]103.075562720693[/C][C]-2.57556272069307[/C][/ROW]
[ROW][C]29[/C][C]114.8[/C][C]113.716475453778[/C][C]1.08352454622203[/C][/ROW]
[ROW][C]30[/C][C]116.5[/C][C]112.714942973102[/C][C]3.78505702689751[/C][/ROW]
[ROW][C]31[/C][C]112.9[/C][C]108.961775768324[/C][C]3.93822423167648[/C][/ROW]
[ROW][C]32[/C][C]102[/C][C]101.939178500693[/C][C]0.0608214993073078[/C][/ROW]
[ROW][C]33[/C][C]106[/C][C]104.589038980811[/C][C]1.41096101918897[/C][/ROW]
[ROW][C]34[/C][C]105.3[/C][C]106.084174318372[/C][C]-0.784174318372481[/C][/ROW]
[ROW][C]35[/C][C]118.8[/C][C]113.755909581906[/C][C]5.04409041809384[/C][/ROW]
[ROW][C]36[/C][C]106.1[/C][C]110.131809275148[/C][C]-4.03180927514797[/C][/ROW]
[ROW][C]37[/C][C]109.3[/C][C]108.785114365087[/C][C]0.514885634912531[/C][/ROW]
[ROW][C]38[/C][C]117.2[/C][C]118.604687088328[/C][C]-1.40468708832829[/C][/ROW]
[ROW][C]39[/C][C]92.5[/C][C]89.50425739415[/C][C]2.99574260585008[/C][/ROW]
[ROW][C]40[/C][C]104.2[/C][C]102.751703056574[/C][C]1.44829694342579[/C][/ROW]
[ROW][C]41[/C][C]112.5[/C][C]116.8286255724[/C][C]-4.32862557240002[/C][/ROW]
[ROW][C]42[/C][C]122.4[/C][C]117.384155007245[/C][C]5.01584499275535[/C][/ROW]
[ROW][C]43[/C][C]113.3[/C][C]109.693136849083[/C][C]3.60686315091651[/C][/ROW]
[ROW][C]44[/C][C]100[/C][C]101.629633178982[/C][C]-1.62963317898212[/C][/ROW]
[ROW][C]45[/C][C]110.7[/C][C]107.259262948092[/C][C]3.44073705190798[/C][/ROW]
[ROW][C]46[/C][C]112.8[/C][C]104.838752363732[/C][C]7.96124763626811[/C][/ROW]
[ROW][C]47[/C][C]109.8[/C][C]113.95082631664[/C][C]-4.15082631663997[/C][/ROW]
[ROW][C]48[/C][C]117.3[/C][C]114.508100985170[/C][C]2.79189901482985[/C][/ROW]
[ROW][C]49[/C][C]109.1[/C][C]110.260382926635[/C][C]-1.16038292663474[/C][/ROW]
[ROW][C]50[/C][C]115.9[/C][C]116.174737167518[/C][C]-0.274737167517643[/C][/ROW]
[ROW][C]51[/C][C]96[/C][C]95.949513146347[/C][C]0.0504868536530736[/C][/ROW]
[ROW][C]52[/C][C]99.8[/C][C]101.402350634209[/C][C]-1.60235063420896[/C][/ROW]
[ROW][C]53[/C][C]116.8[/C][C]115.744620391384[/C][C]1.05537960861616[/C][/ROW]
[ROW][C]54[/C][C]115.7[/C][C]117.335636536832[/C][C]-1.63563653683234[/C][/ROW]
[ROW][C]55[/C][C]99.4[/C][C]106.954364682529[/C][C]-7.55436468252923[/C][/ROW]
[ROW][C]56[/C][C]94.3[/C][C]99.3879415402154[/C][C]-5.08794154021538[/C][/ROW]
[ROW][C]57[/C][C]91[/C][C]95.0899670809172[/C][C]-4.0899670809172[/C][/ROW]
[/TABLE]
Source: https://freestatistics.org/blog/index.php?pk=68414&T=4

Globally Unique Identifier (entire table): ba.freestatistics.org/blog/index.php?pk=68414&T=4

As an alternative you can also use a QR Code:  

The GUIDs for individual cells are displayed in the table below:

Multiple Linear Regression - Actuals, Interpolation, and Residuals
Time or IndexActualsInterpolationForecastResidualsPrediction Error
197.4102.592104056102-5.19210405610183
2111.4114.647062728769-3.24706272876941
387.484.96453901478982.43546098521025
496.894.9751298354721.82487016452801
5114.1113.6473914314670.45260856853307
6110.3114.744346459308-4.44434645930778
7103.9107.732362261979-3.83236226197947
8101.6100.1154886193141.48451138068626
994.698.1751532024511-3.57515320245115
1095.9100.216525088836-4.31652508883601
11104.7109.444387259559-4.74438725955913
12102.898.21136687588784.58863312411224
1398.197.31101293041080.788987069589157
14113.9107.8872699415296.01273005847063
1580.984.2973825499535-3.39738254995349
1695.794.79525375305180.904746246948233
17113.2111.4628871509711.73711284902876
18105.9108.620919023513-2.72091902351273
19108.8104.9583604380843.84163956191573
20102.397.1277581607965.17224183920394
219996.18657778772862.8134222122714
22100.7103.560548229060-2.86054822905963
23115.5111.6488768418953.85112315810527
24100.7104.048722863794-3.34872286379412
25109.9104.8513857217655.04861427823489
26114.6115.686243073855-1.08624307385528
2785.487.4843078947599-2.08430789475992
28100.5103.075562720693-2.57556272069307
29114.8113.7164754537781.08352454622203
30116.5112.7149429731023.78505702689751
31112.9108.9617757683243.93822423167648
32102101.9391785006930.0608214993073078
33106104.5890389808111.41096101918897
34105.3106.084174318372-0.784174318372481
35118.8113.7559095819065.04409041809384
36106.1110.131809275148-4.03180927514797
37109.3108.7851143650870.514885634912531
38117.2118.604687088328-1.40468708832829
3992.589.504257394152.99574260585008
40104.2102.7517030565741.44829694342579
41112.5116.8286255724-4.32862557240002
42122.4117.3841550072455.01584499275535
43113.3109.6931368490833.60686315091651
44100101.629633178982-1.62963317898212
45110.7107.2592629480923.44073705190798
46112.8104.8387523637327.96124763626811
47109.8113.95082631664-4.15082631663997
48117.3114.5081009851702.79189901482985
49109.1110.260382926635-1.16038292663474
50115.9116.174737167518-0.274737167517643
519695.9495131463470.0504868536530736
5299.8101.402350634209-1.60235063420896
53116.8115.7446203913841.05537960861616
54115.7117.335636536832-1.63563653683234
5599.4106.954364682529-7.55436468252923
5694.399.3879415402154-5.08794154021538
579195.0899670809172-4.0899670809172


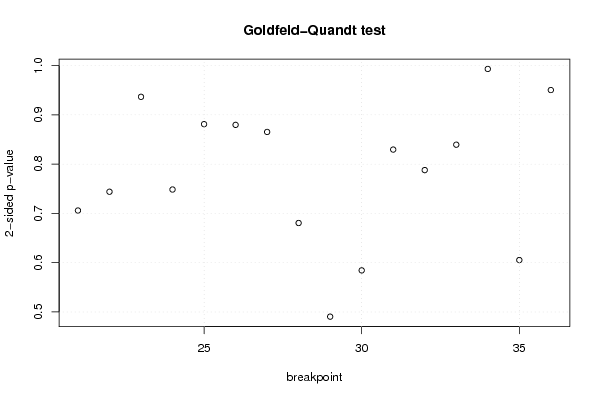
Goldfeld-Quandt test for Heteroskedasticity
p-valuesAlternative Hypothesis
breakpoint indexgreater2-sidedless
210.647065502549880.7058689949002390.352934497450120
220.6280108711466240.7439782577067520.371989128853376
230.5317177416982120.9365645166035750.468282258301788
240.6257764613420830.7484470773158340.374223538657917
250.5594257049674850.881148590065030.440574295032515
260.4398450040346970.8796900080693940.560154995965303
270.4326640972140600.8653281944281190.56733590278594
280.3402671385403830.6805342770807650.659732861459617
290.2452355475461320.4904710950922630.754764452453868
300.292187059648530.584374119297060.70781294035147
310.4147778000446490.8295556000892970.585222199955351
320.3939430397238420.7878860794476830.606056960276158
330.4197151604099910.8394303208199810.580284839590009
340.4965842896898920.9931685793797850.503415710310108
350.6973381525707440.6053236948585120.302661847429256
360.5248330901367340.9503338197265320.475166909863266

\begin{tabular}{lllllllll}
\hline
Goldfeld-Quandt test for Heteroskedasticity \tabularnewline
p-values & Alternative Hypothesis \tabularnewline
breakpoint index & greater & 2-sided & less \tabularnewline
21 & 0.64706550254988 & 0.705868994900239 & 0.352934497450120 \tabularnewline
22 & 0.628010871146624 & 0.743978257706752 & 0.371989128853376 \tabularnewline
23 & 0.531717741698212 & 0.936564516603575 & 0.468282258301788 \tabularnewline
24 & 0.625776461342083 & 0.748447077315834 & 0.374223538657917 \tabularnewline
25 & 0.559425704967485 & 0.88114859006503 & 0.440574295032515 \tabularnewline
26 & 0.439845004034697 & 0.879690008069394 & 0.560154995965303 \tabularnewline
27 & 0.432664097214060 & 0.865328194428119 & 0.56733590278594 \tabularnewline
28 & 0.340267138540383 & 0.680534277080765 & 0.659732861459617 \tabularnewline
29 & 0.245235547546132 & 0.490471095092263 & 0.754764452453868 \tabularnewline
30 & 0.29218705964853 & 0.58437411929706 & 0.70781294035147 \tabularnewline
31 & 0.414777800044649 & 0.829555600089297 & 0.585222199955351 \tabularnewline
32 & 0.393943039723842 & 0.787886079447683 & 0.606056960276158 \tabularnewline
33 & 0.419715160409991 & 0.839430320819981 & 0.580284839590009 \tabularnewline
34 & 0.496584289689892 & 0.993168579379785 & 0.503415710310108 \tabularnewline
35 & 0.697338152570744 & 0.605323694858512 & 0.302661847429256 \tabularnewline
36 & 0.524833090136734 & 0.950333819726532 & 0.475166909863266 \tabularnewline
\hline
\end{tabular}
%Source: https://freestatistics.org/blog/index.php?pk=68414&T=5

[TABLE]
[ROW][C]Goldfeld-Quandt test for Heteroskedasticity[/C][/ROW]
[ROW][C]p-values[/C][C]Alternative Hypothesis[/C][/ROW]
[ROW][C]breakpoint index[/C][C]greater[/C][C]2-sided[/C][C]less[/C][/ROW]
[ROW][C]21[/C][C]0.64706550254988[/C][C]0.705868994900239[/C][C]0.352934497450120[/C][/ROW]
[ROW][C]22[/C][C]0.628010871146624[/C][C]0.743978257706752[/C][C]0.371989128853376[/C][/ROW]
[ROW][C]23[/C][C]0.531717741698212[/C][C]0.936564516603575[/C][C]0.468282258301788[/C][/ROW]
[ROW][C]24[/C][C]0.625776461342083[/C][C]0.748447077315834[/C][C]0.374223538657917[/C][/ROW]
[ROW][C]25[/C][C]0.559425704967485[/C][C]0.88114859006503[/C][C]0.440574295032515[/C][/ROW]
[ROW][C]26[/C][C]0.439845004034697[/C][C]0.879690008069394[/C][C]0.560154995965303[/C][/ROW]
[ROW][C]27[/C][C]0.432664097214060[/C][C]0.865328194428119[/C][C]0.56733590278594[/C][/ROW]
[ROW][C]28[/C][C]0.340267138540383[/C][C]0.680534277080765[/C][C]0.659732861459617[/C][/ROW]
[ROW][C]29[/C][C]0.245235547546132[/C][C]0.490471095092263[/C][C]0.754764452453868[/C][/ROW]
[ROW][C]30[/C][C]0.29218705964853[/C][C]0.58437411929706[/C][C]0.70781294035147[/C][/ROW]
[ROW][C]31[/C][C]0.414777800044649[/C][C]0.829555600089297[/C][C]0.585222199955351[/C][/ROW]
[ROW][C]32[/C][C]0.393943039723842[/C][C]0.787886079447683[/C][C]0.606056960276158[/C][/ROW]
[ROW][C]33[/C][C]0.419715160409991[/C][C]0.839430320819981[/C][C]0.580284839590009[/C][/ROW]
[ROW][C]34[/C][C]0.496584289689892[/C][C]0.993168579379785[/C][C]0.503415710310108[/C][/ROW]
[ROW][C]35[/C][C]0.697338152570744[/C][C]0.605323694858512[/C][C]0.302661847429256[/C][/ROW]
[ROW][C]36[/C][C]0.524833090136734[/C][C]0.950333819726532[/C][C]0.475166909863266[/C][/ROW]
[/TABLE]
Source: https://freestatistics.org/blog/index.php?pk=68414&T=5

Globally Unique Identifier (entire table): ba.freestatistics.org/blog/index.php?pk=68414&T=5

As an alternative you can also use a QR Code:  

The GUIDs for individual cells are displayed in the table below:

Goldfeld-Quandt test for Heteroskedasticity
p-valuesAlternative Hypothesis
breakpoint indexgreater2-sidedless
210.647065502549880.7058689949002390.352934497450120
220.6280108711466240.7439782577067520.371989128853376
230.5317177416982120.9365645166035750.468282258301788
240.6257764613420830.7484470773158340.374223538657917
250.5594257049674850.881148590065030.440574295032515
260.4398450040346970.8796900080693940.560154995965303
270.4326640972140600.8653281944281190.56733590278594
280.3402671385403830.6805342770807650.659732861459617
290.2452355475461320.4904710950922630.754764452453868
300.292187059648530.584374119297060.70781294035147
310.4147778000446490.8295556000892970.585222199955351
320.3939430397238420.7878860794476830.606056960276158
330.4197151604099910.8394303208199810.580284839590009
340.4965842896898920.9931685793797850.503415710310108
350.6973381525707440.6053236948585120.302661847429256
360.5248330901367340.9503338197265320.475166909863266


Meta Analysis of Goldfeld-Quandt test for Heteroskedasticity
Description# significant tests% significant testsOK/NOK
1% type I error level00OK
5% type I error level00OK
10% type I error level00OK

\begin{tabular}{lllllllll}
\hline
Meta Analysis of Goldfeld-Quandt test for Heteroskedasticity \tabularnewline
Description & # significant tests & % significant tests & OK/NOK \tabularnewline
1% type I error level & 0 & 0 & OK \tabularnewline
5% type I error level & 0 & 0 & OK \tabularnewline
10% type I error level & 0 & 0 & OK \tabularnewline
\hline
\end{tabular}
%Source: https://freestatistics.org/blog/index.php?pk=68414&T=6

[TABLE]
[ROW][C]Meta Analysis of Goldfeld-Quandt test for Heteroskedasticity[/C][/ROW]
[ROW][C]Description[/C][C]# significant tests[/C][C]% significant tests[/C][C]OK/NOK[/C][/ROW]
[ROW][C]1% type I error level[/C][C]0[/C][C]0[/C][C]OK[/C][/ROW]
[ROW][C]5% type I error level[/C][C]0[/C][C]0[/C][C]OK[/C][/ROW]
[ROW][C]10% type I error level[/C][C]0[/C][C]0[/C][C]OK[/C][/ROW]
[/TABLE]
Source: https://freestatistics.org/blog/index.php?pk=68414&T=6

Globally Unique Identifier (entire table): ba.freestatistics.org/blog/index.php?pk=68414&T=6

As an alternative you can also use a QR Code:  

The GUIDs for individual cells are displayed in the table below:

Meta Analysis of Goldfeld-Quandt test for Heteroskedasticity
Description# significant tests% significant testsOK/NOK
1% type I error level00OK
5% type I error level00OK
10% type I error level00OK


Parameters (Session):
par1 = 1 ; par2 = Include Monthly Dummies ; par3 = Linear Trend ;
Parameters (R input):
par1 = 1 ; par2 = Include Monthly Dummies ; par3 = Linear Trend ;
R code (references can be found in the software module):
library(lattice)
library(lmtest)
n25 <- 25 #minimum number of obs. for Goldfeld-Quandt test
par1 <- as.numeric(par1)
x <- t(y)
k <- length(x[1,])
n <- length(x[,1])
x1 <- cbind(x[,par1], x[,1:k!=par1])
mycolnames <- c(colnames(x)[par1], colnames(x)[1:k!=par1])
colnames(x1) <- mycolnames #colnames(x)[par1]
x <- x1
if (par3 == 'First Differences'){
x2 <- array(0, dim=c(n-1,k), dimnames=list(1:(n-1), paste('(1-B)',colnames(x),sep='')))
for (i in 1:n-1) {
for (j in 1:k) {
x2[i,j] <- x[i+1,j] - x[i,j]
}
}
x <- x2
}
if (par2 == 'Include Monthly Dummies'){
x2 <- array(0, dim=c(n,11), dimnames=list(1:n, paste('M', seq(1:11), sep ='')))
for (i in 1:11){
x2[seq(i,n,12),i] <- 1
}
x <- cbind(x, x2)
}
if (par2 == 'Include Quarterly Dummies'){
x2 <- array(0, dim=c(n,3), dimnames=list(1:n, paste('Q', seq(1:3), sep ='')))
for (i in 1:3){
x2[seq(i,n,4),i] <- 1
}
x <- cbind(x, x2)
}
k <- length(x[1,])
if (par3 == 'Linear Trend'){
x <- cbind(x, c(1:n))
colnames(x)[k+1] <- 't'
}
x
k <- length(x[1,])
df <- as.data.frame(x)
(mylm <- lm(df))
(mysum <- summary(mylm))
if (n > n25) {
kp3 <- k + 3
nmkm3 <- n - k - 3
gqarr <- array(NA, dim=c(nmkm3-kp3+1,3))
numgqtests <- 0
numsignificant1 <- 0
numsignificant5 <- 0
numsignificant10 <- 0
for (mypoint in kp3:nmkm3) {
j <- 0
numgqtests <- numgqtests + 1
for (myalt in c('greater', 'two.sided', 'less')) {
j <- j + 1
gqarr[mypoint-kp3+1,j] <- gqtest(mylm, point=mypoint, alternative=myalt)$p.value
}
if (gqarr[mypoint-kp3+1,2] < 0.01) numsignificant1 <- numsignificant1 + 1
if (gqarr[mypoint-kp3+1,2] < 0.05) numsignificant5 <- numsignificant5 + 1
if (gqarr[mypoint-kp3+1,2] < 0.10) numsignificant10 <- numsignificant10 + 1
}
gqarr
}
bitmap(file='test0.png')
plot(x[,1], type='l', main='Actuals and Interpolation', ylab='value of Actuals and Interpolation (dots)', xlab='time or index')
points(x[,1]-mysum$resid)
grid()
dev.off()
bitmap(file='test1.png')
plot(mysum$resid, type='b', pch=19, main='Residuals', ylab='value of Residuals', xlab='time or index')
grid()
dev.off()
bitmap(file='test2.png')
hist(mysum$resid, main='Residual Histogram', xlab='values of Residuals')
grid()
dev.off()
bitmap(file='test3.png')
densityplot(~mysum$resid,col='black',main='Residual Density Plot', xlab='values of Residuals')
dev.off()
bitmap(file='test4.png')
qqnorm(mysum$resid, main='Residual Normal Q-Q Plot')
qqline(mysum$resid)
grid()
dev.off()
(myerror <- as.ts(mysum$resid))
bitmap(file='test5.png')
dum <- cbind(lag(myerror,k=1),myerror)
dum
dum1 <- dum[2:length(myerror),]
dum1
z <- as.data.frame(dum1)
z
plot(z,main=paste('Residual Lag plot, lowess, and regression line'), ylab='values of Residuals', xlab='lagged values of Residuals')
lines(lowess(z))
abline(lm(z))
grid()
dev.off()
bitmap(file='test6.png')
acf(mysum$resid, lag.max=length(mysum$resid)/2, main='Residual Autocorrelation Function')
grid()
dev.off()
bitmap(file='test7.png')
pacf(mysum$resid, lag.max=length(mysum$resid)/2, main='Residual Partial Autocorrelation Function')
grid()
dev.off()
bitmap(file='test8.png')
opar <- par(mfrow = c(2,2), oma = c(0, 0, 1.1, 0))
plot(mylm, las = 1, sub='Residual Diagnostics')
par(opar)
dev.off()
if (n > n25) {
bitmap(file='test9.png')
plot(kp3:nmkm3,gqarr[,2], main='Goldfeld-Quandt test',ylab='2-sided p-value',xlab='breakpoint')
grid()
dev.off()
}
load(file='createtable')
a<-table.start()
a<-table.row.start(a)
a<-table.element(a, 'Multiple Linear Regression - Estimated Regression Equation', 1, TRUE)
a<-table.row.end(a)
myeq <- colnames(x)[1]
myeq <- paste(myeq, '[t] = ', sep='')
for (i in 1:k){
if (mysum$coefficients[i,1] > 0) myeq <- paste(myeq, '+', '')
myeq <- paste(myeq, mysum$coefficients[i,1], sep=' ')
if (rownames(mysum$coefficients)[i] != '(Intercept)') {
myeq <- paste(myeq, rownames(mysum$coefficients)[i], sep='')
if (rownames(mysum$coefficients)[i] != 't') myeq <- paste(myeq, '[t]', sep='')
}
}
myeq <- paste(myeq, ' + e[t]')
a<-table.row.start(a)
a<-table.element(a, myeq)
a<-table.row.end(a)
a<-table.end(a)
table.save(a,file='mytable1.tab')
a<-table.start()
a<-table.row.start(a)
a<-table.element(a,hyperlink('ols1.htm','Multiple Linear Regression - Ordinary Least Squares',''), 6, TRUE)
a<-table.row.end(a)
a<-table.row.start(a)
a<-table.element(a,'Variable',header=TRUE)
a<-table.element(a,'Parameter',header=TRUE)
a<-table.element(a,'S.D.',header=TRUE)
a<-table.element(a,'T-STAT
H0: parameter = 0',header=TRUE)
a<-table.element(a,'2-tail p-value',header=TRUE)
a<-table.element(a,'1-tail p-value',header=TRUE)
a<-table.row.end(a)
for (i in 1:k){
a<-table.row.start(a)
a<-table.element(a,rownames(mysum$coefficients)[i],header=TRUE)
a<-table.element(a,mysum$coefficients[i,1])
a<-table.element(a, round(mysum$coefficients[i,2],6))
a<-table.element(a, round(mysum$coefficients[i,3],4))
a<-table.element(a, round(mysum$coefficients[i,4],6))
a<-table.element(a, round(mysum$coefficients[i,4]/2,6))
a<-table.row.end(a)
}
a<-table.end(a)
table.save(a,file='mytable2.tab')
a<-table.start()
a<-table.row.start(a)
a<-table.element(a, 'Multiple Linear Regression - Regression Statistics', 2, TRUE)
a<-table.row.end(a)
a<-table.row.start(a)
a<-table.element(a, 'Multiple R',1,TRUE)
a<-table.element(a, sqrt(mysum$r.squared))
a<-table.row.end(a)
a<-table.row.start(a)
a<-table.element(a, 'R-squared',1,TRUE)
a<-table.element(a, mysum$r.squared)
a<-table.row.end(a)
a<-table.row.start(a)
a<-table.element(a, 'Adjusted R-squared',1,TRUE)
a<-table.element(a, mysum$adj.r.squared)
a<-table.row.end(a)
a<-table.row.start(a)
a<-table.element(a, 'F-TEST (value)',1,TRUE)
a<-table.element(a, mysum$fstatistic[1])
a<-table.row.end(a)
a<-table.row.start(a)
a<-table.element(a, 'F-TEST (DF numerator)',1,TRUE)
a<-table.element(a, mysum$fstatistic[2])
a<-table.row.end(a)
a<-table.row.start(a)
a<-table.element(a, 'F-TEST (DF denominator)',1,TRUE)
a<-table.element(a, mysum$fstatistic[3])
a<-table.row.end(a)
a<-table.row.start(a)
a<-table.element(a, 'p-value',1,TRUE)
a<-table.element(a, 1-pf(mysum$fstatistic[1],mysum$fstatistic[2],mysum$fstatistic[3]))
a<-table.row.end(a)
a<-table.row.start(a)
a<-table.element(a, 'Multiple Linear Regression - Residual Statistics', 2, TRUE)
a<-table.row.end(a)
a<-table.row.start(a)
a<-table.element(a, 'Residual Standard Deviation',1,TRUE)
a<-table.element(a, mysum$sigma)
a<-table.row.end(a)
a<-table.row.start(a)
a<-table.element(a, 'Sum Squared Residuals',1,TRUE)
a<-table.element(a, sum(myerror*myerror))
a<-table.row.end(a)
a<-table.end(a)
table.save(a,file='mytable3.tab')
a<-table.start()
a<-table.row.start(a)
a<-table.element(a, 'Multiple Linear Regression - Actuals, Interpolation, and Residuals', 4, TRUE)
a<-table.row.end(a)
a<-table.row.start(a)
a<-table.element(a, 'Time or Index', 1, TRUE)
a<-table.element(a, 'Actuals', 1, TRUE)
a<-table.element(a, 'Interpolation
Forecast', 1, TRUE)
a<-table.element(a, 'Residuals
Prediction Error', 1, TRUE)
a<-table.row.end(a)
for (i in 1:n) {
a<-table.row.start(a)
a<-table.element(a,i, 1, TRUE)
a<-table.element(a,x[i])
a<-table.element(a,x[i]-mysum$resid[i])
a<-table.element(a,mysum$resid[i])
a<-table.row.end(a)
}
a<-table.end(a)
table.save(a,file='mytable4.tab')
if (n > n25) {
a<-table.start()
a<-table.row.start(a)
a<-table.element(a,'Goldfeld-Quandt test for Heteroskedasticity',4,TRUE)
a<-table.row.end(a)
a<-table.row.start(a)
a<-table.element(a,'p-values',header=TRUE)
a<-table.element(a,'Alternative Hypothesis',3,header=TRUE)
a<-table.row.end(a)
a<-table.row.start(a)
a<-table.element(a,'breakpoint index',header=TRUE)
a<-table.element(a,'greater',header=TRUE)
a<-table.element(a,'2-sided',header=TRUE)
a<-table.element(a,'less',header=TRUE)
a<-table.row.end(a)
for (mypoint in kp3:nmkm3) {
a<-table.row.start(a)
a<-table.element(a,mypoint,header=TRUE)
a<-table.element(a,gqarr[mypoint-kp3+1,1])
a<-table.element(a,gqarr[mypoint-kp3+1,2])
a<-table.element(a,gqarr[mypoint-kp3+1,3])
a<-table.row.end(a)
}
a<-table.end(a)
table.save(a,file='mytable5.tab')
a<-table.start()
a<-table.row.start(a)
a<-table.element(a,'Meta Analysis of Goldfeld-Quandt test for Heteroskedasticity',4,TRUE)
a<-table.row.end(a)
a<-table.row.start(a)
a<-table.element(a,'Description',header=TRUE)
a<-table.element(a,'# significant tests',header=TRUE)
a<-table.element(a,'% significant tests',header=TRUE)
a<-table.element(a,'OK/NOK',header=TRUE)
a<-table.row.end(a)
a<-table.row.start(a)
a<-table.element(a,'1% type I error level',header=TRUE)
a<-table.element(a,numsignificant1)
a<-table.element(a,numsignificant1/numgqtests)
if (numsignificant1/numgqtests < 0.01) dum <- 'OK' else dum <- 'NOK'
a<-table.element(a,dum)
a<-table.row.end(a)
a<-table.row.start(a)
a<-table.element(a,'5% type I error level',header=TRUE)
a<-table.element(a,numsignificant5)
a<-table.element(a,numsignificant5/numgqtests)
if (numsignificant5/numgqtests < 0.05) dum <- 'OK' else dum <- 'NOK'
a<-table.element(a,dum)
a<-table.row.end(a)
a<-table.row.start(a)
a<-table.element(a,'10% type I error level',header=TRUE)
a<-table.element(a,numsignificant10)
a<-table.element(a,numsignificant10/numgqtests)
if (numsignificant10/numgqtests < 0.1) dum <- 'OK' else dum <- 'NOK'
a<-table.element(a,dum)
a<-table.row.end(a)
a<-table.end(a)
table.save(a,file='mytable6.tab')
}