| Multiple Linear Regression - Estimated Regression Equation |
| Y[t] = -6.79694103656072 + 1.05486730212581X[t] + 0.110965757067476Y1[t] + 0.391959746665791Y2[t] + 0.599520525239775Y3[t] -0.106726216223816Y4[t] -15.4550336799605M1[t] -10.4574260073356M2[t] -2.31357909367123M3[t] + 10.2745695704598M4[t] + 1.88615375451333M5[t] -1.91130093006396M6[t] + 4.78338037640562M7[t] -17.3903720895910M8[t] -8.15431671909183M9[t] + 9.7410438791364M10[t] + 21.7116429765906M11[t] -0.0196445345992148t + e[t] |
| Multiple Linear Regression - Ordinary Least Squares | |||||
| Variable | Parameter | S.D. | T-STAT H0: parameter = 0 | 2-tail p-value | 1-tail p-value |
| (Intercept) | -6.79694103656072 | 30.840317 | -0.2204 | 0.826716 | 0.413358 |
| X | 1.05486730212581 | 1.855474 | 0.5685 | 0.572944 | 0.286472 |
| Y1 | 0.110965757067476 | 0.158174 | 0.7015 | 0.48713 | 0.243565 |
| Y2 | 0.391959746665791 | 0.136594 | 2.8695 | 0.006606 | 0.003303 |
| Y3 | 0.599520525239775 | 0.14352 | 4.1773 | 0.000161 | 8e-05 |
| Y4 | -0.106726216223816 | 0.175443 | -0.6083 | 0.546499 | 0.27325 |
| M1 | -15.4550336799605 | 4.849677 | -3.1868 | 0.002831 | 0.001416 |
| M2 | -10.4574260073356 | 7.951912 | -1.3151 | 0.196162 | 0.098081 |
| M3 | -2.31357909367123 | 7.859658 | -0.2944 | 0.770043 | 0.385021 |
| M4 | 10.2745695704598 | 6.311884 | 1.6278 | 0.111618 | 0.055809 |
| M5 | 1.88615375451333 | 4.409779 | 0.4277 | 0.671207 | 0.335604 |
| M6 | -1.91130093006396 | 4.507512 | -0.424 | 0.673877 | 0.336938 |
| M7 | 4.78338037640562 | 5.474247 | 0.8738 | 0.387578 | 0.193789 |
| M8 | -17.3903720895910 | 5.774528 | -3.0116 | 0.004544 | 0.002272 |
| M9 | -8.15431671909183 | 7.291104 | -1.1184 | 0.270241 | 0.135121 |
| M10 | 9.7410438791364 | 8.063551 | 1.208 | 0.234309 | 0.117154 |
| M11 | 21.7116429765906 | 6.339742 | 3.4247 | 0.001462 | 0.000731 |
| t | -0.0196445345992148 | 0.057226 | -0.3433 | 0.733231 | 0.366616 |
| Multiple Linear Regression - Regression Statistics | |
| Multiple R | 0.932735061561709 |
| R-squared | 0.869994695066524 |
| Adjusted R-squared | 0.813325715992958 |
| F-TEST (value) | 15.3522210791396 |
| F-TEST (DF numerator) | 17 |
| F-TEST (DF denominator) | 39 |
| p-value | 2.81630274656663e-12 |
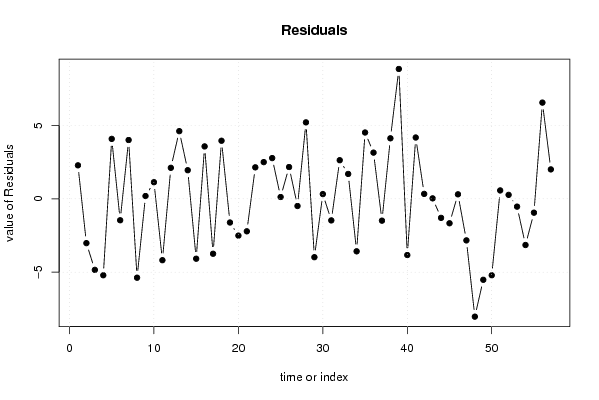
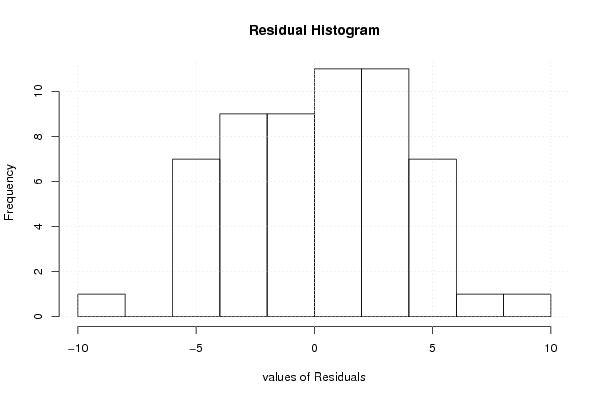
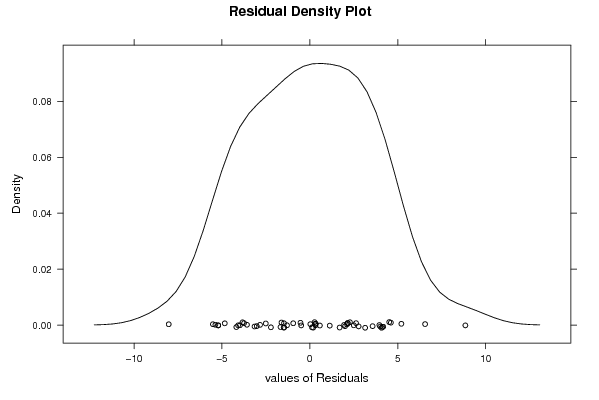
| Multiple Linear Regression - Residual Statistics | |
| Residual Standard Deviation | 4.21808938618669 |
| Sum Squared Residuals | 693.898844724573 |
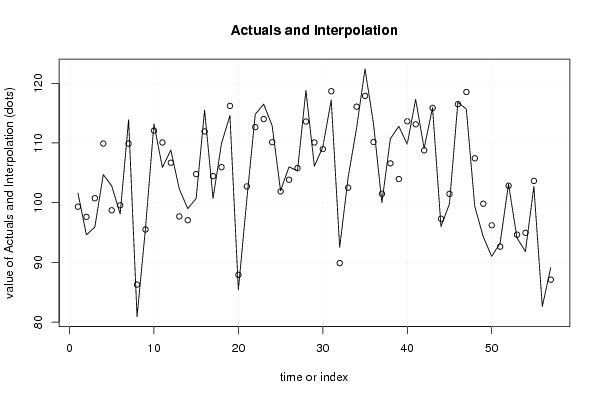
| Multiple Linear Regression - Actuals, Interpolation, and Residuals | |||
| Time or Index | Actuals | Interpolation Forecast | Residuals Prediction Error |
| 1 | 101.6 | 99.320475772464 | 2.27952422753588 |
| 2 | 94.6 | 97.6211072144157 | -3.02110721441568 |
| 3 | 95.9 | 100.741156867006 | -4.84115686700567 |
| 4 | 104.7 | 109.908862099633 | -5.20886209963304 |
| 5 | 102.8 | 98.7192145119453 | 4.08078548805473 |
| 6 | 98.1 | 99.5614995911654 | -1.46149959116536 |
| 7 | 113.9 | 109.896336866748 | 4.00366313325251 |
| 8 | 80.9 | 86.2741154292514 | -5.3741154292514 |
| 9 | 95.7 | 95.512140351655 | 0.187859648344918 |
| 10 | 113.2 | 112.069515494952 | 1.13048450504796 |
| 11 | 105.9 | 110.081950047467 | -4.18195004746746 |
| 12 | 108.8 | 106.689290255058 | 2.11070974494150 |
| 13 | 102.3 | 97.6926545071304 | 4.60734549286965 |
| 14 | 99 | 97.0527883318063 | 1.94721166819372 |
| 15 | 100.7 | 104.780776260850 | -4.0807762608503 |
| 16 | 115.5 | 111.932578842080 | 3.56742115792044 |
| 17 | 100.7 | 104.442959207415 | -3.74295920741531 |
| 18 | 109.9 | 105.944978980315 | 3.95502101968509 |
| 19 | 114.6 | 116.214905481883 | -1.61490548188281 |
| 20 | 85.4 | 87.9075988955933 | -2.50759889559334 |
| 21 | 100.5 | 102.715670536558 | -2.21567053655809 |
| 22 | 114.8 | 112.657610208633 | 2.14238979136728 |
| 23 | 116.5 | 114.00086798874 | 2.49913201125992 |
| 24 | 112.9 | 110.126925356529 | 2.77307464347073 |
| 25 | 102 | 101.880679631808 | 0.119320368192365 |
| 26 | 106 | 103.836547660921 | 2.16345233907934 |
| 27 | 105.3 | 105.792543371155 | -0.492543371154899 |
| 28 | 118.8 | 113.595164380482 | 5.20483561951772 |
| 29 | 106.1 | 110.077654515693 | -3.97765451569272 |
| 30 | 109.3 | 108.979717338547 | 0.320282661453414 |
| 31 | 117.2 | 118.672757541408 | -1.47275754140807 |
| 32 | 92.5 | 89.8720068120468 | 2.62799318795316 |
| 33 | 104.2 | 102.506960613425 | 1.69303938657547 |
| 34 | 112.5 | 116.077798358938 | -3.57779835893824 |
| 35 | 122.4 | 117.884403659852 | 4.51559634014761 |
| 36 | 113.3 | 110.155470726990 | 3.14452927300966 |
| 37 | 100 | 101.489702705205 | -1.48970270520455 |
| 38 | 110.7 | 106.579899915003 | 4.12010008499718 |
| 39 | 112.8 | 103.955171483312 | 8.84482851668796 |
| 40 | 109.8 | 113.631798383320 | -3.83179838331952 |
| 41 | 117.3 | 113.126337604562 | 4.17366239543843 |
| 42 | 109.1 | 108.766164722165 | 0.333835277835293 |
| 43 | 115.9 | 115.870240677136 | 0.0297593228638166 |
| 44 | 96 | 97.2997642524604 | -1.29976425246039 |
| 45 | 99.8 | 101.467741331825 | -1.66774133182538 |
| 46 | 116.8 | 116.495075937477 | 0.304924062523 |
| 47 | 115.7 | 118.53277830394 | -2.83277830394008 |
| 48 | 99.4 | 107.428313661422 | -8.02831366142187 |
| 49 | 94.3 | 99.8164873833933 | -5.51648738339334 |
| 50 | 91 | 96.2096568778546 | -5.20965687785457 |
| 51 | 93.2 | 92.6303520176771 | 0.56964798232291 |
| 52 | 103.1 | 102.831596294486 | 0.26840370551438 |
| 53 | 94.1 | 94.6338341603851 | -0.533834160385132 |
| 54 | 91.8 | 94.9476393678084 | -3.14763936780844 |
| 55 | 102.7 | 103.645759432825 | -0.945759432825444 |
| 56 | 82.6 | 76.046514610648 | 6.55348538935196 |
| 57 | 89.1 | 87.097487166537 | 2.00251283346307 |
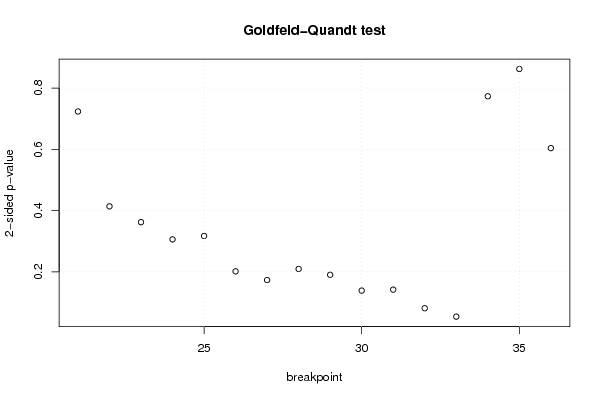
| Goldfeld-Quandt test for Heteroskedasticity | |||
| p-values | Alternative Hypothesis | ||
| breakpoint index | greater | 2-sided | less |
| 21 | 0.36179619530423 | 0.72359239060846 | 0.63820380469577 |
| 22 | 0.206939083864356 | 0.413878167728711 | 0.793060916135644 |
| 23 | 0.181122517868897 | 0.362245035737793 | 0.818877482131103 |
| 24 | 0.152981680628758 | 0.305963361257517 | 0.847018319371242 |
| 25 | 0.158577893026211 | 0.317155786052423 | 0.841422106973789 |
| 26 | 0.100831739141817 | 0.201663478283634 | 0.899168260858183 |
| 27 | 0.0865948030615352 | 0.173189606123070 | 0.913405196938465 |
| 28 | 0.104714691215949 | 0.209429382431898 | 0.895285308784051 |
| 29 | 0.0952049913045044 | 0.190409982609009 | 0.904795008695496 |
| 30 | 0.0693642216866015 | 0.138728443373203 | 0.930635778313398 |
| 31 | 0.0709153084780533 | 0.141830616956107 | 0.929084691521947 |
| 32 | 0.0405759980767949 | 0.0811519961535898 | 0.959424001923205 |
| 33 | 0.0268404090670941 | 0.0536808181341882 | 0.973159590932906 |
| 34 | 0.386599205921636 | 0.773198411843271 | 0.613400794078364 |
| 35 | 0.431238347923233 | 0.862476695846465 | 0.568761652076767 |
| 36 | 0.301917166580482 | 0.603834333160963 | 0.698082833419518 |
| Meta Analysis of Goldfeld-Quandt test for Heteroskedasticity | |||
| Description | # significant tests | % significant tests | OK/NOK |
| 1% type I error level | 0 | 0 | OK |
| 5% type I error level | 0 | 0 | OK |
| 10% type I error level | 2 | 0.125 | NOK |