Free Statistics

of Irreproducible Research!

Author's title

Author*The author of this computation has been verified*
R Software Modulerwasp_multipleregression.wasp
Title produced by softwareMultiple Regression
Date of computationWed, 16 Dec 2009 07:57:17 -0700
Cite this page as followsStatistical Computations at FreeStatistics.org, Office for Research Development and Education, URL https://freestatistics.org/blog/index.php?v=date/2009/Dec/16/t12609755597k0k67stgje1d9n.htm/, Retrieved Tue, 30 Apr 2024 13:25:08 +0000
Statistical Computations at FreeStatistics.org, Office for Research Development and Education, URL https://freestatistics.org/blog/index.php?pk=68398, Retrieved Tue, 30 Apr 2024 13:25:08 +0000
QR Codes:

Original text written by user:
IsPrivate?No (this computation is public)
User-defined keywords
Estimated Impact101
Family? (F = Feedback message, R = changed R code, M = changed R Module, P = changed Parameters, D = changed Data)
-     [Multiple Regression] [Q1 The Seatbeltlaw] [2007-11-14 19:27:43] [8cd6641b921d30ebe00b648d1481bba0]
- RM D  [Multiple Regression] [Seatbelt] [2009-11-12 14:10:54] [b98453cac15ba1066b407e146608df68]
- R  D      [Multiple Regression] [Model 4, kijken n...] [2009-12-16 14:57:17] [154177ed6b2613a730375f7d341441cf] [Current]
-    D        [Multiple Regression] [Model 4, kijken n...] [2009-12-16 15:04:25] [075a06058fde559dd021d126a2b15a40]
-    D          [Multiple Regression] [Model 5, kijken n...] [2009-12-16 15:21:57] [075a06058fde559dd021d126a2b15a40]
Feedback Forum

Post a new message
Dataseries X:
101.6	8.3	103.9	110.3	114.1	96.8
94.6	8.5	101.6	103.9	110.3	114.1
95.9	8.6	94.6	101.6	103.9	110.3
104.7	8.5	95.9	94.6	101.6	103.9
102.8	8.2	104.7	95.9	94.6	101.6
98.1	8.1	102.8	104.7	95.9	94.6
113.9	7.9	98.1	102.8	104.7	95.9
80.9	8.6	113.9	98.1	102.8	104.7
95.7	8.7	80.9	113.9	98.1	102.8
113.2	8.7	95.7	80.9	113.9	98.1
105.9	8.5	113.2	95.7	80.9	113.9
108.8	8.4	105.9	113.2	95.7	80.9
102.3	8.5	108.8	105.9	113.2	95.7
99	8.7	102.3	108.8	105.9	113.2
100.7	8.7	99	102.3	108.8	105.9
115.5	8.6	100.7	99	102.3	108.8
100.7	8.5	115.5	100.7	99	102.3
109.9	8.3	100.7	115.5	100.7	99
114.6	8	109.9	100.7	115.5	100.7
85.4	8.2	114.6	109.9	100.7	115.5
100.5	8.1	85.4	114.6	109.9	100.7
114.8	8.1	100.5	85.4	114.6	109.9
116.5	8	114.8	100.5	85.4	114.6
112.9	7.9	116.5	114.8	100.5	85.4
102	7.9	112.9	116.5	114.8	100.5
106	8	102	112.9	116.5	114.8
105.3	8	106	102	112.9	116.5
118.8	7.9	105.3	106	102	112.9
106.1	8	118.8	105.3	106	102
109.3	7.7	106.1	118.8	105.3	106
117.2	7.2	109.3	106.1	118.8	105.3
92.5	7.5	117.2	109.3	106.1	118.8
104.2	7.3	92.5	117.2	109.3	106.1
112.5	7	104.2	92.5	117.2	109.3
122.4	7	112.5	104.2	92.5	117.2
113.3	7	122.4	112.5	104.2	92.5
100	7.2	113.3	122.4	112.5	104.2
110.7	7.3	100	113.3	122.4	112.5
112.8	7.1	110.7	100	113.3	122.4
109.8	6.8	112.8	110.7	100	113.3
117.3	6.4	109.8	112.8	110.7	100
109.1	6.1	117.3	109.8	112.8	110.7
115.9	6.5	109.1	117.3	109.8	112.8
96	7.7	115.9	109.1	117.3	109.8
99.8	7.9	96	115.9	109.1	117.3
116.8	7.5	99.8	96	115.9	109.1
115.7	6.9	116.8	99.8	96	115.9
99.4	6.6	115.7	116.8	99.8	96
94.3	6.9	99.4	115.7	116.8	99.8
91	7.7	94.3	99.4	115.7	116.8
93.2	8	91	94.3	99.4	115.7
103.1	8	93.2	91	94.3	99.4
94.1	7.7	103.1	93.2	91	94.3
91.8	7.3	94.1	103.1	93.2	91
102.7	7.4	91.8	94.1	103.1	93.2
82.6	8.1	102.7	91.8	94.1	103.1
89.1	8.3	82.6	102.7	91.8	94.1


Summary of computational transaction
Raw Inputview raw input (R code)
Raw Outputview raw output of R engine
Computing time4 seconds
R Server'Gwilym Jenkins' @ 72.249.127.135

\begin{tabular}{lllllllll}
\hline
Summary of computational transaction \tabularnewline
Raw Input & view raw input (R code)  \tabularnewline
Raw Output & view raw output of R engine  \tabularnewline
Computing time & 4 seconds \tabularnewline
R Server & 'Gwilym Jenkins' @ 72.249.127.135 \tabularnewline
\hline
\end{tabular}
%Source: https://freestatistics.org/blog/index.php?pk=68398&T=0

[TABLE]
[ROW][C]Summary of computational transaction[/C][/ROW]
[ROW][C]Raw Input[/C][C]view raw input (R code) [/C][/ROW]
[ROW][C]Raw Output[/C][C]view raw output of R engine [/C][/ROW]
[ROW][C]Computing time[/C][C]4 seconds[/C][/ROW]
[ROW][C]R Server[/C][C]'Gwilym Jenkins' @ 72.249.127.135[/C][/ROW]
[/TABLE]
Source: https://freestatistics.org/blog/index.php?pk=68398&T=0

Globally Unique Identifier (entire table): ba.freestatistics.org/blog/index.php?pk=68398&T=0

As an alternative you can also use a QR Code:  

The GUIDs for individual cells are displayed in the table below:

Summary of computational transaction
Raw Inputview raw input (R code)
Raw Outputview raw output of R engine
Computing time4 seconds
R Server'Gwilym Jenkins' @ 72.249.127.135


Multiple Linear Regression - Estimated Regression Equation
Y[t] = -6.79694103656072 + 1.05486730212581X[t] + 0.110965757067476Y1[t] + 0.391959746665791Y2[t] + 0.599520525239775Y3[t] -0.106726216223816Y4[t] -15.4550336799605M1[t] -10.4574260073356M2[t] -2.31357909367123M3[t] + 10.2745695704598M4[t] + 1.88615375451333M5[t] -1.91130093006396M6[t] + 4.78338037640562M7[t] -17.3903720895910M8[t] -8.15431671909183M9[t] + 9.7410438791364M10[t] + 21.7116429765906M11[t] -0.0196445345992148t + e[t]

\begin{tabular}{lllllllll}
\hline
Multiple Linear Regression - Estimated Regression Equation \tabularnewline
Y[t] =  -6.79694103656072 +  1.05486730212581X[t] +  0.110965757067476Y1[t] +  0.391959746665791Y2[t] +  0.599520525239775Y3[t] -0.106726216223816Y4[t] -15.4550336799605M1[t] -10.4574260073356M2[t] -2.31357909367123M3[t] +  10.2745695704598M4[t] +  1.88615375451333M5[t] -1.91130093006396M6[t] +  4.78338037640562M7[t] -17.3903720895910M8[t] -8.15431671909183M9[t] +  9.7410438791364M10[t] +  21.7116429765906M11[t] -0.0196445345992148t  + e[t] \tabularnewline
\hline
\end{tabular}
%Source: https://freestatistics.org/blog/index.php?pk=68398&T=1

[TABLE]
[ROW][C]Multiple Linear Regression - Estimated Regression Equation[/C][/ROW]
[ROW][C]Y[t] =  -6.79694103656072 +  1.05486730212581X[t] +  0.110965757067476Y1[t] +  0.391959746665791Y2[t] +  0.599520525239775Y3[t] -0.106726216223816Y4[t] -15.4550336799605M1[t] -10.4574260073356M2[t] -2.31357909367123M3[t] +  10.2745695704598M4[t] +  1.88615375451333M5[t] -1.91130093006396M6[t] +  4.78338037640562M7[t] -17.3903720895910M8[t] -8.15431671909183M9[t] +  9.7410438791364M10[t] +  21.7116429765906M11[t] -0.0196445345992148t  + e[t][/C][/ROW]
[/TABLE]
Source: https://freestatistics.org/blog/index.php?pk=68398&T=1

Globally Unique Identifier (entire table): ba.freestatistics.org/blog/index.php?pk=68398&T=1

As an alternative you can also use a QR Code:  

The GUIDs for individual cells are displayed in the table below:

Multiple Linear Regression - Estimated Regression Equation
Y[t] = -6.79694103656072 + 1.05486730212581X[t] + 0.110965757067476Y1[t] + 0.391959746665791Y2[t] + 0.599520525239775Y3[t] -0.106726216223816Y4[t] -15.4550336799605M1[t] -10.4574260073356M2[t] -2.31357909367123M3[t] + 10.2745695704598M4[t] + 1.88615375451333M5[t] -1.91130093006396M6[t] + 4.78338037640562M7[t] -17.3903720895910M8[t] -8.15431671909183M9[t] + 9.7410438791364M10[t] + 21.7116429765906M11[t] -0.0196445345992148t + e[t]


Multiple Linear Regression - Ordinary Least Squares
VariableParameterS.D.T-STATH0: parameter = 02-tail p-value1-tail p-value
(Intercept)-6.7969410365607230.840317-0.22040.8267160.413358
X1.054867302125811.8554740.56850.5729440.286472
Y10.1109657570674760.1581740.70150.487130.243565
Y20.3919597466657910.1365942.86950.0066060.003303
Y30.5995205252397750.143524.17730.0001618e-05
Y4-0.1067262162238160.175443-0.60830.5464990.27325
M1-15.45503367996054.849677-3.18680.0028310.001416
M2-10.45742600733567.951912-1.31510.1961620.098081
M3-2.313579093671237.859658-0.29440.7700430.385021
M410.27456957045986.3118841.62780.1116180.055809
M51.886153754513334.4097790.42770.6712070.335604
M6-1.911300930063964.507512-0.4240.6738770.336938
M74.783380376405625.4742470.87380.3875780.193789
M8-17.39037208959105.774528-3.01160.0045440.002272
M9-8.154316719091837.291104-1.11840.2702410.135121
M109.74104387913648.0635511.2080.2343090.117154
M1121.71164297659066.3397423.42470.0014620.000731
t-0.01964453459921480.057226-0.34330.7332310.366616

\begin{tabular}{lllllllll}
\hline
Multiple Linear Regression - Ordinary Least Squares \tabularnewline
Variable & Parameter & S.D. & T-STATH0: parameter = 0 & 2-tail p-value & 1-tail p-value \tabularnewline
(Intercept) & -6.79694103656072 & 30.840317 & -0.2204 & 0.826716 & 0.413358 \tabularnewline
X & 1.05486730212581 & 1.855474 & 0.5685 & 0.572944 & 0.286472 \tabularnewline
Y1 & 0.110965757067476 & 0.158174 & 0.7015 & 0.48713 & 0.243565 \tabularnewline
Y2 & 0.391959746665791 & 0.136594 & 2.8695 & 0.006606 & 0.003303 \tabularnewline
Y3 & 0.599520525239775 & 0.14352 & 4.1773 & 0.000161 & 8e-05 \tabularnewline
Y4 & -0.106726216223816 & 0.175443 & -0.6083 & 0.546499 & 0.27325 \tabularnewline
M1 & -15.4550336799605 & 4.849677 & -3.1868 & 0.002831 & 0.001416 \tabularnewline
M2 & -10.4574260073356 & 7.951912 & -1.3151 & 0.196162 & 0.098081 \tabularnewline
M3 & -2.31357909367123 & 7.859658 & -0.2944 & 0.770043 & 0.385021 \tabularnewline
M4 & 10.2745695704598 & 6.311884 & 1.6278 & 0.111618 & 0.055809 \tabularnewline
M5 & 1.88615375451333 & 4.409779 & 0.4277 & 0.671207 & 0.335604 \tabularnewline
M6 & -1.91130093006396 & 4.507512 & -0.424 & 0.673877 & 0.336938 \tabularnewline
M7 & 4.78338037640562 & 5.474247 & 0.8738 & 0.387578 & 0.193789 \tabularnewline
M8 & -17.3903720895910 & 5.774528 & -3.0116 & 0.004544 & 0.002272 \tabularnewline
M9 & -8.15431671909183 & 7.291104 & -1.1184 & 0.270241 & 0.135121 \tabularnewline
M10 & 9.7410438791364 & 8.063551 & 1.208 & 0.234309 & 0.117154 \tabularnewline
M11 & 21.7116429765906 & 6.339742 & 3.4247 & 0.001462 & 0.000731 \tabularnewline
t & -0.0196445345992148 & 0.057226 & -0.3433 & 0.733231 & 0.366616 \tabularnewline
\hline
\end{tabular}
%Source: https://freestatistics.org/blog/index.php?pk=68398&T=2

[TABLE]
[ROW][C]Multiple Linear Regression - Ordinary Least Squares[/C][/ROW]
[ROW][C]Variable[/C][C]Parameter[/C][C]S.D.[/C][C]T-STATH0: parameter = 0[/C][C]2-tail p-value[/C][C]1-tail p-value[/C][/ROW]
[ROW][C](Intercept)[/C][C]-6.79694103656072[/C][C]30.840317[/C][C]-0.2204[/C][C]0.826716[/C][C]0.413358[/C][/ROW]
[ROW][C]X[/C][C]1.05486730212581[/C][C]1.855474[/C][C]0.5685[/C][C]0.572944[/C][C]0.286472[/C][/ROW]
[ROW][C]Y1[/C][C]0.110965757067476[/C][C]0.158174[/C][C]0.7015[/C][C]0.48713[/C][C]0.243565[/C][/ROW]
[ROW][C]Y2[/C][C]0.391959746665791[/C][C]0.136594[/C][C]2.8695[/C][C]0.006606[/C][C]0.003303[/C][/ROW]
[ROW][C]Y3[/C][C]0.599520525239775[/C][C]0.14352[/C][C]4.1773[/C][C]0.000161[/C][C]8e-05[/C][/ROW]
[ROW][C]Y4[/C][C]-0.106726216223816[/C][C]0.175443[/C][C]-0.6083[/C][C]0.546499[/C][C]0.27325[/C][/ROW]
[ROW][C]M1[/C][C]-15.4550336799605[/C][C]4.849677[/C][C]-3.1868[/C][C]0.002831[/C][C]0.001416[/C][/ROW]
[ROW][C]M2[/C][C]-10.4574260073356[/C][C]7.951912[/C][C]-1.3151[/C][C]0.196162[/C][C]0.098081[/C][/ROW]
[ROW][C]M3[/C][C]-2.31357909367123[/C][C]7.859658[/C][C]-0.2944[/C][C]0.770043[/C][C]0.385021[/C][/ROW]
[ROW][C]M4[/C][C]10.2745695704598[/C][C]6.311884[/C][C]1.6278[/C][C]0.111618[/C][C]0.055809[/C][/ROW]
[ROW][C]M5[/C][C]1.88615375451333[/C][C]4.409779[/C][C]0.4277[/C][C]0.671207[/C][C]0.335604[/C][/ROW]
[ROW][C]M6[/C][C]-1.91130093006396[/C][C]4.507512[/C][C]-0.424[/C][C]0.673877[/C][C]0.336938[/C][/ROW]
[ROW][C]M7[/C][C]4.78338037640562[/C][C]5.474247[/C][C]0.8738[/C][C]0.387578[/C][C]0.193789[/C][/ROW]
[ROW][C]M8[/C][C]-17.3903720895910[/C][C]5.774528[/C][C]-3.0116[/C][C]0.004544[/C][C]0.002272[/C][/ROW]
[ROW][C]M9[/C][C]-8.15431671909183[/C][C]7.291104[/C][C]-1.1184[/C][C]0.270241[/C][C]0.135121[/C][/ROW]
[ROW][C]M10[/C][C]9.7410438791364[/C][C]8.063551[/C][C]1.208[/C][C]0.234309[/C][C]0.117154[/C][/ROW]
[ROW][C]M11[/C][C]21.7116429765906[/C][C]6.339742[/C][C]3.4247[/C][C]0.001462[/C][C]0.000731[/C][/ROW]
[ROW][C]t[/C][C]-0.0196445345992148[/C][C]0.057226[/C][C]-0.3433[/C][C]0.733231[/C][C]0.366616[/C][/ROW]
[/TABLE]
Source: https://freestatistics.org/blog/index.php?pk=68398&T=2

Globally Unique Identifier (entire table): ba.freestatistics.org/blog/index.php?pk=68398&T=2

As an alternative you can also use a QR Code:  

The GUIDs for individual cells are displayed in the table below:

Multiple Linear Regression - Ordinary Least Squares
VariableParameterS.D.T-STATH0: parameter = 02-tail p-value1-tail p-value
(Intercept)-6.7969410365607230.840317-0.22040.8267160.413358
X1.054867302125811.8554740.56850.5729440.286472
Y10.1109657570674760.1581740.70150.487130.243565
Y20.3919597466657910.1365942.86950.0066060.003303
Y30.5995205252397750.143524.17730.0001618e-05
Y4-0.1067262162238160.175443-0.60830.5464990.27325
M1-15.45503367996054.849677-3.18680.0028310.001416
M2-10.45742600733567.951912-1.31510.1961620.098081
M3-2.313579093671237.859658-0.29440.7700430.385021
M410.27456957045986.3118841.62780.1116180.055809
M51.886153754513334.4097790.42770.6712070.335604
M6-1.911300930063964.507512-0.4240.6738770.336938
M74.783380376405625.4742470.87380.3875780.193789
M8-17.39037208959105.774528-3.01160.0045440.002272
M9-8.154316719091837.291104-1.11840.2702410.135121
M109.74104387913648.0635511.2080.2343090.117154
M1121.71164297659066.3397423.42470.0014620.000731
t-0.01964453459921480.057226-0.34330.7332310.366616


Multiple Linear Regression - Regression Statistics
Multiple R0.932735061561709
R-squared0.869994695066524
Adjusted R-squared0.813325715992958
F-TEST (value)15.3522210791396
F-TEST (DF numerator)17
F-TEST (DF denominator)39
p-value2.81630274656663e-12
Multiple Linear Regression - Residual Statistics
Residual Standard Deviation4.21808938618669
Sum Squared Residuals693.898844724573

\begin{tabular}{lllllllll}
\hline
Multiple Linear Regression - Regression Statistics \tabularnewline
Multiple R & 0.932735061561709 \tabularnewline
R-squared & 0.869994695066524 \tabularnewline
Adjusted R-squared & 0.813325715992958 \tabularnewline
F-TEST (value) & 15.3522210791396 \tabularnewline
F-TEST (DF numerator) & 17 \tabularnewline
F-TEST (DF denominator) & 39 \tabularnewline
p-value & 2.81630274656663e-12 \tabularnewline
Multiple Linear Regression - Residual Statistics \tabularnewline
Residual Standard Deviation & 4.21808938618669 \tabularnewline
Sum Squared Residuals & 693.898844724573 \tabularnewline
\hline
\end{tabular}
%Source: https://freestatistics.org/blog/index.php?pk=68398&T=3

[TABLE]
[ROW][C]Multiple Linear Regression - Regression Statistics[/C][/ROW]
[ROW][C]Multiple R[/C][C]0.932735061561709[/C][/ROW]
[ROW][C]R-squared[/C][C]0.869994695066524[/C][/ROW]
[ROW][C]Adjusted R-squared[/C][C]0.813325715992958[/C][/ROW]
[ROW][C]F-TEST (value)[/C][C]15.3522210791396[/C][/ROW]
[ROW][C]F-TEST (DF numerator)[/C][C]17[/C][/ROW]
[ROW][C]F-TEST (DF denominator)[/C][C]39[/C][/ROW]
[ROW][C]p-value[/C][C]2.81630274656663e-12[/C][/ROW]
[ROW][C]Multiple Linear Regression - Residual Statistics[/C][/ROW]
[ROW][C]Residual Standard Deviation[/C][C]4.21808938618669[/C][/ROW]
[ROW][C]Sum Squared Residuals[/C][C]693.898844724573[/C][/ROW]
[/TABLE]
Source: https://freestatistics.org/blog/index.php?pk=68398&T=3

Globally Unique Identifier (entire table): ba.freestatistics.org/blog/index.php?pk=68398&T=3

As an alternative you can also use a QR Code:  

The GUIDs for individual cells are displayed in the table below:

Multiple Linear Regression - Regression Statistics
Multiple R0.932735061561709
R-squared0.869994695066524
Adjusted R-squared0.813325715992958
F-TEST (value)15.3522210791396
F-TEST (DF numerator)17
F-TEST (DF denominator)39
p-value2.81630274656663e-12
Multiple Linear Regression - Residual Statistics
Residual Standard Deviation4.21808938618669
Sum Squared Residuals693.898844724573


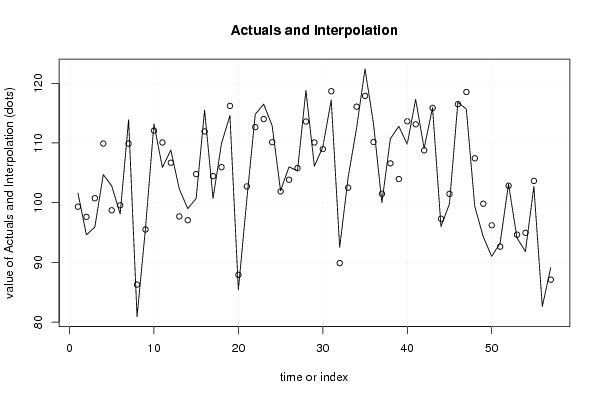
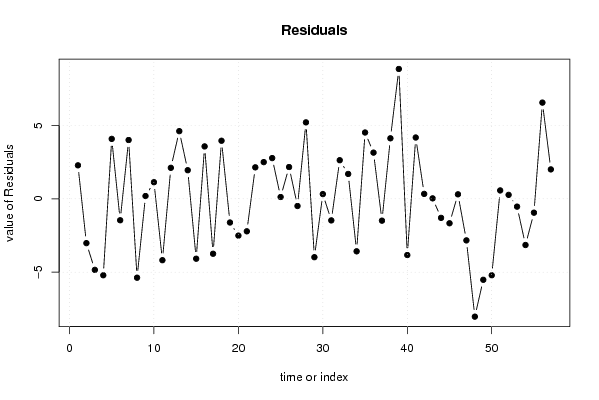
Multiple Linear Regression - Actuals, Interpolation, and Residuals
Time or IndexActualsInterpolationForecastResidualsPrediction Error
1101.699.3204757724642.27952422753588
294.697.6211072144157-3.02110721441568
395.9100.741156867006-4.84115686700567
4104.7109.908862099633-5.20886209963304
5102.898.71921451194534.08078548805473
698.199.5614995911654-1.46149959116536
7113.9109.8963368667484.00366313325251
880.986.2741154292514-5.3741154292514
995.795.5121403516550.187859648344918
10113.2112.0695154949521.13048450504796
11105.9110.081950047467-4.18195004746746
12108.8106.6892902550582.11070974494150
13102.397.69265450713044.60734549286965
149997.05278833180631.94721166819372
15100.7104.780776260850-4.0807762608503
16115.5111.9325788420803.56742115792044
17100.7104.442959207415-3.74295920741531
18109.9105.9449789803153.95502101968509
19114.6116.214905481883-1.61490548188281
2085.487.9075988955933-2.50759889559334
21100.5102.715670536558-2.21567053655809
22114.8112.6576102086332.14238979136728
23116.5114.000867988742.49913201125992
24112.9110.1269253565292.77307464347073
25102101.8806796318080.119320368192365
26106103.8365476609212.16345233907934
27105.3105.792543371155-0.492543371154899
28118.8113.5951643804825.20483561951772
29106.1110.077654515693-3.97765451569272
30109.3108.9797173385470.320282661453414
31117.2118.672757541408-1.47275754140807
3292.589.87200681204682.62799318795316
33104.2102.5069606134251.69303938657547
34112.5116.077798358938-3.57779835893824
35122.4117.8844036598524.51559634014761
36113.3110.1554707269903.14452927300966
37100101.489702705205-1.48970270520455
38110.7106.5798999150034.12010008499718
39112.8103.9551714833128.84482851668796
40109.8113.631798383320-3.83179838331952
41117.3113.1263376045624.17366239543843
42109.1108.7661647221650.333835277835293
43115.9115.8702406771360.0297593228638166
449697.2997642524604-1.29976425246039
4599.8101.467741331825-1.66774133182538
46116.8116.4950759374770.304924062523
47115.7118.53277830394-2.83277830394008
4899.4107.428313661422-8.02831366142187
4994.399.8164873833933-5.51648738339334
509196.2096568778546-5.20965687785457
5193.292.63035201767710.56964798232291
52103.1102.8315962944860.26840370551438
5394.194.6338341603851-0.533834160385132
5491.894.9476393678084-3.14763936780844
55102.7103.645759432825-0.945759432825444
5682.676.0465146106486.55348538935196
5789.187.0974871665372.00251283346307

\begin{tabular}{lllllllll}
\hline
Multiple Linear Regression - Actuals, Interpolation, and Residuals \tabularnewline
Time or Index & Actuals & InterpolationForecast & ResidualsPrediction Error \tabularnewline
1 & 101.6 & 99.320475772464 & 2.27952422753588 \tabularnewline
2 & 94.6 & 97.6211072144157 & -3.02110721441568 \tabularnewline
3 & 95.9 & 100.741156867006 & -4.84115686700567 \tabularnewline
4 & 104.7 & 109.908862099633 & -5.20886209963304 \tabularnewline
5 & 102.8 & 98.7192145119453 & 4.08078548805473 \tabularnewline
6 & 98.1 & 99.5614995911654 & -1.46149959116536 \tabularnewline
7 & 113.9 & 109.896336866748 & 4.00366313325251 \tabularnewline
8 & 80.9 & 86.2741154292514 & -5.3741154292514 \tabularnewline
9 & 95.7 & 95.512140351655 & 0.187859648344918 \tabularnewline
10 & 113.2 & 112.069515494952 & 1.13048450504796 \tabularnewline
11 & 105.9 & 110.081950047467 & -4.18195004746746 \tabularnewline
12 & 108.8 & 106.689290255058 & 2.11070974494150 \tabularnewline
13 & 102.3 & 97.6926545071304 & 4.60734549286965 \tabularnewline
14 & 99 & 97.0527883318063 & 1.94721166819372 \tabularnewline
15 & 100.7 & 104.780776260850 & -4.0807762608503 \tabularnewline
16 & 115.5 & 111.932578842080 & 3.56742115792044 \tabularnewline
17 & 100.7 & 104.442959207415 & -3.74295920741531 \tabularnewline
18 & 109.9 & 105.944978980315 & 3.95502101968509 \tabularnewline
19 & 114.6 & 116.214905481883 & -1.61490548188281 \tabularnewline
20 & 85.4 & 87.9075988955933 & -2.50759889559334 \tabularnewline
21 & 100.5 & 102.715670536558 & -2.21567053655809 \tabularnewline
22 & 114.8 & 112.657610208633 & 2.14238979136728 \tabularnewline
23 & 116.5 & 114.00086798874 & 2.49913201125992 \tabularnewline
24 & 112.9 & 110.126925356529 & 2.77307464347073 \tabularnewline
25 & 102 & 101.880679631808 & 0.119320368192365 \tabularnewline
26 & 106 & 103.836547660921 & 2.16345233907934 \tabularnewline
27 & 105.3 & 105.792543371155 & -0.492543371154899 \tabularnewline
28 & 118.8 & 113.595164380482 & 5.20483561951772 \tabularnewline
29 & 106.1 & 110.077654515693 & -3.97765451569272 \tabularnewline
30 & 109.3 & 108.979717338547 & 0.320282661453414 \tabularnewline
31 & 117.2 & 118.672757541408 & -1.47275754140807 \tabularnewline
32 & 92.5 & 89.8720068120468 & 2.62799318795316 \tabularnewline
33 & 104.2 & 102.506960613425 & 1.69303938657547 \tabularnewline
34 & 112.5 & 116.077798358938 & -3.57779835893824 \tabularnewline
35 & 122.4 & 117.884403659852 & 4.51559634014761 \tabularnewline
36 & 113.3 & 110.155470726990 & 3.14452927300966 \tabularnewline
37 & 100 & 101.489702705205 & -1.48970270520455 \tabularnewline
38 & 110.7 & 106.579899915003 & 4.12010008499718 \tabularnewline
39 & 112.8 & 103.955171483312 & 8.84482851668796 \tabularnewline
40 & 109.8 & 113.631798383320 & -3.83179838331952 \tabularnewline
41 & 117.3 & 113.126337604562 & 4.17366239543843 \tabularnewline
42 & 109.1 & 108.766164722165 & 0.333835277835293 \tabularnewline
43 & 115.9 & 115.870240677136 & 0.0297593228638166 \tabularnewline
44 & 96 & 97.2997642524604 & -1.29976425246039 \tabularnewline
45 & 99.8 & 101.467741331825 & -1.66774133182538 \tabularnewline
46 & 116.8 & 116.495075937477 & 0.304924062523 \tabularnewline
47 & 115.7 & 118.53277830394 & -2.83277830394008 \tabularnewline
48 & 99.4 & 107.428313661422 & -8.02831366142187 \tabularnewline
49 & 94.3 & 99.8164873833933 & -5.51648738339334 \tabularnewline
50 & 91 & 96.2096568778546 & -5.20965687785457 \tabularnewline
51 & 93.2 & 92.6303520176771 & 0.56964798232291 \tabularnewline
52 & 103.1 & 102.831596294486 & 0.26840370551438 \tabularnewline
53 & 94.1 & 94.6338341603851 & -0.533834160385132 \tabularnewline
54 & 91.8 & 94.9476393678084 & -3.14763936780844 \tabularnewline
55 & 102.7 & 103.645759432825 & -0.945759432825444 \tabularnewline
56 & 82.6 & 76.046514610648 & 6.55348538935196 \tabularnewline
57 & 89.1 & 87.097487166537 & 2.00251283346307 \tabularnewline
\hline
\end{tabular}
%Source: https://freestatistics.org/blog/index.php?pk=68398&T=4

[TABLE]
[ROW][C]Multiple Linear Regression - Actuals, Interpolation, and Residuals[/C][/ROW]
[ROW][C]Time or Index[/C][C]Actuals[/C][C]InterpolationForecast[/C][C]ResidualsPrediction Error[/C][/ROW]
[ROW][C]1[/C][C]101.6[/C][C]99.320475772464[/C][C]2.27952422753588[/C][/ROW]
[ROW][C]2[/C][C]94.6[/C][C]97.6211072144157[/C][C]-3.02110721441568[/C][/ROW]
[ROW][C]3[/C][C]95.9[/C][C]100.741156867006[/C][C]-4.84115686700567[/C][/ROW]
[ROW][C]4[/C][C]104.7[/C][C]109.908862099633[/C][C]-5.20886209963304[/C][/ROW]
[ROW][C]5[/C][C]102.8[/C][C]98.7192145119453[/C][C]4.08078548805473[/C][/ROW]
[ROW][C]6[/C][C]98.1[/C][C]99.5614995911654[/C][C]-1.46149959116536[/C][/ROW]
[ROW][C]7[/C][C]113.9[/C][C]109.896336866748[/C][C]4.00366313325251[/C][/ROW]
[ROW][C]8[/C][C]80.9[/C][C]86.2741154292514[/C][C]-5.3741154292514[/C][/ROW]
[ROW][C]9[/C][C]95.7[/C][C]95.512140351655[/C][C]0.187859648344918[/C][/ROW]
[ROW][C]10[/C][C]113.2[/C][C]112.069515494952[/C][C]1.13048450504796[/C][/ROW]
[ROW][C]11[/C][C]105.9[/C][C]110.081950047467[/C][C]-4.18195004746746[/C][/ROW]
[ROW][C]12[/C][C]108.8[/C][C]106.689290255058[/C][C]2.11070974494150[/C][/ROW]
[ROW][C]13[/C][C]102.3[/C][C]97.6926545071304[/C][C]4.60734549286965[/C][/ROW]
[ROW][C]14[/C][C]99[/C][C]97.0527883318063[/C][C]1.94721166819372[/C][/ROW]
[ROW][C]15[/C][C]100.7[/C][C]104.780776260850[/C][C]-4.0807762608503[/C][/ROW]
[ROW][C]16[/C][C]115.5[/C][C]111.932578842080[/C][C]3.56742115792044[/C][/ROW]
[ROW][C]17[/C][C]100.7[/C][C]104.442959207415[/C][C]-3.74295920741531[/C][/ROW]
[ROW][C]18[/C][C]109.9[/C][C]105.944978980315[/C][C]3.95502101968509[/C][/ROW]
[ROW][C]19[/C][C]114.6[/C][C]116.214905481883[/C][C]-1.61490548188281[/C][/ROW]
[ROW][C]20[/C][C]85.4[/C][C]87.9075988955933[/C][C]-2.50759889559334[/C][/ROW]
[ROW][C]21[/C][C]100.5[/C][C]102.715670536558[/C][C]-2.21567053655809[/C][/ROW]
[ROW][C]22[/C][C]114.8[/C][C]112.657610208633[/C][C]2.14238979136728[/C][/ROW]
[ROW][C]23[/C][C]116.5[/C][C]114.00086798874[/C][C]2.49913201125992[/C][/ROW]
[ROW][C]24[/C][C]112.9[/C][C]110.126925356529[/C][C]2.77307464347073[/C][/ROW]
[ROW][C]25[/C][C]102[/C][C]101.880679631808[/C][C]0.119320368192365[/C][/ROW]
[ROW][C]26[/C][C]106[/C][C]103.836547660921[/C][C]2.16345233907934[/C][/ROW]
[ROW][C]27[/C][C]105.3[/C][C]105.792543371155[/C][C]-0.492543371154899[/C][/ROW]
[ROW][C]28[/C][C]118.8[/C][C]113.595164380482[/C][C]5.20483561951772[/C][/ROW]
[ROW][C]29[/C][C]106.1[/C][C]110.077654515693[/C][C]-3.97765451569272[/C][/ROW]
[ROW][C]30[/C][C]109.3[/C][C]108.979717338547[/C][C]0.320282661453414[/C][/ROW]
[ROW][C]31[/C][C]117.2[/C][C]118.672757541408[/C][C]-1.47275754140807[/C][/ROW]
[ROW][C]32[/C][C]92.5[/C][C]89.8720068120468[/C][C]2.62799318795316[/C][/ROW]
[ROW][C]33[/C][C]104.2[/C][C]102.506960613425[/C][C]1.69303938657547[/C][/ROW]
[ROW][C]34[/C][C]112.5[/C][C]116.077798358938[/C][C]-3.57779835893824[/C][/ROW]
[ROW][C]35[/C][C]122.4[/C][C]117.884403659852[/C][C]4.51559634014761[/C][/ROW]
[ROW][C]36[/C][C]113.3[/C][C]110.155470726990[/C][C]3.14452927300966[/C][/ROW]
[ROW][C]37[/C][C]100[/C][C]101.489702705205[/C][C]-1.48970270520455[/C][/ROW]
[ROW][C]38[/C][C]110.7[/C][C]106.579899915003[/C][C]4.12010008499718[/C][/ROW]
[ROW][C]39[/C][C]112.8[/C][C]103.955171483312[/C][C]8.84482851668796[/C][/ROW]
[ROW][C]40[/C][C]109.8[/C][C]113.631798383320[/C][C]-3.83179838331952[/C][/ROW]
[ROW][C]41[/C][C]117.3[/C][C]113.126337604562[/C][C]4.17366239543843[/C][/ROW]
[ROW][C]42[/C][C]109.1[/C][C]108.766164722165[/C][C]0.333835277835293[/C][/ROW]
[ROW][C]43[/C][C]115.9[/C][C]115.870240677136[/C][C]0.0297593228638166[/C][/ROW]
[ROW][C]44[/C][C]96[/C][C]97.2997642524604[/C][C]-1.29976425246039[/C][/ROW]
[ROW][C]45[/C][C]99.8[/C][C]101.467741331825[/C][C]-1.66774133182538[/C][/ROW]
[ROW][C]46[/C][C]116.8[/C][C]116.495075937477[/C][C]0.304924062523[/C][/ROW]
[ROW][C]47[/C][C]115.7[/C][C]118.53277830394[/C][C]-2.83277830394008[/C][/ROW]
[ROW][C]48[/C][C]99.4[/C][C]107.428313661422[/C][C]-8.02831366142187[/C][/ROW]
[ROW][C]49[/C][C]94.3[/C][C]99.8164873833933[/C][C]-5.51648738339334[/C][/ROW]
[ROW][C]50[/C][C]91[/C][C]96.2096568778546[/C][C]-5.20965687785457[/C][/ROW]
[ROW][C]51[/C][C]93.2[/C][C]92.6303520176771[/C][C]0.56964798232291[/C][/ROW]
[ROW][C]52[/C][C]103.1[/C][C]102.831596294486[/C][C]0.26840370551438[/C][/ROW]
[ROW][C]53[/C][C]94.1[/C][C]94.6338341603851[/C][C]-0.533834160385132[/C][/ROW]
[ROW][C]54[/C][C]91.8[/C][C]94.9476393678084[/C][C]-3.14763936780844[/C][/ROW]
[ROW][C]55[/C][C]102.7[/C][C]103.645759432825[/C][C]-0.945759432825444[/C][/ROW]
[ROW][C]56[/C][C]82.6[/C][C]76.046514610648[/C][C]6.55348538935196[/C][/ROW]
[ROW][C]57[/C][C]89.1[/C][C]87.097487166537[/C][C]2.00251283346307[/C][/ROW]
[/TABLE]
Source: https://freestatistics.org/blog/index.php?pk=68398&T=4

Globally Unique Identifier (entire table): ba.freestatistics.org/blog/index.php?pk=68398&T=4

As an alternative you can also use a QR Code:  

The GUIDs for individual cells are displayed in the table below:

Multiple Linear Regression - Actuals, Interpolation, and Residuals
Time or IndexActualsInterpolationForecastResidualsPrediction Error
1101.699.3204757724642.27952422753588
294.697.6211072144157-3.02110721441568
395.9100.741156867006-4.84115686700567
4104.7109.908862099633-5.20886209963304
5102.898.71921451194534.08078548805473
698.199.5614995911654-1.46149959116536
7113.9109.8963368667484.00366313325251
880.986.2741154292514-5.3741154292514
995.795.5121403516550.187859648344918
10113.2112.0695154949521.13048450504796
11105.9110.081950047467-4.18195004746746
12108.8106.6892902550582.11070974494150
13102.397.69265450713044.60734549286965
149997.05278833180631.94721166819372
15100.7104.780776260850-4.0807762608503
16115.5111.9325788420803.56742115792044
17100.7104.442959207415-3.74295920741531
18109.9105.9449789803153.95502101968509
19114.6116.214905481883-1.61490548188281
2085.487.9075988955933-2.50759889559334
21100.5102.715670536558-2.21567053655809
22114.8112.6576102086332.14238979136728
23116.5114.000867988742.49913201125992
24112.9110.1269253565292.77307464347073
25102101.8806796318080.119320368192365
26106103.8365476609212.16345233907934
27105.3105.792543371155-0.492543371154899
28118.8113.5951643804825.20483561951772
29106.1110.077654515693-3.97765451569272
30109.3108.9797173385470.320282661453414
31117.2118.672757541408-1.47275754140807
3292.589.87200681204682.62799318795316
33104.2102.5069606134251.69303938657547
34112.5116.077798358938-3.57779835893824
35122.4117.8844036598524.51559634014761
36113.3110.1554707269903.14452927300966
37100101.489702705205-1.48970270520455
38110.7106.5798999150034.12010008499718
39112.8103.9551714833128.84482851668796
40109.8113.631798383320-3.83179838331952
41117.3113.1263376045624.17366239543843
42109.1108.7661647221650.333835277835293
43115.9115.8702406771360.0297593228638166
449697.2997642524604-1.29976425246039
4599.8101.467741331825-1.66774133182538
46116.8116.4950759374770.304924062523
47115.7118.53277830394-2.83277830394008
4899.4107.428313661422-8.02831366142187
4994.399.8164873833933-5.51648738339334
509196.2096568778546-5.20965687785457
5193.292.63035201767710.56964798232291
52103.1102.8315962944860.26840370551438
5394.194.6338341603851-0.533834160385132
5491.894.9476393678084-3.14763936780844
55102.7103.645759432825-0.945759432825444
5682.676.0465146106486.55348538935196
5789.187.0974871665372.00251283346307


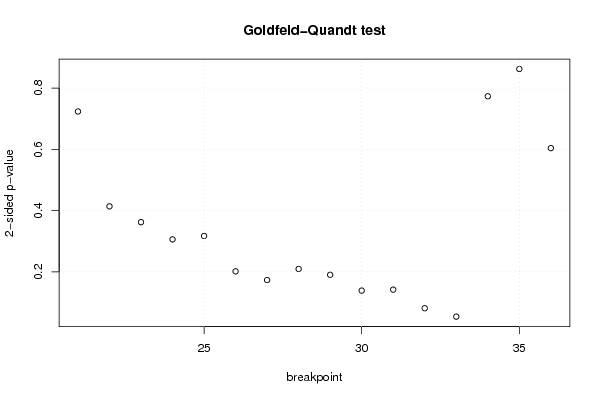
Goldfeld-Quandt test for Heteroskedasticity
p-valuesAlternative Hypothesis
breakpoint indexgreater2-sidedless
210.361796195304230.723592390608460.63820380469577
220.2069390838643560.4138781677287110.793060916135644
230.1811225178688970.3622450357377930.818877482131103
240.1529816806287580.3059633612575170.847018319371242
250.1585778930262110.3171557860524230.841422106973789
260.1008317391418170.2016634782836340.899168260858183
270.08659480306153520.1731896061230700.913405196938465
280.1047146912159490.2094293824318980.895285308784051
290.09520499130450440.1904099826090090.904795008695496
300.06936422168660150.1387284433732030.930635778313398
310.07091530847805330.1418306169561070.929084691521947
320.04057599807679490.08115199615358980.959424001923205
330.02684040906709410.05368081813418820.973159590932906
340.3865992059216360.7731984118432710.613400794078364
350.4312383479232330.8624766958464650.568761652076767
360.3019171665804820.6038343331609630.698082833419518

\begin{tabular}{lllllllll}
\hline
Goldfeld-Quandt test for Heteroskedasticity \tabularnewline
p-values & Alternative Hypothesis \tabularnewline
breakpoint index & greater & 2-sided & less \tabularnewline
21 & 0.36179619530423 & 0.72359239060846 & 0.63820380469577 \tabularnewline
22 & 0.206939083864356 & 0.413878167728711 & 0.793060916135644 \tabularnewline
23 & 0.181122517868897 & 0.362245035737793 & 0.818877482131103 \tabularnewline
24 & 0.152981680628758 & 0.305963361257517 & 0.847018319371242 \tabularnewline
25 & 0.158577893026211 & 0.317155786052423 & 0.841422106973789 \tabularnewline
26 & 0.100831739141817 & 0.201663478283634 & 0.899168260858183 \tabularnewline
27 & 0.0865948030615352 & 0.173189606123070 & 0.913405196938465 \tabularnewline
28 & 0.104714691215949 & 0.209429382431898 & 0.895285308784051 \tabularnewline
29 & 0.0952049913045044 & 0.190409982609009 & 0.904795008695496 \tabularnewline
30 & 0.0693642216866015 & 0.138728443373203 & 0.930635778313398 \tabularnewline
31 & 0.0709153084780533 & 0.141830616956107 & 0.929084691521947 \tabularnewline
32 & 0.0405759980767949 & 0.0811519961535898 & 0.959424001923205 \tabularnewline
33 & 0.0268404090670941 & 0.0536808181341882 & 0.973159590932906 \tabularnewline
34 & 0.386599205921636 & 0.773198411843271 & 0.613400794078364 \tabularnewline
35 & 0.431238347923233 & 0.862476695846465 & 0.568761652076767 \tabularnewline
36 & 0.301917166580482 & 0.603834333160963 & 0.698082833419518 \tabularnewline
\hline
\end{tabular}
%Source: https://freestatistics.org/blog/index.php?pk=68398&T=5

[TABLE]
[ROW][C]Goldfeld-Quandt test for Heteroskedasticity[/C][/ROW]
[ROW][C]p-values[/C][C]Alternative Hypothesis[/C][/ROW]
[ROW][C]breakpoint index[/C][C]greater[/C][C]2-sided[/C][C]less[/C][/ROW]
[ROW][C]21[/C][C]0.36179619530423[/C][C]0.72359239060846[/C][C]0.63820380469577[/C][/ROW]
[ROW][C]22[/C][C]0.206939083864356[/C][C]0.413878167728711[/C][C]0.793060916135644[/C][/ROW]
[ROW][C]23[/C][C]0.181122517868897[/C][C]0.362245035737793[/C][C]0.818877482131103[/C][/ROW]
[ROW][C]24[/C][C]0.152981680628758[/C][C]0.305963361257517[/C][C]0.847018319371242[/C][/ROW]
[ROW][C]25[/C][C]0.158577893026211[/C][C]0.317155786052423[/C][C]0.841422106973789[/C][/ROW]
[ROW][C]26[/C][C]0.100831739141817[/C][C]0.201663478283634[/C][C]0.899168260858183[/C][/ROW]
[ROW][C]27[/C][C]0.0865948030615352[/C][C]0.173189606123070[/C][C]0.913405196938465[/C][/ROW]
[ROW][C]28[/C][C]0.104714691215949[/C][C]0.209429382431898[/C][C]0.895285308784051[/C][/ROW]
[ROW][C]29[/C][C]0.0952049913045044[/C][C]0.190409982609009[/C][C]0.904795008695496[/C][/ROW]
[ROW][C]30[/C][C]0.0693642216866015[/C][C]0.138728443373203[/C][C]0.930635778313398[/C][/ROW]
[ROW][C]31[/C][C]0.0709153084780533[/C][C]0.141830616956107[/C][C]0.929084691521947[/C][/ROW]
[ROW][C]32[/C][C]0.0405759980767949[/C][C]0.0811519961535898[/C][C]0.959424001923205[/C][/ROW]
[ROW][C]33[/C][C]0.0268404090670941[/C][C]0.0536808181341882[/C][C]0.973159590932906[/C][/ROW]
[ROW][C]34[/C][C]0.386599205921636[/C][C]0.773198411843271[/C][C]0.613400794078364[/C][/ROW]
[ROW][C]35[/C][C]0.431238347923233[/C][C]0.862476695846465[/C][C]0.568761652076767[/C][/ROW]
[ROW][C]36[/C][C]0.301917166580482[/C][C]0.603834333160963[/C][C]0.698082833419518[/C][/ROW]
[/TABLE]
Source: https://freestatistics.org/blog/index.php?pk=68398&T=5

Globally Unique Identifier (entire table): ba.freestatistics.org/blog/index.php?pk=68398&T=5

As an alternative you can also use a QR Code:  

The GUIDs for individual cells are displayed in the table below:

Goldfeld-Quandt test for Heteroskedasticity
p-valuesAlternative Hypothesis
breakpoint indexgreater2-sidedless
210.361796195304230.723592390608460.63820380469577
220.2069390838643560.4138781677287110.793060916135644
230.1811225178688970.3622450357377930.818877482131103
240.1529816806287580.3059633612575170.847018319371242
250.1585778930262110.3171557860524230.841422106973789
260.1008317391418170.2016634782836340.899168260858183
270.08659480306153520.1731896061230700.913405196938465
280.1047146912159490.2094293824318980.895285308784051
290.09520499130450440.1904099826090090.904795008695496
300.06936422168660150.1387284433732030.930635778313398
310.07091530847805330.1418306169561070.929084691521947
320.04057599807679490.08115199615358980.959424001923205
330.02684040906709410.05368081813418820.973159590932906
340.3865992059216360.7731984118432710.613400794078364
350.4312383479232330.8624766958464650.568761652076767
360.3019171665804820.6038343331609630.698082833419518


Meta Analysis of Goldfeld-Quandt test for Heteroskedasticity
Description# significant tests% significant testsOK/NOK
1% type I error level00OK
5% type I error level00OK
10% type I error level20.125NOK

\begin{tabular}{lllllllll}
\hline
Meta Analysis of Goldfeld-Quandt test for Heteroskedasticity \tabularnewline
Description & # significant tests & % significant tests & OK/NOK \tabularnewline
1% type I error level & 0 & 0 & OK \tabularnewline
5% type I error level & 0 & 0 & OK \tabularnewline
10% type I error level & 2 & 0.125 & NOK \tabularnewline
\hline
\end{tabular}
%Source: https://freestatistics.org/blog/index.php?pk=68398&T=6

[TABLE]
[ROW][C]Meta Analysis of Goldfeld-Quandt test for Heteroskedasticity[/C][/ROW]
[ROW][C]Description[/C][C]# significant tests[/C][C]% significant tests[/C][C]OK/NOK[/C][/ROW]
[ROW][C]1% type I error level[/C][C]0[/C][C]0[/C][C]OK[/C][/ROW]
[ROW][C]5% type I error level[/C][C]0[/C][C]0[/C][C]OK[/C][/ROW]
[ROW][C]10% type I error level[/C][C]2[/C][C]0.125[/C][C]NOK[/C][/ROW]
[/TABLE]
Source: https://freestatistics.org/blog/index.php?pk=68398&T=6

Globally Unique Identifier (entire table): ba.freestatistics.org/blog/index.php?pk=68398&T=6

As an alternative you can also use a QR Code:  

The GUIDs for individual cells are displayed in the table below:

Meta Analysis of Goldfeld-Quandt test for Heteroskedasticity
Description# significant tests% significant testsOK/NOK
1% type I error level00OK
5% type I error level00OK
10% type I error level20.125NOK


Parameters (Session):
par1 = 1 ; par2 = Include Monthly Dummies ; par3 = Linear Trend ;
Parameters (R input):
par1 = 1 ; par2 = Include Monthly Dummies ; par3 = Linear Trend ;
R code (references can be found in the software module):
library(lattice)
library(lmtest)
n25 <- 25 #minimum number of obs. for Goldfeld-Quandt test
par1 <- as.numeric(par1)
x <- t(y)
k <- length(x[1,])
n <- length(x[,1])
x1 <- cbind(x[,par1], x[,1:k!=par1])
mycolnames <- c(colnames(x)[par1], colnames(x)[1:k!=par1])
colnames(x1) <- mycolnames #colnames(x)[par1]
x <- x1
if (par3 == 'First Differences'){
x2 <- array(0, dim=c(n-1,k), dimnames=list(1:(n-1), paste('(1-B)',colnames(x),sep='')))
for (i in 1:n-1) {
for (j in 1:k) {
x2[i,j] <- x[i+1,j] - x[i,j]
}
}
x <- x2
}
if (par2 == 'Include Monthly Dummies'){
x2 <- array(0, dim=c(n,11), dimnames=list(1:n, paste('M', seq(1:11), sep ='')))
for (i in 1:11){
x2[seq(i,n,12),i] <- 1
}
x <- cbind(x, x2)
}
if (par2 == 'Include Quarterly Dummies'){
x2 <- array(0, dim=c(n,3), dimnames=list(1:n, paste('Q', seq(1:3), sep ='')))
for (i in 1:3){
x2[seq(i,n,4),i] <- 1
}
x <- cbind(x, x2)
}
k <- length(x[1,])
if (par3 == 'Linear Trend'){
x <- cbind(x, c(1:n))
colnames(x)[k+1] <- 't'
}
x
k <- length(x[1,])
df <- as.data.frame(x)
(mylm <- lm(df))
(mysum <- summary(mylm))
if (n > n25) {
kp3 <- k + 3
nmkm3 <- n - k - 3
gqarr <- array(NA, dim=c(nmkm3-kp3+1,3))
numgqtests <- 0
numsignificant1 <- 0
numsignificant5 <- 0
numsignificant10 <- 0
for (mypoint in kp3:nmkm3) {
j <- 0
numgqtests <- numgqtests + 1
for (myalt in c('greater', 'two.sided', 'less')) {
j <- j + 1
gqarr[mypoint-kp3+1,j] <- gqtest(mylm, point=mypoint, alternative=myalt)$p.value
}
if (gqarr[mypoint-kp3+1,2] < 0.01) numsignificant1 <- numsignificant1 + 1
if (gqarr[mypoint-kp3+1,2] < 0.05) numsignificant5 <- numsignificant5 + 1
if (gqarr[mypoint-kp3+1,2] < 0.10) numsignificant10 <- numsignificant10 + 1
}
gqarr
}
bitmap(file='test0.png')
plot(x[,1], type='l', main='Actuals and Interpolation', ylab='value of Actuals and Interpolation (dots)', xlab='time or index')
points(x[,1]-mysum$resid)
grid()
dev.off()
bitmap(file='test1.png')
plot(mysum$resid, type='b', pch=19, main='Residuals', ylab='value of Residuals', xlab='time or index')
grid()
dev.off()
bitmap(file='test2.png')
hist(mysum$resid, main='Residual Histogram', xlab='values of Residuals')
grid()
dev.off()
bitmap(file='test3.png')
densityplot(~mysum$resid,col='black',main='Residual Density Plot', xlab='values of Residuals')
dev.off()
bitmap(file='test4.png')
qqnorm(mysum$resid, main='Residual Normal Q-Q Plot')
qqline(mysum$resid)
grid()
dev.off()
(myerror <- as.ts(mysum$resid))
bitmap(file='test5.png')
dum <- cbind(lag(myerror,k=1),myerror)
dum
dum1 <- dum[2:length(myerror),]
dum1
z <- as.data.frame(dum1)
z
plot(z,main=paste('Residual Lag plot, lowess, and regression line'), ylab='values of Residuals', xlab='lagged values of Residuals')
lines(lowess(z))
abline(lm(z))
grid()
dev.off()
bitmap(file='test6.png')
acf(mysum$resid, lag.max=length(mysum$resid)/2, main='Residual Autocorrelation Function')
grid()
dev.off()
bitmap(file='test7.png')
pacf(mysum$resid, lag.max=length(mysum$resid)/2, main='Residual Partial Autocorrelation Function')
grid()
dev.off()
bitmap(file='test8.png')
opar <- par(mfrow = c(2,2), oma = c(0, 0, 1.1, 0))
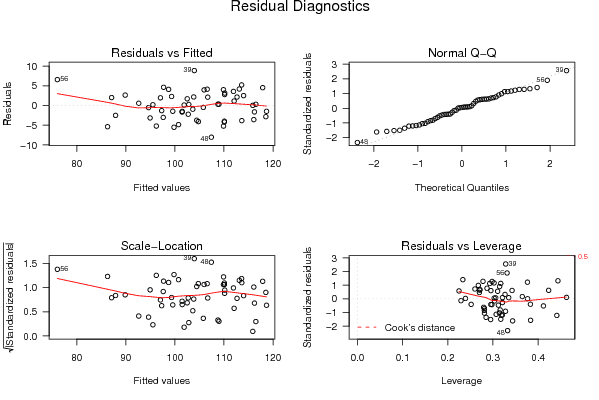
plot(mylm, las = 1, sub='Residual Diagnostics')
par(opar)
dev.off()
if (n > n25) {
bitmap(file='test9.png')
plot(kp3:nmkm3,gqarr[,2], main='Goldfeld-Quandt test',ylab='2-sided p-value',xlab='breakpoint')
grid()
dev.off()
}
load(file='createtable')
a<-table.start()
a<-table.row.start(a)
a<-table.element(a, 'Multiple Linear Regression - Estimated Regression Equation', 1, TRUE)
a<-table.row.end(a)
myeq <- colnames(x)[1]
myeq <- paste(myeq, '[t] = ', sep='')
for (i in 1:k){
if (mysum$coefficients[i,1] > 0) myeq <- paste(myeq, '+', '')
myeq <- paste(myeq, mysum$coefficients[i,1], sep=' ')
if (rownames(mysum$coefficients)[i] != '(Intercept)') {
myeq <- paste(myeq, rownames(mysum$coefficients)[i], sep='')
if (rownames(mysum$coefficients)[i] != 't') myeq <- paste(myeq, '[t]', sep='')
}
}
myeq <- paste(myeq, ' + e[t]')
a<-table.row.start(a)
a<-table.element(a, myeq)
a<-table.row.end(a)
a<-table.end(a)
table.save(a,file='mytable1.tab')
a<-table.start()
a<-table.row.start(a)
a<-table.element(a,hyperlink('ols1.htm','Multiple Linear Regression - Ordinary Least Squares',''), 6, TRUE)
a<-table.row.end(a)
a<-table.row.start(a)
a<-table.element(a,'Variable',header=TRUE)
a<-table.element(a,'Parameter',header=TRUE)
a<-table.element(a,'S.D.',header=TRUE)
a<-table.element(a,'T-STAT
H0: parameter = 0',header=TRUE)
a<-table.element(a,'2-tail p-value',header=TRUE)
a<-table.element(a,'1-tail p-value',header=TRUE)
a<-table.row.end(a)
for (i in 1:k){
a<-table.row.start(a)
a<-table.element(a,rownames(mysum$coefficients)[i],header=TRUE)
a<-table.element(a,mysum$coefficients[i,1])
a<-table.element(a, round(mysum$coefficients[i,2],6))
a<-table.element(a, round(mysum$coefficients[i,3],4))
a<-table.element(a, round(mysum$coefficients[i,4],6))
a<-table.element(a, round(mysum$coefficients[i,4]/2,6))
a<-table.row.end(a)
}
a<-table.end(a)
table.save(a,file='mytable2.tab')
a<-table.start()
a<-table.row.start(a)
a<-table.element(a, 'Multiple Linear Regression - Regression Statistics', 2, TRUE)
a<-table.row.end(a)
a<-table.row.start(a)
a<-table.element(a, 'Multiple R',1,TRUE)
a<-table.element(a, sqrt(mysum$r.squared))
a<-table.row.end(a)
a<-table.row.start(a)
a<-table.element(a, 'R-squared',1,TRUE)
a<-table.element(a, mysum$r.squared)
a<-table.row.end(a)
a<-table.row.start(a)
a<-table.element(a, 'Adjusted R-squared',1,TRUE)
a<-table.element(a, mysum$adj.r.squared)
a<-table.row.end(a)
a<-table.row.start(a)
a<-table.element(a, 'F-TEST (value)',1,TRUE)
a<-table.element(a, mysum$fstatistic[1])
a<-table.row.end(a)
a<-table.row.start(a)
a<-table.element(a, 'F-TEST (DF numerator)',1,TRUE)
a<-table.element(a, mysum$fstatistic[2])
a<-table.row.end(a)
a<-table.row.start(a)
a<-table.element(a, 'F-TEST (DF denominator)',1,TRUE)
a<-table.element(a, mysum$fstatistic[3])
a<-table.row.end(a)
a<-table.row.start(a)
a<-table.element(a, 'p-value',1,TRUE)
a<-table.element(a, 1-pf(mysum$fstatistic[1],mysum$fstatistic[2],mysum$fstatistic[3]))
a<-table.row.end(a)
a<-table.row.start(a)
a<-table.element(a, 'Multiple Linear Regression - Residual Statistics', 2, TRUE)
a<-table.row.end(a)
a<-table.row.start(a)
a<-table.element(a, 'Residual Standard Deviation',1,TRUE)
a<-table.element(a, mysum$sigma)
a<-table.row.end(a)
a<-table.row.start(a)
a<-table.element(a, 'Sum Squared Residuals',1,TRUE)
a<-table.element(a, sum(myerror*myerror))
a<-table.row.end(a)
a<-table.end(a)
table.save(a,file='mytable3.tab')
a<-table.start()
a<-table.row.start(a)
a<-table.element(a, 'Multiple Linear Regression - Actuals, Interpolation, and Residuals', 4, TRUE)
a<-table.row.end(a)
a<-table.row.start(a)
a<-table.element(a, 'Time or Index', 1, TRUE)
a<-table.element(a, 'Actuals', 1, TRUE)
a<-table.element(a, 'Interpolation
Forecast', 1, TRUE)
a<-table.element(a, 'Residuals
Prediction Error', 1, TRUE)
a<-table.row.end(a)
for (i in 1:n) {
a<-table.row.start(a)
a<-table.element(a,i, 1, TRUE)
a<-table.element(a,x[i])
a<-table.element(a,x[i]-mysum$resid[i])
a<-table.element(a,mysum$resid[i])
a<-table.row.end(a)
}
a<-table.end(a)
table.save(a,file='mytable4.tab')
if (n > n25) {
a<-table.start()
a<-table.row.start(a)
a<-table.element(a,'Goldfeld-Quandt test for Heteroskedasticity',4,TRUE)
a<-table.row.end(a)
a<-table.row.start(a)
a<-table.element(a,'p-values',header=TRUE)
a<-table.element(a,'Alternative Hypothesis',3,header=TRUE)
a<-table.row.end(a)
a<-table.row.start(a)
a<-table.element(a,'breakpoint index',header=TRUE)
a<-table.element(a,'greater',header=TRUE)
a<-table.element(a,'2-sided',header=TRUE)
a<-table.element(a,'less',header=TRUE)
a<-table.row.end(a)
for (mypoint in kp3:nmkm3) {
a<-table.row.start(a)
a<-table.element(a,mypoint,header=TRUE)
a<-table.element(a,gqarr[mypoint-kp3+1,1])
a<-table.element(a,gqarr[mypoint-kp3+1,2])
a<-table.element(a,gqarr[mypoint-kp3+1,3])
a<-table.row.end(a)
}
a<-table.end(a)
table.save(a,file='mytable5.tab')
a<-table.start()
a<-table.row.start(a)
a<-table.element(a,'Meta Analysis of Goldfeld-Quandt test for Heteroskedasticity',4,TRUE)
a<-table.row.end(a)
a<-table.row.start(a)
a<-table.element(a,'Description',header=TRUE)
a<-table.element(a,'# significant tests',header=TRUE)
a<-table.element(a,'% significant tests',header=TRUE)
a<-table.element(a,'OK/NOK',header=TRUE)
a<-table.row.end(a)
a<-table.row.start(a)
a<-table.element(a,'1% type I error level',header=TRUE)
a<-table.element(a,numsignificant1)
a<-table.element(a,numsignificant1/numgqtests)
if (numsignificant1/numgqtests < 0.01) dum <- 'OK' else dum <- 'NOK'
a<-table.element(a,dum)
a<-table.row.end(a)
a<-table.row.start(a)
a<-table.element(a,'5% type I error level',header=TRUE)
a<-table.element(a,numsignificant5)
a<-table.element(a,numsignificant5/numgqtests)
if (numsignificant5/numgqtests < 0.05) dum <- 'OK' else dum <- 'NOK'
a<-table.element(a,dum)
a<-table.row.end(a)
a<-table.row.start(a)
a<-table.element(a,'10% type I error level',header=TRUE)
a<-table.element(a,numsignificant10)
a<-table.element(a,numsignificant10/numgqtests)
if (numsignificant10/numgqtests < 0.1) dum <- 'OK' else dum <- 'NOK'
a<-table.element(a,dum)
a<-table.row.end(a)
a<-table.end(a)
table.save(a,file='mytable6.tab')
}