Free Statistics

of Irreproducible Research!

Author's title

Author*The author of this computation has been verified*
R Software Modulerwasp_autocorrelation.wasp
Title produced by software(Partial) Autocorrelation Function
Date of computationWed, 16 Dec 2009 07:56:55 -0700
Cite this page as followsStatistical Computations at FreeStatistics.org, Office for Research Development and Education, URL https://freestatistics.org/blog/index.php?v=date/2009/Dec/16/t1260975531xnbg4qfw9reycwl.htm/, Retrieved Tue, 30 Apr 2024 09:08:02 +0000
Statistical Computations at FreeStatistics.org, Office for Research Development and Education, URL https://freestatistics.org/blog/index.php?pk=68395, Retrieved Tue, 30 Apr 2024 09:08:02 +0000
QR Codes:

Original text written by user:
IsPrivate?No (this computation is public)
User-defined keywords
Estimated Impact114
Family? (F = Feedback message, R = changed R code, M = changed R Module, P = changed Parameters, D = changed Data)
-     [(Partial) Autocorrelation Function] [] [2009-11-25 10:24:38] [3daae06e609b839af47edc9c5015e41f]
- R  D    [(Partial) Autocorrelation Function] [] [2009-12-16 14:56:55] [21503129a47c64de7f80e1fde84c3a45] [Current]
Feedback Forum

Post a new message
Dataseries X:
98,8
100,5
110,4
96,4
101,9
106,2
81
94,7
101
109,4
102,3
90,7
96,2
96,1
106
103,1
102
104,7
86
92,1
106,9
112,6
101,7
92
97,4
97
105,4
102,7
98,1
104,5
87,4
89,9
109,8
111,7
98,6
96,9
95,1
97
112,7
102,9
97,4
111,4
87,4
96,8
114,1
110,3
103,9
101,6
94,6
95,9
104,7
102,8
98,1
113,9
80,9
95,7
113,2
105,9
108,8
102,3


Summary of computational transaction
Raw Inputview raw input (R code)
Raw Outputview raw output of R engine
Computing time1 seconds
R Server'Gwilym Jenkins' @ 72.249.127.135

\begin{tabular}{lllllllll}
\hline
Summary of computational transaction \tabularnewline
Raw Input & view raw input (R code)  \tabularnewline
Raw Output & view raw output of R engine  \tabularnewline
Computing time & 1 seconds \tabularnewline
R Server & 'Gwilym Jenkins' @ 72.249.127.135 \tabularnewline
\hline
\end{tabular}
%Source: https://freestatistics.org/blog/index.php?pk=68395&T=0

[TABLE]
[ROW][C]Summary of computational transaction[/C][/ROW]
[ROW][C]Raw Input[/C][C]view raw input (R code) [/C][/ROW]
[ROW][C]Raw Output[/C][C]view raw output of R engine [/C][/ROW]
[ROW][C]Computing time[/C][C]1 seconds[/C][/ROW]
[ROW][C]R Server[/C][C]'Gwilym Jenkins' @ 72.249.127.135[/C][/ROW]
[/TABLE]
Source: https://freestatistics.org/blog/index.php?pk=68395&T=0

Globally Unique Identifier (entire table): ba.freestatistics.org/blog/index.php?pk=68395&T=0

As an alternative you can also use a QR Code:  

The GUIDs for individual cells are displayed in the table below:

Summary of computational transaction
Raw Inputview raw input (R code)
Raw Outputview raw output of R engine
Computing time1 seconds
R Server'Gwilym Jenkins' @ 72.249.127.135


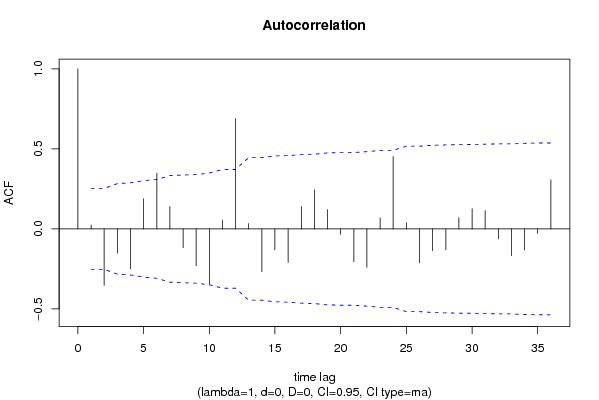
Autocorrelation Function
Time lag kACF(k)T-STATP-value
10.0235920.18270.427807
2-0.353301-2.73670.004077
3-0.151546-1.17390.122542
4-0.248923-1.92820.029286
50.1879741.4560.075297
60.3481662.69690.004536
70.1398521.08330.141508
8-0.117319-0.90870.18356
9-0.231096-1.79010.039245
10-0.347579-2.69230.004591
110.0552260.42780.335172
120.6887865.33531e-06
130.0333820.25860.398423
14-0.267261-2.07020.021373
15-0.131077-1.01530.157015
16-0.209482-1.62260.054955
170.1399391.0840.141359
180.2443151.89250.031629
190.1211130.93810.175967
20-0.034028-0.26360.396504
21-0.206141-1.59680.057787
22-0.240515-1.8630.033678
230.0682840.52890.299405
240.4525793.50570.000434
250.0381750.29570.384239
26-0.211923-1.64150.052958
27-0.136578-1.05790.147165
28-0.13071-1.01250.157689
290.070170.54350.294388
300.126630.98090.165297
310.1145330.88720.189265
32-0.063031-0.48820.313582
33-0.167792-1.29970.099335
34-0.132562-1.02680.154313
35-0.027799-0.21530.41512
360.3066712.37550.010369

\begin{tabular}{lllllllll}
\hline
Autocorrelation Function \tabularnewline
Time lag k & ACF(k) & T-STAT & P-value \tabularnewline
1 & 0.023592 & 0.1827 & 0.427807 \tabularnewline
2 & -0.353301 & -2.7367 & 0.004077 \tabularnewline
3 & -0.151546 & -1.1739 & 0.122542 \tabularnewline
4 & -0.248923 & -1.9282 & 0.029286 \tabularnewline
5 & 0.187974 & 1.456 & 0.075297 \tabularnewline
6 & 0.348166 & 2.6969 & 0.004536 \tabularnewline
7 & 0.139852 & 1.0833 & 0.141508 \tabularnewline
8 & -0.117319 & -0.9087 & 0.18356 \tabularnewline
9 & -0.231096 & -1.7901 & 0.039245 \tabularnewline
10 & -0.347579 & -2.6923 & 0.004591 \tabularnewline
11 & 0.055226 & 0.4278 & 0.335172 \tabularnewline
12 & 0.688786 & 5.3353 & 1e-06 \tabularnewline
13 & 0.033382 & 0.2586 & 0.398423 \tabularnewline
14 & -0.267261 & -2.0702 & 0.021373 \tabularnewline
15 & -0.131077 & -1.0153 & 0.157015 \tabularnewline
16 & -0.209482 & -1.6226 & 0.054955 \tabularnewline
17 & 0.139939 & 1.084 & 0.141359 \tabularnewline
18 & 0.244315 & 1.8925 & 0.031629 \tabularnewline
19 & 0.121113 & 0.9381 & 0.175967 \tabularnewline
20 & -0.034028 & -0.2636 & 0.396504 \tabularnewline
21 & -0.206141 & -1.5968 & 0.057787 \tabularnewline
22 & -0.240515 & -1.863 & 0.033678 \tabularnewline
23 & 0.068284 & 0.5289 & 0.299405 \tabularnewline
24 & 0.452579 & 3.5057 & 0.000434 \tabularnewline
25 & 0.038175 & 0.2957 & 0.384239 \tabularnewline
26 & -0.211923 & -1.6415 & 0.052958 \tabularnewline
27 & -0.136578 & -1.0579 & 0.147165 \tabularnewline
28 & -0.13071 & -1.0125 & 0.157689 \tabularnewline
29 & 0.07017 & 0.5435 & 0.294388 \tabularnewline
30 & 0.12663 & 0.9809 & 0.165297 \tabularnewline
31 & 0.114533 & 0.8872 & 0.189265 \tabularnewline
32 & -0.063031 & -0.4882 & 0.313582 \tabularnewline
33 & -0.167792 & -1.2997 & 0.099335 \tabularnewline
34 & -0.132562 & -1.0268 & 0.154313 \tabularnewline
35 & -0.027799 & -0.2153 & 0.41512 \tabularnewline
36 & 0.306671 & 2.3755 & 0.010369 \tabularnewline
\hline
\end{tabular}
%Source: https://freestatistics.org/blog/index.php?pk=68395&T=1

[TABLE]
[ROW][C]Autocorrelation Function[/C][/ROW]
[ROW][C]Time lag k[/C][C]ACF(k)[/C][C]T-STAT[/C][C]P-value[/C][/ROW]
[ROW][C]1[/C][C]0.023592[/C][C]0.1827[/C][C]0.427807[/C][/ROW]
[ROW][C]2[/C][C]-0.353301[/C][C]-2.7367[/C][C]0.004077[/C][/ROW]
[ROW][C]3[/C][C]-0.151546[/C][C]-1.1739[/C][C]0.122542[/C][/ROW]
[ROW][C]4[/C][C]-0.248923[/C][C]-1.9282[/C][C]0.029286[/C][/ROW]
[ROW][C]5[/C][C]0.187974[/C][C]1.456[/C][C]0.075297[/C][/ROW]
[ROW][C]6[/C][C]0.348166[/C][C]2.6969[/C][C]0.004536[/C][/ROW]
[ROW][C]7[/C][C]0.139852[/C][C]1.0833[/C][C]0.141508[/C][/ROW]
[ROW][C]8[/C][C]-0.117319[/C][C]-0.9087[/C][C]0.18356[/C][/ROW]
[ROW][C]9[/C][C]-0.231096[/C][C]-1.7901[/C][C]0.039245[/C][/ROW]
[ROW][C]10[/C][C]-0.347579[/C][C]-2.6923[/C][C]0.004591[/C][/ROW]
[ROW][C]11[/C][C]0.055226[/C][C]0.4278[/C][C]0.335172[/C][/ROW]
[ROW][C]12[/C][C]0.688786[/C][C]5.3353[/C][C]1e-06[/C][/ROW]
[ROW][C]13[/C][C]0.033382[/C][C]0.2586[/C][C]0.398423[/C][/ROW]
[ROW][C]14[/C][C]-0.267261[/C][C]-2.0702[/C][C]0.021373[/C][/ROW]
[ROW][C]15[/C][C]-0.131077[/C][C]-1.0153[/C][C]0.157015[/C][/ROW]
[ROW][C]16[/C][C]-0.209482[/C][C]-1.6226[/C][C]0.054955[/C][/ROW]
[ROW][C]17[/C][C]0.139939[/C][C]1.084[/C][C]0.141359[/C][/ROW]
[ROW][C]18[/C][C]0.244315[/C][C]1.8925[/C][C]0.031629[/C][/ROW]
[ROW][C]19[/C][C]0.121113[/C][C]0.9381[/C][C]0.175967[/C][/ROW]
[ROW][C]20[/C][C]-0.034028[/C][C]-0.2636[/C][C]0.396504[/C][/ROW]
[ROW][C]21[/C][C]-0.206141[/C][C]-1.5968[/C][C]0.057787[/C][/ROW]
[ROW][C]22[/C][C]-0.240515[/C][C]-1.863[/C][C]0.033678[/C][/ROW]
[ROW][C]23[/C][C]0.068284[/C][C]0.5289[/C][C]0.299405[/C][/ROW]
[ROW][C]24[/C][C]0.452579[/C][C]3.5057[/C][C]0.000434[/C][/ROW]
[ROW][C]25[/C][C]0.038175[/C][C]0.2957[/C][C]0.384239[/C][/ROW]
[ROW][C]26[/C][C]-0.211923[/C][C]-1.6415[/C][C]0.052958[/C][/ROW]
[ROW][C]27[/C][C]-0.136578[/C][C]-1.0579[/C][C]0.147165[/C][/ROW]
[ROW][C]28[/C][C]-0.13071[/C][C]-1.0125[/C][C]0.157689[/C][/ROW]
[ROW][C]29[/C][C]0.07017[/C][C]0.5435[/C][C]0.294388[/C][/ROW]
[ROW][C]30[/C][C]0.12663[/C][C]0.9809[/C][C]0.165297[/C][/ROW]
[ROW][C]31[/C][C]0.114533[/C][C]0.8872[/C][C]0.189265[/C][/ROW]
[ROW][C]32[/C][C]-0.063031[/C][C]-0.4882[/C][C]0.313582[/C][/ROW]
[ROW][C]33[/C][C]-0.167792[/C][C]-1.2997[/C][C]0.099335[/C][/ROW]
[ROW][C]34[/C][C]-0.132562[/C][C]-1.0268[/C][C]0.154313[/C][/ROW]
[ROW][C]35[/C][C]-0.027799[/C][C]-0.2153[/C][C]0.41512[/C][/ROW]
[ROW][C]36[/C][C]0.306671[/C][C]2.3755[/C][C]0.010369[/C][/ROW]
[/TABLE]
Source: https://freestatistics.org/blog/index.php?pk=68395&T=1

Globally Unique Identifier (entire table): ba.freestatistics.org/blog/index.php?pk=68395&T=1

As an alternative you can also use a QR Code:  

The GUIDs for individual cells are displayed in the table below:

Autocorrelation Function
Time lag kACF(k)T-STATP-value
10.0235920.18270.427807
2-0.353301-2.73670.004077
3-0.151546-1.17390.122542
4-0.248923-1.92820.029286
50.1879741.4560.075297
60.3481662.69690.004536
70.1398521.08330.141508
8-0.117319-0.90870.18356
9-0.231096-1.79010.039245
10-0.347579-2.69230.004591
110.0552260.42780.335172
120.6887865.33531e-06
130.0333820.25860.398423
14-0.267261-2.07020.021373
15-0.131077-1.01530.157015
16-0.209482-1.62260.054955
170.1399391.0840.141359
180.2443151.89250.031629
190.1211130.93810.175967
20-0.034028-0.26360.396504
21-0.206141-1.59680.057787
22-0.240515-1.8630.033678
230.0682840.52890.299405
240.4525793.50570.000434
250.0381750.29570.384239
26-0.211923-1.64150.052958
27-0.136578-1.05790.147165
28-0.13071-1.01250.157689
290.070170.54350.294388
300.126630.98090.165297
310.1145330.88720.189265
32-0.063031-0.48820.313582
33-0.167792-1.29970.099335
34-0.132562-1.02680.154313
35-0.027799-0.21530.41512
360.3066712.37550.010369


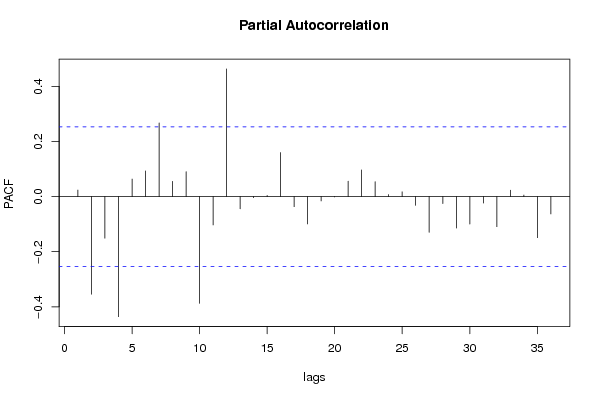
Partial Autocorrelation Function
Time lag kPACF(k)T-STATP-value
10.0235920.18270.427807
2-0.354055-2.74250.004013
3-0.150896-1.16880.123546
4-0.435472-3.37320.000653
50.0634950.49180.312317
60.0931810.72180.236618
70.26692.06740.021509
80.0551510.42720.335383
90.09020.69870.243724
10-0.386941-2.99720.001979
11-0.102765-0.7960.214581
120.4628923.58550.000338
13-0.044306-0.34320.366326
14-0.003961-0.03070.487814
150.0043260.03350.48669
160.1598811.23840.110189
17-0.036622-0.28370.388817
18-0.099049-0.76720.222976
19-0.016043-0.12430.450759
20-0.001157-0.0090.496439
210.0558980.4330.333289
220.0967420.74940.228285
230.0538460.41710.339051
240.0072360.0560.477745
250.0172480.13360.447082
26-0.031893-0.2470.40286
27-0.12951-1.00320.159901
28-0.025346-0.19630.422509
29-0.114294-0.88530.18976
30-0.099567-0.77120.221795
31-0.023679-0.18340.427544
32-0.109381-0.84730.200108
330.0232450.18010.428858
340.0056370.04370.482658
35-0.149048-1.15450.126433
36-0.063193-0.48950.31314

\begin{tabular}{lllllllll}
\hline
Partial Autocorrelation Function \tabularnewline
Time lag k & PACF(k) & T-STAT & P-value \tabularnewline
1 & 0.023592 & 0.1827 & 0.427807 \tabularnewline
2 & -0.354055 & -2.7425 & 0.004013 \tabularnewline
3 & -0.150896 & -1.1688 & 0.123546 \tabularnewline
4 & -0.435472 & -3.3732 & 0.000653 \tabularnewline
5 & 0.063495 & 0.4918 & 0.312317 \tabularnewline
6 & 0.093181 & 0.7218 & 0.236618 \tabularnewline
7 & 0.2669 & 2.0674 & 0.021509 \tabularnewline
8 & 0.055151 & 0.4272 & 0.335383 \tabularnewline
9 & 0.0902 & 0.6987 & 0.243724 \tabularnewline
10 & -0.386941 & -2.9972 & 0.001979 \tabularnewline
11 & -0.102765 & -0.796 & 0.214581 \tabularnewline
12 & 0.462892 & 3.5855 & 0.000338 \tabularnewline
13 & -0.044306 & -0.3432 & 0.366326 \tabularnewline
14 & -0.003961 & -0.0307 & 0.487814 \tabularnewline
15 & 0.004326 & 0.0335 & 0.48669 \tabularnewline
16 & 0.159881 & 1.2384 & 0.110189 \tabularnewline
17 & -0.036622 & -0.2837 & 0.388817 \tabularnewline
18 & -0.099049 & -0.7672 & 0.222976 \tabularnewline
19 & -0.016043 & -0.1243 & 0.450759 \tabularnewline
20 & -0.001157 & -0.009 & 0.496439 \tabularnewline
21 & 0.055898 & 0.433 & 0.333289 \tabularnewline
22 & 0.096742 & 0.7494 & 0.228285 \tabularnewline
23 & 0.053846 & 0.4171 & 0.339051 \tabularnewline
24 & 0.007236 & 0.056 & 0.477745 \tabularnewline
25 & 0.017248 & 0.1336 & 0.447082 \tabularnewline
26 & -0.031893 & -0.247 & 0.40286 \tabularnewline
27 & -0.12951 & -1.0032 & 0.159901 \tabularnewline
28 & -0.025346 & -0.1963 & 0.422509 \tabularnewline
29 & -0.114294 & -0.8853 & 0.18976 \tabularnewline
30 & -0.099567 & -0.7712 & 0.221795 \tabularnewline
31 & -0.023679 & -0.1834 & 0.427544 \tabularnewline
32 & -0.109381 & -0.8473 & 0.200108 \tabularnewline
33 & 0.023245 & 0.1801 & 0.428858 \tabularnewline
34 & 0.005637 & 0.0437 & 0.482658 \tabularnewline
35 & -0.149048 & -1.1545 & 0.126433 \tabularnewline
36 & -0.063193 & -0.4895 & 0.31314 \tabularnewline
\hline
\end{tabular}
%Source: https://freestatistics.org/blog/index.php?pk=68395&T=2

[TABLE]
[ROW][C]Partial Autocorrelation Function[/C][/ROW]
[ROW][C]Time lag k[/C][C]PACF(k)[/C][C]T-STAT[/C][C]P-value[/C][/ROW]
[ROW][C]1[/C][C]0.023592[/C][C]0.1827[/C][C]0.427807[/C][/ROW]
[ROW][C]2[/C][C]-0.354055[/C][C]-2.7425[/C][C]0.004013[/C][/ROW]
[ROW][C]3[/C][C]-0.150896[/C][C]-1.1688[/C][C]0.123546[/C][/ROW]
[ROW][C]4[/C][C]-0.435472[/C][C]-3.3732[/C][C]0.000653[/C][/ROW]
[ROW][C]5[/C][C]0.063495[/C][C]0.4918[/C][C]0.312317[/C][/ROW]
[ROW][C]6[/C][C]0.093181[/C][C]0.7218[/C][C]0.236618[/C][/ROW]
[ROW][C]7[/C][C]0.2669[/C][C]2.0674[/C][C]0.021509[/C][/ROW]
[ROW][C]8[/C][C]0.055151[/C][C]0.4272[/C][C]0.335383[/C][/ROW]
[ROW][C]9[/C][C]0.0902[/C][C]0.6987[/C][C]0.243724[/C][/ROW]
[ROW][C]10[/C][C]-0.386941[/C][C]-2.9972[/C][C]0.001979[/C][/ROW]
[ROW][C]11[/C][C]-0.102765[/C][C]-0.796[/C][C]0.214581[/C][/ROW]
[ROW][C]12[/C][C]0.462892[/C][C]3.5855[/C][C]0.000338[/C][/ROW]
[ROW][C]13[/C][C]-0.044306[/C][C]-0.3432[/C][C]0.366326[/C][/ROW]
[ROW][C]14[/C][C]-0.003961[/C][C]-0.0307[/C][C]0.487814[/C][/ROW]
[ROW][C]15[/C][C]0.004326[/C][C]0.0335[/C][C]0.48669[/C][/ROW]
[ROW][C]16[/C][C]0.159881[/C][C]1.2384[/C][C]0.110189[/C][/ROW]
[ROW][C]17[/C][C]-0.036622[/C][C]-0.2837[/C][C]0.388817[/C][/ROW]
[ROW][C]18[/C][C]-0.099049[/C][C]-0.7672[/C][C]0.222976[/C][/ROW]
[ROW][C]19[/C][C]-0.016043[/C][C]-0.1243[/C][C]0.450759[/C][/ROW]
[ROW][C]20[/C][C]-0.001157[/C][C]-0.009[/C][C]0.496439[/C][/ROW]
[ROW][C]21[/C][C]0.055898[/C][C]0.433[/C][C]0.333289[/C][/ROW]
[ROW][C]22[/C][C]0.096742[/C][C]0.7494[/C][C]0.228285[/C][/ROW]
[ROW][C]23[/C][C]0.053846[/C][C]0.4171[/C][C]0.339051[/C][/ROW]
[ROW][C]24[/C][C]0.007236[/C][C]0.056[/C][C]0.477745[/C][/ROW]
[ROW][C]25[/C][C]0.017248[/C][C]0.1336[/C][C]0.447082[/C][/ROW]
[ROW][C]26[/C][C]-0.031893[/C][C]-0.247[/C][C]0.40286[/C][/ROW]
[ROW][C]27[/C][C]-0.12951[/C][C]-1.0032[/C][C]0.159901[/C][/ROW]
[ROW][C]28[/C][C]-0.025346[/C][C]-0.1963[/C][C]0.422509[/C][/ROW]
[ROW][C]29[/C][C]-0.114294[/C][C]-0.8853[/C][C]0.18976[/C][/ROW]
[ROW][C]30[/C][C]-0.099567[/C][C]-0.7712[/C][C]0.221795[/C][/ROW]
[ROW][C]31[/C][C]-0.023679[/C][C]-0.1834[/C][C]0.427544[/C][/ROW]
[ROW][C]32[/C][C]-0.109381[/C][C]-0.8473[/C][C]0.200108[/C][/ROW]
[ROW][C]33[/C][C]0.023245[/C][C]0.1801[/C][C]0.428858[/C][/ROW]
[ROW][C]34[/C][C]0.005637[/C][C]0.0437[/C][C]0.482658[/C][/ROW]
[ROW][C]35[/C][C]-0.149048[/C][C]-1.1545[/C][C]0.126433[/C][/ROW]
[ROW][C]36[/C][C]-0.063193[/C][C]-0.4895[/C][C]0.31314[/C][/ROW]
[/TABLE]
Source: https://freestatistics.org/blog/index.php?pk=68395&T=2

Globally Unique Identifier (entire table): ba.freestatistics.org/blog/index.php?pk=68395&T=2

As an alternative you can also use a QR Code:  

The GUIDs for individual cells are displayed in the table below:

Partial Autocorrelation Function
Time lag kPACF(k)T-STATP-value
10.0235920.18270.427807
2-0.354055-2.74250.004013
3-0.150896-1.16880.123546
4-0.435472-3.37320.000653
50.0634950.49180.312317
60.0931810.72180.236618
70.26692.06740.021509
80.0551510.42720.335383
90.09020.69870.243724
10-0.386941-2.99720.001979
11-0.102765-0.7960.214581
120.4628923.58550.000338
13-0.044306-0.34320.366326
14-0.003961-0.03070.487814
150.0043260.03350.48669
160.1598811.23840.110189
17-0.036622-0.28370.388817
18-0.099049-0.76720.222976
19-0.016043-0.12430.450759
20-0.001157-0.0090.496439
210.0558980.4330.333289
220.0967420.74940.228285
230.0538460.41710.339051
240.0072360.0560.477745
250.0172480.13360.447082
26-0.031893-0.2470.40286
27-0.12951-1.00320.159901
28-0.025346-0.19630.422509
29-0.114294-0.88530.18976
30-0.099567-0.77120.221795
31-0.023679-0.18340.427544
32-0.109381-0.84730.200108
330.0232450.18010.428858
340.0056370.04370.482658
35-0.149048-1.15450.126433
36-0.063193-0.48950.31314


Parameters (Session):
par1 = 36 ; par2 = 1 ; par3 = 0 ; par4 = 0 ; par5 = 12 ; par6 = MA ; par7 = 0.95 ;
Parameters (R input):
par1 = 36 ; par2 = 1 ; par3 = 0 ; par4 = 0 ; par5 = 12 ; par6 = MA ; par7 = 0.95 ;
R code (references can be found in the software module):
if (par1 == 'Default') {
par1 = 10*log10(length(x))
} else {
par1 <- as.numeric(par1)
}
par2 <- as.numeric(par2)
par3 <- as.numeric(par3)
par4 <- as.numeric(par4)
par5 <- as.numeric(par5)
if (par6 == 'White Noise') par6 <- 'white' else par6 <- 'ma'
par7 <- as.numeric(par7)
if (par2 == 0) {
x <- log(x)
} else {
x <- (x ^ par2 - 1) / par2
}
if (par3 > 0) x <- diff(x,lag=1,difference=par3)
if (par4 > 0) x <- diff(x,lag=par5,difference=par4)
bitmap(file='pic1.png')
racf <- acf(x, par1, main='Autocorrelation', xlab='time lag', ylab='ACF', ci.type=par6, ci=par7, sub=paste('(lambda=',par2,', d=',par3,', D=',par4,', CI=', par7, ', CI type=',par6,')',sep=''))
dev.off()
bitmap(file='pic2.png')
rpacf <- pacf(x,par1,main='Partial Autocorrelation',xlab='lags',ylab='PACF')
dev.off()
(myacf <- c(racf$acf))
(mypacf <- c(rpacf$acf))
lengthx <- length(x)
sqrtn <- sqrt(lengthx)
load(file='createtable')
a<-table.start()
a<-table.row.start(a)
a<-table.element(a,'Autocorrelation Function',4,TRUE)
a<-table.row.end(a)
a<-table.row.start(a)
a<-table.element(a,'Time lag k',header=TRUE)
a<-table.element(a,hyperlink('basics.htm','ACF(k)','click here for more information about the Autocorrelation Function'),header=TRUE)
a<-table.element(a,'T-STAT',header=TRUE)
a<-table.element(a,'P-value',header=TRUE)
a<-table.row.end(a)
for (i in 2:(par1+1)) {
a<-table.row.start(a)
a<-table.element(a,i-1,header=TRUE)
a<-table.element(a,round(myacf[i],6))
mytstat <- myacf[i]*sqrtn
a<-table.element(a,round(mytstat,4))
a<-table.element(a,round(1-pt(abs(mytstat),lengthx),6))
a<-table.row.end(a)
}
a<-table.end(a)
table.save(a,file='mytable.tab')
a<-table.start()
a<-table.row.start(a)
a<-table.element(a,'Partial Autocorrelation Function',4,TRUE)
a<-table.row.end(a)
a<-table.row.start(a)
a<-table.element(a,'Time lag k',header=TRUE)
a<-table.element(a,hyperlink('basics.htm','PACF(k)','click here for more information about the Partial Autocorrelation Function'),header=TRUE)
a<-table.element(a,'T-STAT',header=TRUE)
a<-table.element(a,'P-value',header=TRUE)
a<-table.row.end(a)
for (i in 1:par1) {
a<-table.row.start(a)
a<-table.element(a,i,header=TRUE)
a<-table.element(a,round(mypacf[i],6))
mytstat <- mypacf[i]*sqrtn
a<-table.element(a,round(mytstat,4))
a<-table.element(a,round(1-pt(abs(mytstat),lengthx),6))
a<-table.row.end(a)
}
a<-table.end(a)
table.save(a,file='mytable1.tab')