Free Statistics
of Irreproducible Research!
Description of Statistical Computation | |||||||||||||||||||||||||||||||||||||||||
|---|---|---|---|---|---|---|---|---|---|---|---|---|---|---|---|---|---|---|---|---|---|---|---|---|---|---|---|---|---|---|---|---|---|---|---|---|---|---|---|---|---|
| Author's title | |||||||||||||||||||||||||||||||||||||||||
| Author | *The author of this computation has been verified* | ||||||||||||||||||||||||||||||||||||||||
| R Software Module | rwasp_univariatedataseries.wasp | ||||||||||||||||||||||||||||||||||||||||
| Title produced by software | Univariate Data Series | ||||||||||||||||||||||||||||||||||||||||
| Date of computation | Wed, 16 Dec 2009 07:52:30 -0700 | ||||||||||||||||||||||||||||||||||||||||
| Cite this page as follows | Statistical Computations at FreeStatistics.org, Office for Research Development and Education, URL https://freestatistics.org/blog/index.php?v=date/2009/Dec/16/t1260975179p9r8xaf872qzknb.htm/, Retrieved Tue, 30 Apr 2024 13:14:27 +0000 | ||||||||||||||||||||||||||||||||||||||||
| Statistical Computations at FreeStatistics.org, Office for Research Development and Education, URL https://freestatistics.org/blog/index.php?pk=68391, Retrieved Tue, 30 Apr 2024 13:14:27 +0000 | |||||||||||||||||||||||||||||||||||||||||
| QR Codes: | |||||||||||||||||||||||||||||||||||||||||
|
| |||||||||||||||||||||||||||||||||||||||||
| Original text written by user: | |||||||||||||||||||||||||||||||||||||||||
| IsPrivate? | No (this computation is public) | ||||||||||||||||||||||||||||||||||||||||
| User-defined keywords | |||||||||||||||||||||||||||||||||||||||||
| Estimated Impact | 110 | ||||||||||||||||||||||||||||||||||||||||
Tree of Dependent Computations | |||||||||||||||||||||||||||||||||||||||||
| Family? (F = Feedback message, R = changed R code, M = changed R Module, P = changed Parameters, D = changed Data) | |||||||||||||||||||||||||||||||||||||||||
| - [Univariate Data Series] [] [2009-12-16 14:40:45] [0fdf1175258f848245feef937e47f101] - PD [Univariate Data Series] [] [2009-12-16 14:52:30] [e76c6d261190c0179bc6006a5cdb804c] [Current] | |||||||||||||||||||||||||||||||||||||||||
| Feedback Forum | |||||||||||||||||||||||||||||||||||||||||
Post a new message | |||||||||||||||||||||||||||||||||||||||||
Dataset | |||||||||||||||||||||||||||||||||||||||||
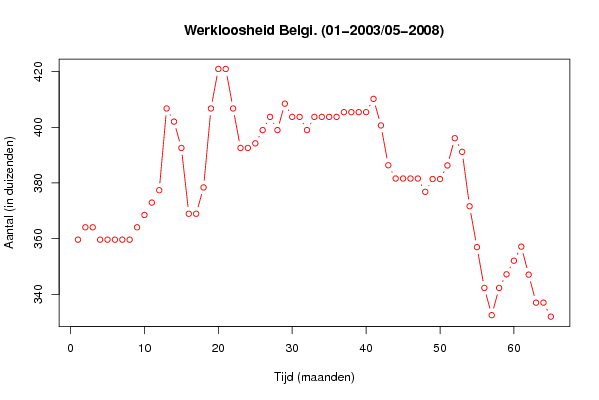
| Dataseries X: | |||||||||||||||||||||||||||||||||||||||||
359.64 364.08 364.08 359.64 359.64 359.64 359.64 359.64 364.08 368.52 372.96 377.40 406.78 402.05 392.59 368.94 368.94 378.40 406.78 420.97 420.97 406.78 392.59 392.59 394.25 399.00 403.75 399.00 408.50 403.75 403.75 399.00 403.75 403.75 403.75 403.75 405.45 405.45 405.45 405.45 410.22 400.68 386.37 381.60 381.60 381.60 381.60 376.83 381.42 381.42 386.31 396.09 391.20 371.64 356.97 342.30 332.52 342.30 347.19 352.08 357.13 347.07 337.01 337.01 331.98 | |||||||||||||||||||||||||||||||||||||||||
Tables (Output of Computation) | |||||||||||||||||||||||||||||||||||||||||
| |||||||||||||||||||||||||||||||||||||||||
Figures (Output of Computation) | |||||||||||||||||||||||||||||||||||||||||
Input Parameters & R Code | |||||||||||||||||||||||||||||||||||||||||
| Parameters (Session): | |||||||||||||||||||||||||||||||||||||||||
| par1 = Werkloosheidsgraad Belgi� ; par2 = Belgostat ; par3 = Werkloosheidsgraad in ons koninkrijk ; | |||||||||||||||||||||||||||||||||||||||||
| Parameters (R input): | |||||||||||||||||||||||||||||||||||||||||
| par1 = Werkloosheidsgraad Belgi� ; par2 = Belgostat ; par3 = Werkloosheidsgraad in ons koninkrijk ; | |||||||||||||||||||||||||||||||||||||||||
| R code (references can be found in the software module): | |||||||||||||||||||||||||||||||||||||||||
bitmap(file='test1.png') | |||||||||||||||||||||||||||||||||||||||||