| Multiple Linear Regression - Estimated Regression Equation |
| tip[t] = + 122.259777574500 -0.185268531365494wrk[t] -0.416978394569082M1[t] + 2.25199379388721M2[t] + 11.1051832263055M3[t] + 4.06596342772792M4[t] + 1.75915286014624M5[t] + 11.789222012123M6[t] -8.2521158322044M7[t] + 3.93545709541912M8[t] + 18.4126669470263M9[t] + 16.2965674288903M10[t] + 8.1710049734852M11[t] -0.00480062061127904t + e[t] |
| Multiple Linear Regression - Ordinary Least Squares | |||||
| Variable | Parameter | S.D. | T-STAT H0: parameter = 0 | 2-tail p-value | 1-tail p-value |
| (Intercept) | 122.259777574500 | 20.152348 | 6.0668 | 0 | 0 |
| wrk | -0.185268531365494 | 0.137589 | -1.3465 | 0.184589 | 0.092295 |
| M1 | -0.416978394569082 | 3.000392 | -0.139 | 0.890064 | 0.445032 |
| M2 | 2.25199379388721 | 3.288569 | 0.6848 | 0.496837 | 0.248418 |
| M3 | 11.1051832263055 | 3.573807 | 3.1074 | 0.003199 | 0.001599 |
| M4 | 4.06596342772792 | 3.793315 | 1.0719 | 0.289249 | 0.144624 |
| M5 | 1.75915286014624 | 4.244522 | 0.4145 | 0.680428 | 0.340214 |
| M6 | 11.789222012123 | 4.084826 | 2.8861 | 0.005874 | 0.002937 |
| M7 | -8.2521158322044 | 3.703298 | -2.2283 | 0.030681 | 0.015341 |
| M8 | 3.93545709541912 | 4.331012 | 0.9087 | 0.368161 | 0.18408 |
| M9 | 18.4126669470263 | 4.191855 | 4.3925 | 6.3e-05 | 3.2e-05 |
| M10 | 16.2965674288903 | 3.42099 | 4.7637 | 1.9e-05 | 9e-06 |
| M11 | 8.1710049734852 | 3.12615 | 2.6138 | 0.011993 | 0.005996 |
| t | -0.00480062061127904 | 0.106805 | -0.0449 | 0.96434 | 0.48217 |
| Multiple Linear Regression - Regression Statistics | |
| Multiple R | 0.878574643479738 |
| R-squared | 0.77189340416555 |
| Adjusted R-squared | 0.708800090424106 |
| F-TEST (value) | 12.2341553865560 |
| F-TEST (DF numerator) | 13 |
| F-TEST (DF denominator) | 47 |
| p-value | 5.17779152886533e-11 |
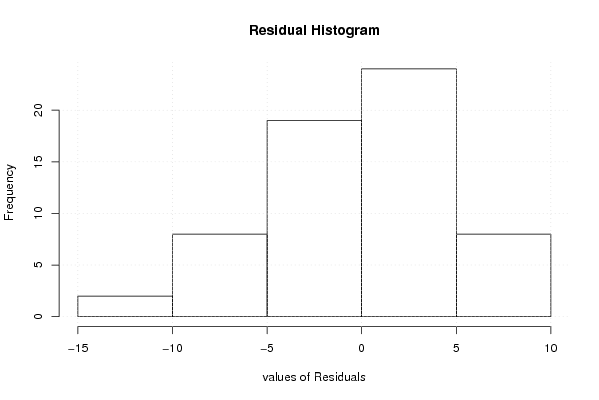
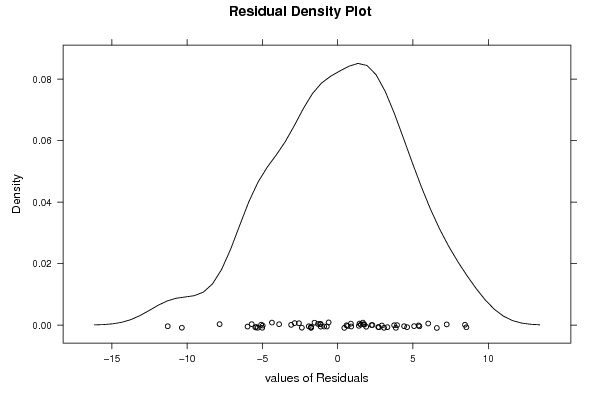
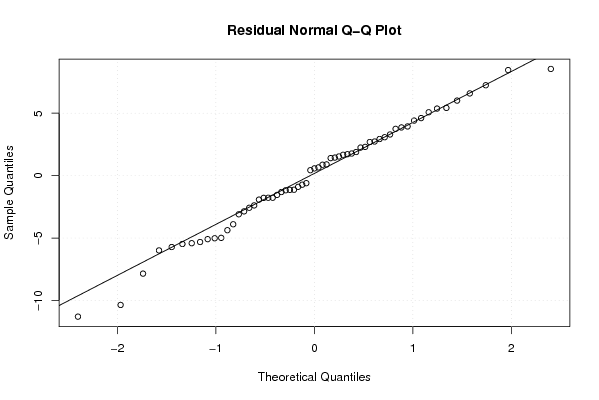
| Multiple Linear Regression - Residual Statistics | |
| Residual Standard Deviation | 4.91781265256009 |
| Sum Squared Residuals | 1136.68942042697 |
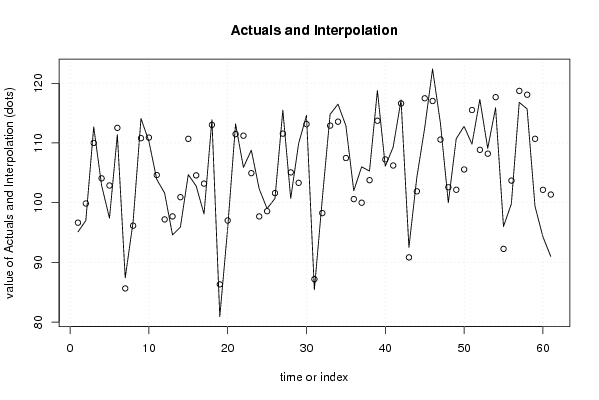
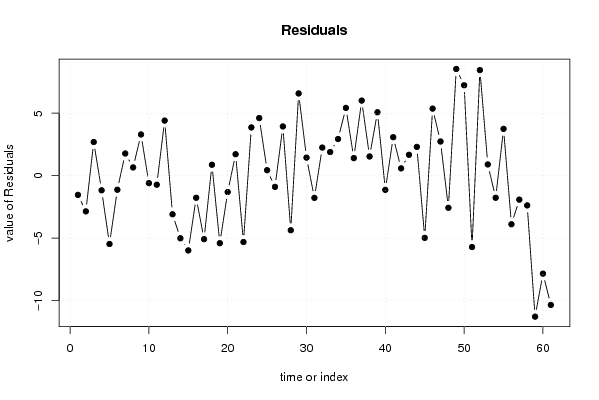
| Multiple Linear Regression - Actuals, Interpolation, and Residuals | |||
| Time or Index | Actuals | Interpolation Forecast | Residuals Prediction Error |
| 1 | 95.1 | 96.6414782936123 | -1.54147829361233 |
| 2 | 97 | 99.8614554555538 | -2.86145545555379 |
| 3 | 112.7 | 110.006723986919 | 2.69327601308074 |
| 4 | 102.9 | 104.074314755923 | -1.17431475592336 |
| 5 | 97.4 | 102.874314755923 | -5.47431475592336 |
| 6 | 111.4 | 112.529046224558 | -1.12904622455787 |
| 7 | 87.4 | 85.6279720990959 | 1.77202790090412 |
| 8 | 96.8 | 96.1433276238187 | 0.656672376181293 |
| 9 | 114.1 | 110.801005386180 | 3.29899461381989 |
| 10 | 110.3 | 110.903327623819 | -0.603327623818687 |
| 11 | 103.9 | 104.625649861457 | -0.725649861457294 |
| 12 | 101.6 | 97.1909183928228 | 4.40908160717721 |
| 13 | 94.6 | 97.69548203447 | -3.09548203446991 |
| 14 | 95.9 | 100.915459196411 | -5.01545919641138 |
| 15 | 104.7 | 110.690190665046 | -5.9901906650459 |
| 16 | 102.8 | 104.572512902684 | -1.77251290268450 |
| 17 | 98.1 | 103.187244371319 | -5.08724437131901 |
| 18 | 113.9 | 113.027244371319 | 0.872755628681004 |
| 19 | 80.9 | 86.3114387772225 | -5.41143877722252 |
| 20 | 95.7 | 97.0120628333108 | -1.31206283331082 |
| 21 | 113.2 | 111.484472064307 | 1.71552793569326 |
| 22 | 105.9 | 111.216257239214 | -5.31625723921435 |
| 23 | 108.8 | 104.938579476853 | 3.86142052314706 |
| 24 | 102.3 | 97.689116539584 | 4.61088346041607 |
| 25 | 99 | 98.564217243962 | 0.435782756037974 |
| 26 | 100.7 | 101.598925874538 | -0.898925874538018 |
| 27 | 115.5 | 111.558925874538 | 3.94107412546198 |
| 28 | 100.7 | 105.070711049446 | -4.37071104944563 |
| 29 | 109.9 | 103.314905455349 | 6.58509454465086 |
| 30 | 114.6 | 113.154905455349 | 1.44509454465084 |
| 31 | 85.4 | 87.1801739867146 | -1.78017398671464 |
| 32 | 100.5 | 98.251335105534 | 2.24866489446606 |
| 33 | 114.8 | 112.909012867895 | 1.89098713210466 |
| 34 | 116.5 | 113.567140699630 | 2.93285930036957 |
| 35 | 112.9 | 107.474731468635 | 5.4252685313655 |
| 36 | 102 | 100.595805594096 | 1.40419440590352 |
| 37 | 106 | 99.9887580475506 | 6.01124195244937 |
| 38 | 105.3 | 103.764540803589 | 1.53545919641140 |
| 39 | 118.8 | 113.724540803589 | 5.07545919641139 |
| 40 | 106.1 | 107.236325978496 | -1.13632597849621 |
| 41 | 109.3 | 106.221594509862 | 3.07840549013829 |
| 42 | 117.2 | 116.617400103958 | 0.582599896041817 |
| 43 | 92.5 | 90.8279371666892 | 1.67206283331082 |
| 44 | 104.2 | 101.899098285508 | 2.30090171449153 |
| 45 | 112.5 | 117.483118704697 | -4.98311870469735 |
| 46 | 122.4 | 117.029635348239 | 5.37036465176054 |
| 47 | 113.3 | 110.566689054513 | 2.73331094548744 |
| 48 | 100 | 102.576151991782 | -2.57615199178157 |
| 49 | 110.7 | 102.154372976601 | 8.54562702339879 |
| 50 | 112.8 | 105.559618669908 | 7.2403813300918 |
| 51 | 109.8 | 115.519618669908 | -5.7196186699082 |
| 52 | 117.3 | 108.846135313450 | 8.4538646865497 |
| 53 | 109.1 | 108.201940907547 | 0.898059092453205 |
| 54 | 115.9 | 117.671403844816 | -1.77140384481580 |
| 55 | 96 | 92.2524779702778 | 3.74752202972222 |
| 56 | 99.8 | 103.694176151828 | -3.89417615182807 |
| 57 | 116.8 | 118.722390976920 | -1.92239097692046 |
| 58 | 115.7 | 118.083639089097 | -2.38363908909708 |
| 59 | 99.4 | 110.694350138543 | -11.2943501385427 |
| 60 | 94.3 | 102.148007481715 | -7.84800748171523 |
| 61 | 91 | 101.355691403804 | -10.3556914038039 |
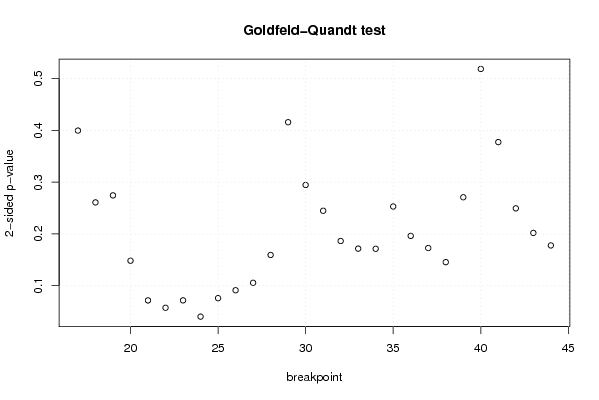
| Goldfeld-Quandt test for Heteroskedasticity | |||
| p-values | Alternative Hypothesis | ||
| breakpoint index | greater | 2-sided | less |
| 17 | 0.199876899867726 | 0.399753799735451 | 0.800123100132274 |
| 18 | 0.130445639082920 | 0.260891278165839 | 0.86955436091708 |
| 19 | 0.137234687761394 | 0.274469375522788 | 0.862765312238606 |
| 20 | 0.0740537618828847 | 0.148107523765769 | 0.925946238117115 |
| 21 | 0.0357070679004614 | 0.0714141358009228 | 0.964292932099539 |
| 22 | 0.0285746440288704 | 0.0571492880577407 | 0.97142535597113 |
| 23 | 0.0357615194275701 | 0.0715230388551401 | 0.96423848057243 |
| 24 | 0.019992574007853 | 0.039985148015706 | 0.980007425992147 |
| 25 | 0.0378695978911341 | 0.0757391957822681 | 0.962130402108866 |
| 26 | 0.0455188325095428 | 0.0910376650190856 | 0.954481167490457 |
| 27 | 0.0527138951369769 | 0.105427790273954 | 0.947286104863023 |
| 28 | 0.0796322204551651 | 0.159264440910330 | 0.920367779544835 |
| 29 | 0.207957461620741 | 0.415914923241482 | 0.792042538379259 |
| 30 | 0.147292613097186 | 0.294585226194371 | 0.852707386902814 |
| 31 | 0.122348589288778 | 0.244697178577556 | 0.877651410711222 |
| 32 | 0.0931361165939759 | 0.186272233187952 | 0.906863883406024 |
| 33 | 0.0857413260828835 | 0.171482652165767 | 0.914258673917117 |
| 34 | 0.085622768030717 | 0.171245536061434 | 0.914377231969283 |
| 35 | 0.126465684373153 | 0.252931368746307 | 0.873534315626847 |
| 36 | 0.0980572165774429 | 0.196114433154886 | 0.901942783422557 |
| 37 | 0.0863269304846328 | 0.172653860969266 | 0.913673069515367 |
| 38 | 0.0726828635427888 | 0.145365727085578 | 0.927317136457211 |
| 39 | 0.135393981769129 | 0.270787963538258 | 0.864606018230871 |
| 40 | 0.259451818660478 | 0.518903637320956 | 0.740548181339522 |
| 41 | 0.188742563371702 | 0.377485126743405 | 0.811257436628298 |
| 42 | 0.124688611126330 | 0.249377222252659 | 0.87531138887367 |
| 43 | 0.100959105450093 | 0.201918210900187 | 0.899040894549907 |
| 44 | 0.088848251001177 | 0.177696502002354 | 0.911151748998823 |
| Meta Analysis of Goldfeld-Quandt test for Heteroskedasticity | |||
| Description | # significant tests | % significant tests | OK/NOK |
| 1% type I error level | 0 | 0 | OK |
| 5% type I error level | 1 | 0.0357142857142857 | OK |
| 10% type I error level | 6 | 0.214285714285714 | NOK |