Free Statistics

of Irreproducible Research!

Author's title

Author*The author of this computation has been verified*
R Software Modulerwasp_multipleregression.wasp
Title produced by softwareMultiple Regression
Date of computationWed, 16 Dec 2009 07:39:07 -0700
Cite this page as followsStatistical Computations at FreeStatistics.org, Office for Research Development and Education, URL https://freestatistics.org/blog/index.php?v=date/2009/Dec/16/t1260974954zkvzrbhx7oxas7x.htm/, Retrieved Tue, 30 Apr 2024 16:43:34 +0000
Statistical Computations at FreeStatistics.org, Office for Research Development and Education, URL https://freestatistics.org/blog/index.php?pk=68388, Retrieved Tue, 30 Apr 2024 16:43:34 +0000
QR Codes:

Original text written by user:
IsPrivate?No (this computation is public)
User-defined keywords
Estimated Impact118
Family? (F = Feedback message, R = changed R code, M = changed R Module, P = changed Parameters, D = changed Data)
-     [Multiple Regression] [Q1 The Seatbeltlaw] [2007-11-14 19:27:43] [8cd6641b921d30ebe00b648d1481bba0]
- RM D  [Multiple Regression] [Seatbelt] [2009-11-12 14:06:21] [b98453cac15ba1066b407e146608df68]
- R  D    [Multiple Regression] [Model 3, seizonal...] [2009-11-19 17:09:33] [075a06058fde559dd021d126a2b15a40]
-    D        [Multiple Regression] [Model 3, seizonal...] [2009-12-16 14:39:07] [154177ed6b2613a730375f7d341441cf] [Current]
Feedback Forum

Post a new message
Dataseries X:
95.1	136
97	133
112.7	126
102.9	120
97.4	114
111.4	116
87.4	153
96.8	162
114.1	161
110.3	149
103.9	139
101.6	135
94.6	130
95.9	127
104.7	122
102.8	117
98.1	112
113.9	113
80.9	149
95.7	157
113.2	157
105.9	147
108.8	137
102.3	132
99	125
100.7	123
115.5	117
100.7	114
109.9	111
114.6	112
85.4	144
100.5	150
114.8	149
116.5	134
112.9	123
102	116
106	117
105.3	111
118.8	105
106.1	102
109.3	95
117.2	93
92.5	124
104.2	130
112.5	124
122.4	115
113.3	106
100	105
110.7	105
112.8	101
109.8	95
117.3	93
109.1	84
115.9	87
96	116
99.8	120
116.8	117
115.7	109
99.4	105
94.3	107
91	109


Summary of computational transaction
Raw Inputview raw input (R code)
Raw Outputview raw output of R engine
Computing time6 seconds
R Server'Gwilym Jenkins' @ 72.249.127.135

\begin{tabular}{lllllllll}
\hline
Summary of computational transaction \tabularnewline
Raw Input & view raw input (R code)  \tabularnewline
Raw Output & view raw output of R engine  \tabularnewline
Computing time & 6 seconds \tabularnewline
R Server & 'Gwilym Jenkins' @ 72.249.127.135 \tabularnewline
\hline
\end{tabular}
%Source: https://freestatistics.org/blog/index.php?pk=68388&T=0

[TABLE]
[ROW][C]Summary of computational transaction[/C][/ROW]
[ROW][C]Raw Input[/C][C]view raw input (R code) [/C][/ROW]
[ROW][C]Raw Output[/C][C]view raw output of R engine [/C][/ROW]
[ROW][C]Computing time[/C][C]6 seconds[/C][/ROW]
[ROW][C]R Server[/C][C]'Gwilym Jenkins' @ 72.249.127.135[/C][/ROW]
[/TABLE]
Source: https://freestatistics.org/blog/index.php?pk=68388&T=0

Globally Unique Identifier (entire table): ba.freestatistics.org/blog/index.php?pk=68388&T=0

As an alternative you can also use a QR Code:  

The GUIDs for individual cells are displayed in the table below:

Summary of computational transaction
Raw Inputview raw input (R code)
Raw Outputview raw output of R engine
Computing time6 seconds
R Server'Gwilym Jenkins' @ 72.249.127.135


Multiple Linear Regression - Estimated Regression Equation
tip[t] = + 122.259777574500 -0.185268531365494wrk[t] -0.416978394569082M1[t] + 2.25199379388721M2[t] + 11.1051832263055M3[t] + 4.06596342772792M4[t] + 1.75915286014624M5[t] + 11.789222012123M6[t] -8.2521158322044M7[t] + 3.93545709541912M8[t] + 18.4126669470263M9[t] + 16.2965674288903M10[t] + 8.1710049734852M11[t] -0.00480062061127904t + e[t]

\begin{tabular}{lllllllll}
\hline
Multiple Linear Regression - Estimated Regression Equation \tabularnewline
tip[t] =  +  122.259777574500 -0.185268531365494wrk[t] -0.416978394569082M1[t] +  2.25199379388721M2[t] +  11.1051832263055M3[t] +  4.06596342772792M4[t] +  1.75915286014624M5[t] +  11.789222012123M6[t] -8.2521158322044M7[t] +  3.93545709541912M8[t] +  18.4126669470263M9[t] +  16.2965674288903M10[t] +  8.1710049734852M11[t] -0.00480062061127904t  + e[t] \tabularnewline
\hline
\end{tabular}
%Source: https://freestatistics.org/blog/index.php?pk=68388&T=1

[TABLE]
[ROW][C]Multiple Linear Regression - Estimated Regression Equation[/C][/ROW]
[ROW][C]tip[t] =  +  122.259777574500 -0.185268531365494wrk[t] -0.416978394569082M1[t] +  2.25199379388721M2[t] +  11.1051832263055M3[t] +  4.06596342772792M4[t] +  1.75915286014624M5[t] +  11.789222012123M6[t] -8.2521158322044M7[t] +  3.93545709541912M8[t] +  18.4126669470263M9[t] +  16.2965674288903M10[t] +  8.1710049734852M11[t] -0.00480062061127904t  + e[t][/C][/ROW]
[/TABLE]
Source: https://freestatistics.org/blog/index.php?pk=68388&T=1

Globally Unique Identifier (entire table): ba.freestatistics.org/blog/index.php?pk=68388&T=1

As an alternative you can also use a QR Code:  

The GUIDs for individual cells are displayed in the table below:

Multiple Linear Regression - Estimated Regression Equation
tip[t] = + 122.259777574500 -0.185268531365494wrk[t] -0.416978394569082M1[t] + 2.25199379388721M2[t] + 11.1051832263055M3[t] + 4.06596342772792M4[t] + 1.75915286014624M5[t] + 11.789222012123M6[t] -8.2521158322044M7[t] + 3.93545709541912M8[t] + 18.4126669470263M9[t] + 16.2965674288903M10[t] + 8.1710049734852M11[t] -0.00480062061127904t + e[t]


Multiple Linear Regression - Ordinary Least Squares
VariableParameterS.D.T-STATH0: parameter = 02-tail p-value1-tail p-value
(Intercept)122.25977757450020.1523486.066800
wrk-0.1852685313654940.137589-1.34650.1845890.092295
M1-0.4169783945690823.000392-0.1390.8900640.445032
M22.251993793887213.2885690.68480.4968370.248418
M311.10518322630553.5738073.10740.0031990.001599
M44.065963427727923.7933151.07190.2892490.144624
M51.759152860146244.2445220.41450.6804280.340214
M611.7892220121234.0848262.88610.0058740.002937
M7-8.25211583220443.703298-2.22830.0306810.015341
M83.935457095419124.3310120.90870.3681610.18408
M918.41266694702634.1918554.39256.3e-053.2e-05
M1016.29656742889033.420994.76371.9e-059e-06
M118.17100497348523.126152.61380.0119930.005996
t-0.004800620611279040.106805-0.04490.964340.48217

\begin{tabular}{lllllllll}
\hline
Multiple Linear Regression - Ordinary Least Squares \tabularnewline
Variable & Parameter & S.D. & T-STATH0: parameter = 0 & 2-tail p-value & 1-tail p-value \tabularnewline
(Intercept) & 122.259777574500 & 20.152348 & 6.0668 & 0 & 0 \tabularnewline
wrk & -0.185268531365494 & 0.137589 & -1.3465 & 0.184589 & 0.092295 \tabularnewline
M1 & -0.416978394569082 & 3.000392 & -0.139 & 0.890064 & 0.445032 \tabularnewline
M2 & 2.25199379388721 & 3.288569 & 0.6848 & 0.496837 & 0.248418 \tabularnewline
M3 & 11.1051832263055 & 3.573807 & 3.1074 & 0.003199 & 0.001599 \tabularnewline
M4 & 4.06596342772792 & 3.793315 & 1.0719 & 0.289249 & 0.144624 \tabularnewline
M5 & 1.75915286014624 & 4.244522 & 0.4145 & 0.680428 & 0.340214 \tabularnewline
M6 & 11.789222012123 & 4.084826 & 2.8861 & 0.005874 & 0.002937 \tabularnewline
M7 & -8.2521158322044 & 3.703298 & -2.2283 & 0.030681 & 0.015341 \tabularnewline
M8 & 3.93545709541912 & 4.331012 & 0.9087 & 0.368161 & 0.18408 \tabularnewline
M9 & 18.4126669470263 & 4.191855 & 4.3925 & 6.3e-05 & 3.2e-05 \tabularnewline
M10 & 16.2965674288903 & 3.42099 & 4.7637 & 1.9e-05 & 9e-06 \tabularnewline
M11 & 8.1710049734852 & 3.12615 & 2.6138 & 0.011993 & 0.005996 \tabularnewline
t & -0.00480062061127904 & 0.106805 & -0.0449 & 0.96434 & 0.48217 \tabularnewline
\hline
\end{tabular}
%Source: https://freestatistics.org/blog/index.php?pk=68388&T=2

[TABLE]
[ROW][C]Multiple Linear Regression - Ordinary Least Squares[/C][/ROW]
[ROW][C]Variable[/C][C]Parameter[/C][C]S.D.[/C][C]T-STATH0: parameter = 0[/C][C]2-tail p-value[/C][C]1-tail p-value[/C][/ROW]
[ROW][C](Intercept)[/C][C]122.259777574500[/C][C]20.152348[/C][C]6.0668[/C][C]0[/C][C]0[/C][/ROW]
[ROW][C]wrk[/C][C]-0.185268531365494[/C][C]0.137589[/C][C]-1.3465[/C][C]0.184589[/C][C]0.092295[/C][/ROW]
[ROW][C]M1[/C][C]-0.416978394569082[/C][C]3.000392[/C][C]-0.139[/C][C]0.890064[/C][C]0.445032[/C][/ROW]
[ROW][C]M2[/C][C]2.25199379388721[/C][C]3.288569[/C][C]0.6848[/C][C]0.496837[/C][C]0.248418[/C][/ROW]
[ROW][C]M3[/C][C]11.1051832263055[/C][C]3.573807[/C][C]3.1074[/C][C]0.003199[/C][C]0.001599[/C][/ROW]
[ROW][C]M4[/C][C]4.06596342772792[/C][C]3.793315[/C][C]1.0719[/C][C]0.289249[/C][C]0.144624[/C][/ROW]
[ROW][C]M5[/C][C]1.75915286014624[/C][C]4.244522[/C][C]0.4145[/C][C]0.680428[/C][C]0.340214[/C][/ROW]
[ROW][C]M6[/C][C]11.789222012123[/C][C]4.084826[/C][C]2.8861[/C][C]0.005874[/C][C]0.002937[/C][/ROW]
[ROW][C]M7[/C][C]-8.2521158322044[/C][C]3.703298[/C][C]-2.2283[/C][C]0.030681[/C][C]0.015341[/C][/ROW]
[ROW][C]M8[/C][C]3.93545709541912[/C][C]4.331012[/C][C]0.9087[/C][C]0.368161[/C][C]0.18408[/C][/ROW]
[ROW][C]M9[/C][C]18.4126669470263[/C][C]4.191855[/C][C]4.3925[/C][C]6.3e-05[/C][C]3.2e-05[/C][/ROW]
[ROW][C]M10[/C][C]16.2965674288903[/C][C]3.42099[/C][C]4.7637[/C][C]1.9e-05[/C][C]9e-06[/C][/ROW]
[ROW][C]M11[/C][C]8.1710049734852[/C][C]3.12615[/C][C]2.6138[/C][C]0.011993[/C][C]0.005996[/C][/ROW]
[ROW][C]t[/C][C]-0.00480062061127904[/C][C]0.106805[/C][C]-0.0449[/C][C]0.96434[/C][C]0.48217[/C][/ROW]
[/TABLE]
Source: https://freestatistics.org/blog/index.php?pk=68388&T=2

Globally Unique Identifier (entire table): ba.freestatistics.org/blog/index.php?pk=68388&T=2

As an alternative you can also use a QR Code:  

The GUIDs for individual cells are displayed in the table below:

Multiple Linear Regression - Ordinary Least Squares
VariableParameterS.D.T-STATH0: parameter = 02-tail p-value1-tail p-value
(Intercept)122.25977757450020.1523486.066800
wrk-0.1852685313654940.137589-1.34650.1845890.092295
M1-0.4169783945690823.000392-0.1390.8900640.445032
M22.251993793887213.2885690.68480.4968370.248418
M311.10518322630553.5738073.10740.0031990.001599
M44.065963427727923.7933151.07190.2892490.144624
M51.759152860146244.2445220.41450.6804280.340214
M611.7892220121234.0848262.88610.0058740.002937
M7-8.25211583220443.703298-2.22830.0306810.015341
M83.935457095419124.3310120.90870.3681610.18408
M918.41266694702634.1918554.39256.3e-053.2e-05
M1016.29656742889033.420994.76371.9e-059e-06
M118.17100497348523.126152.61380.0119930.005996
t-0.004800620611279040.106805-0.04490.964340.48217


Multiple Linear Regression - Regression Statistics
Multiple R0.878574643479738
R-squared0.77189340416555
Adjusted R-squared0.708800090424106
F-TEST (value)12.2341553865560
F-TEST (DF numerator)13
F-TEST (DF denominator)47
p-value5.17779152886533e-11
Multiple Linear Regression - Residual Statistics
Residual Standard Deviation4.91781265256009
Sum Squared Residuals1136.68942042697

\begin{tabular}{lllllllll}
\hline
Multiple Linear Regression - Regression Statistics \tabularnewline
Multiple R & 0.878574643479738 \tabularnewline
R-squared & 0.77189340416555 \tabularnewline
Adjusted R-squared & 0.708800090424106 \tabularnewline
F-TEST (value) & 12.2341553865560 \tabularnewline
F-TEST (DF numerator) & 13 \tabularnewline
F-TEST (DF denominator) & 47 \tabularnewline
p-value & 5.17779152886533e-11 \tabularnewline
Multiple Linear Regression - Residual Statistics \tabularnewline
Residual Standard Deviation & 4.91781265256009 \tabularnewline
Sum Squared Residuals & 1136.68942042697 \tabularnewline
\hline
\end{tabular}
%Source: https://freestatistics.org/blog/index.php?pk=68388&T=3

[TABLE]
[ROW][C]Multiple Linear Regression - Regression Statistics[/C][/ROW]
[ROW][C]Multiple R[/C][C]0.878574643479738[/C][/ROW]
[ROW][C]R-squared[/C][C]0.77189340416555[/C][/ROW]
[ROW][C]Adjusted R-squared[/C][C]0.708800090424106[/C][/ROW]
[ROW][C]F-TEST (value)[/C][C]12.2341553865560[/C][/ROW]
[ROW][C]F-TEST (DF numerator)[/C][C]13[/C][/ROW]
[ROW][C]F-TEST (DF denominator)[/C][C]47[/C][/ROW]
[ROW][C]p-value[/C][C]5.17779152886533e-11[/C][/ROW]
[ROW][C]Multiple Linear Regression - Residual Statistics[/C][/ROW]
[ROW][C]Residual Standard Deviation[/C][C]4.91781265256009[/C][/ROW]
[ROW][C]Sum Squared Residuals[/C][C]1136.68942042697[/C][/ROW]
[/TABLE]
Source: https://freestatistics.org/blog/index.php?pk=68388&T=3

Globally Unique Identifier (entire table): ba.freestatistics.org/blog/index.php?pk=68388&T=3

As an alternative you can also use a QR Code:  

The GUIDs for individual cells are displayed in the table below:

Multiple Linear Regression - Regression Statistics
Multiple R0.878574643479738
R-squared0.77189340416555
Adjusted R-squared0.708800090424106
F-TEST (value)12.2341553865560
F-TEST (DF numerator)13
F-TEST (DF denominator)47
p-value5.17779152886533e-11
Multiple Linear Regression - Residual Statistics
Residual Standard Deviation4.91781265256009
Sum Squared Residuals1136.68942042697


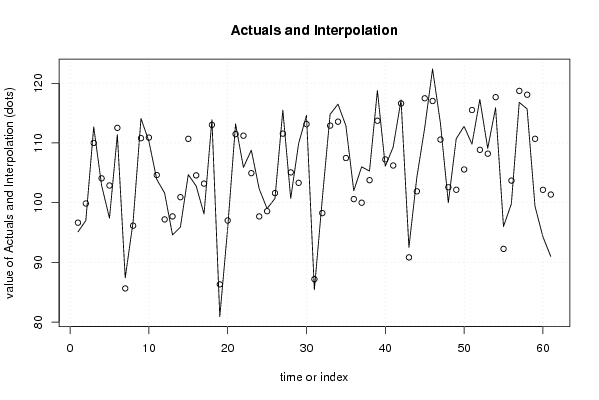
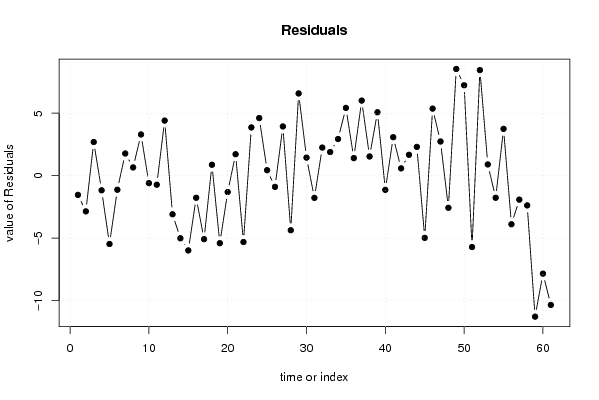
Multiple Linear Regression - Actuals, Interpolation, and Residuals
Time or IndexActualsInterpolationForecastResidualsPrediction Error
195.196.6414782936123-1.54147829361233
29799.8614554555538-2.86145545555379
3112.7110.0067239869192.69327601308074
4102.9104.074314755923-1.17431475592336
597.4102.874314755923-5.47431475592336
6111.4112.529046224558-1.12904622455787
787.485.62797209909591.77202790090412
896.896.14332762381870.656672376181293
9114.1110.8010053861803.29899461381989
10110.3110.903327623819-0.603327623818687
11103.9104.625649861457-0.725649861457294
12101.697.19091839282284.40908160717721
1394.697.69548203447-3.09548203446991
1495.9100.915459196411-5.01545919641138
15104.7110.690190665046-5.9901906650459
16102.8104.572512902684-1.77251290268450
1798.1103.187244371319-5.08724437131901
18113.9113.0272443713190.872755628681004
1980.986.3114387772225-5.41143877722252
2095.797.0120628333108-1.31206283331082
21113.2111.4844720643071.71552793569326
22105.9111.216257239214-5.31625723921435
23108.8104.9385794768533.86142052314706
24102.397.6891165395844.61088346041607
259998.5642172439620.435782756037974
26100.7101.598925874538-0.898925874538018
27115.5111.5589258745383.94107412546198
28100.7105.070711049446-4.37071104944563
29109.9103.3149054553496.58509454465086
30114.6113.1549054553491.44509454465084
3185.487.1801739867146-1.78017398671464
32100.598.2513351055342.24866489446606
33114.8112.9090128678951.89098713210466
34116.5113.5671406996302.93285930036957
35112.9107.4747314686355.4252685313655
36102100.5958055940961.40419440590352
3710699.98875804755066.01124195244937
38105.3103.7645408035891.53545919641140
39118.8113.7245408035895.07545919641139
40106.1107.236325978496-1.13632597849621
41109.3106.2215945098623.07840549013829
42117.2116.6174001039580.582599896041817
4392.590.82793716668921.67206283331082
44104.2101.8990982855082.30090171449153
45112.5117.483118704697-4.98311870469735
46122.4117.0296353482395.37036465176054
47113.3110.5666890545132.73331094548744
48100102.576151991782-2.57615199178157
49110.7102.1543729766018.54562702339879
50112.8105.5596186699087.2403813300918
51109.8115.519618669908-5.7196186699082
52117.3108.8461353134508.4538646865497
53109.1108.2019409075470.898059092453205
54115.9117.671403844816-1.77140384481580
559692.25247797027783.74752202972222
5699.8103.694176151828-3.89417615182807
57116.8118.722390976920-1.92239097692046
58115.7118.083639089097-2.38363908909708
5999.4110.694350138543-11.2943501385427
6094.3102.148007481715-7.84800748171523
6191101.355691403804-10.3556914038039

\begin{tabular}{lllllllll}
\hline
Multiple Linear Regression - Actuals, Interpolation, and Residuals \tabularnewline
Time or Index & Actuals & InterpolationForecast & ResidualsPrediction Error \tabularnewline
1 & 95.1 & 96.6414782936123 & -1.54147829361233 \tabularnewline
2 & 97 & 99.8614554555538 & -2.86145545555379 \tabularnewline
3 & 112.7 & 110.006723986919 & 2.69327601308074 \tabularnewline
4 & 102.9 & 104.074314755923 & -1.17431475592336 \tabularnewline
5 & 97.4 & 102.874314755923 & -5.47431475592336 \tabularnewline
6 & 111.4 & 112.529046224558 & -1.12904622455787 \tabularnewline
7 & 87.4 & 85.6279720990959 & 1.77202790090412 \tabularnewline
8 & 96.8 & 96.1433276238187 & 0.656672376181293 \tabularnewline
9 & 114.1 & 110.801005386180 & 3.29899461381989 \tabularnewline
10 & 110.3 & 110.903327623819 & -0.603327623818687 \tabularnewline
11 & 103.9 & 104.625649861457 & -0.725649861457294 \tabularnewline
12 & 101.6 & 97.1909183928228 & 4.40908160717721 \tabularnewline
13 & 94.6 & 97.69548203447 & -3.09548203446991 \tabularnewline
14 & 95.9 & 100.915459196411 & -5.01545919641138 \tabularnewline
15 & 104.7 & 110.690190665046 & -5.9901906650459 \tabularnewline
16 & 102.8 & 104.572512902684 & -1.77251290268450 \tabularnewline
17 & 98.1 & 103.187244371319 & -5.08724437131901 \tabularnewline
18 & 113.9 & 113.027244371319 & 0.872755628681004 \tabularnewline
19 & 80.9 & 86.3114387772225 & -5.41143877722252 \tabularnewline
20 & 95.7 & 97.0120628333108 & -1.31206283331082 \tabularnewline
21 & 113.2 & 111.484472064307 & 1.71552793569326 \tabularnewline
22 & 105.9 & 111.216257239214 & -5.31625723921435 \tabularnewline
23 & 108.8 & 104.938579476853 & 3.86142052314706 \tabularnewline
24 & 102.3 & 97.689116539584 & 4.61088346041607 \tabularnewline
25 & 99 & 98.564217243962 & 0.435782756037974 \tabularnewline
26 & 100.7 & 101.598925874538 & -0.898925874538018 \tabularnewline
27 & 115.5 & 111.558925874538 & 3.94107412546198 \tabularnewline
28 & 100.7 & 105.070711049446 & -4.37071104944563 \tabularnewline
29 & 109.9 & 103.314905455349 & 6.58509454465086 \tabularnewline
30 & 114.6 & 113.154905455349 & 1.44509454465084 \tabularnewline
31 & 85.4 & 87.1801739867146 & -1.78017398671464 \tabularnewline
32 & 100.5 & 98.251335105534 & 2.24866489446606 \tabularnewline
33 & 114.8 & 112.909012867895 & 1.89098713210466 \tabularnewline
34 & 116.5 & 113.567140699630 & 2.93285930036957 \tabularnewline
35 & 112.9 & 107.474731468635 & 5.4252685313655 \tabularnewline
36 & 102 & 100.595805594096 & 1.40419440590352 \tabularnewline
37 & 106 & 99.9887580475506 & 6.01124195244937 \tabularnewline
38 & 105.3 & 103.764540803589 & 1.53545919641140 \tabularnewline
39 & 118.8 & 113.724540803589 & 5.07545919641139 \tabularnewline
40 & 106.1 & 107.236325978496 & -1.13632597849621 \tabularnewline
41 & 109.3 & 106.221594509862 & 3.07840549013829 \tabularnewline
42 & 117.2 & 116.617400103958 & 0.582599896041817 \tabularnewline
43 & 92.5 & 90.8279371666892 & 1.67206283331082 \tabularnewline
44 & 104.2 & 101.899098285508 & 2.30090171449153 \tabularnewline
45 & 112.5 & 117.483118704697 & -4.98311870469735 \tabularnewline
46 & 122.4 & 117.029635348239 & 5.37036465176054 \tabularnewline
47 & 113.3 & 110.566689054513 & 2.73331094548744 \tabularnewline
48 & 100 & 102.576151991782 & -2.57615199178157 \tabularnewline
49 & 110.7 & 102.154372976601 & 8.54562702339879 \tabularnewline
50 & 112.8 & 105.559618669908 & 7.2403813300918 \tabularnewline
51 & 109.8 & 115.519618669908 & -5.7196186699082 \tabularnewline
52 & 117.3 & 108.846135313450 & 8.4538646865497 \tabularnewline
53 & 109.1 & 108.201940907547 & 0.898059092453205 \tabularnewline
54 & 115.9 & 117.671403844816 & -1.77140384481580 \tabularnewline
55 & 96 & 92.2524779702778 & 3.74752202972222 \tabularnewline
56 & 99.8 & 103.694176151828 & -3.89417615182807 \tabularnewline
57 & 116.8 & 118.722390976920 & -1.92239097692046 \tabularnewline
58 & 115.7 & 118.083639089097 & -2.38363908909708 \tabularnewline
59 & 99.4 & 110.694350138543 & -11.2943501385427 \tabularnewline
60 & 94.3 & 102.148007481715 & -7.84800748171523 \tabularnewline
61 & 91 & 101.355691403804 & -10.3556914038039 \tabularnewline
\hline
\end{tabular}
%Source: https://freestatistics.org/blog/index.php?pk=68388&T=4

[TABLE]
[ROW][C]Multiple Linear Regression - Actuals, Interpolation, and Residuals[/C][/ROW]
[ROW][C]Time or Index[/C][C]Actuals[/C][C]InterpolationForecast[/C][C]ResidualsPrediction Error[/C][/ROW]
[ROW][C]1[/C][C]95.1[/C][C]96.6414782936123[/C][C]-1.54147829361233[/C][/ROW]
[ROW][C]2[/C][C]97[/C][C]99.8614554555538[/C][C]-2.86145545555379[/C][/ROW]
[ROW][C]3[/C][C]112.7[/C][C]110.006723986919[/C][C]2.69327601308074[/C][/ROW]
[ROW][C]4[/C][C]102.9[/C][C]104.074314755923[/C][C]-1.17431475592336[/C][/ROW]
[ROW][C]5[/C][C]97.4[/C][C]102.874314755923[/C][C]-5.47431475592336[/C][/ROW]
[ROW][C]6[/C][C]111.4[/C][C]112.529046224558[/C][C]-1.12904622455787[/C][/ROW]
[ROW][C]7[/C][C]87.4[/C][C]85.6279720990959[/C][C]1.77202790090412[/C][/ROW]
[ROW][C]8[/C][C]96.8[/C][C]96.1433276238187[/C][C]0.656672376181293[/C][/ROW]
[ROW][C]9[/C][C]114.1[/C][C]110.801005386180[/C][C]3.29899461381989[/C][/ROW]
[ROW][C]10[/C][C]110.3[/C][C]110.903327623819[/C][C]-0.603327623818687[/C][/ROW]
[ROW][C]11[/C][C]103.9[/C][C]104.625649861457[/C][C]-0.725649861457294[/C][/ROW]
[ROW][C]12[/C][C]101.6[/C][C]97.1909183928228[/C][C]4.40908160717721[/C][/ROW]
[ROW][C]13[/C][C]94.6[/C][C]97.69548203447[/C][C]-3.09548203446991[/C][/ROW]
[ROW][C]14[/C][C]95.9[/C][C]100.915459196411[/C][C]-5.01545919641138[/C][/ROW]
[ROW][C]15[/C][C]104.7[/C][C]110.690190665046[/C][C]-5.9901906650459[/C][/ROW]
[ROW][C]16[/C][C]102.8[/C][C]104.572512902684[/C][C]-1.77251290268450[/C][/ROW]
[ROW][C]17[/C][C]98.1[/C][C]103.187244371319[/C][C]-5.08724437131901[/C][/ROW]
[ROW][C]18[/C][C]113.9[/C][C]113.027244371319[/C][C]0.872755628681004[/C][/ROW]
[ROW][C]19[/C][C]80.9[/C][C]86.3114387772225[/C][C]-5.41143877722252[/C][/ROW]
[ROW][C]20[/C][C]95.7[/C][C]97.0120628333108[/C][C]-1.31206283331082[/C][/ROW]
[ROW][C]21[/C][C]113.2[/C][C]111.484472064307[/C][C]1.71552793569326[/C][/ROW]
[ROW][C]22[/C][C]105.9[/C][C]111.216257239214[/C][C]-5.31625723921435[/C][/ROW]
[ROW][C]23[/C][C]108.8[/C][C]104.938579476853[/C][C]3.86142052314706[/C][/ROW]
[ROW][C]24[/C][C]102.3[/C][C]97.689116539584[/C][C]4.61088346041607[/C][/ROW]
[ROW][C]25[/C][C]99[/C][C]98.564217243962[/C][C]0.435782756037974[/C][/ROW]
[ROW][C]26[/C][C]100.7[/C][C]101.598925874538[/C][C]-0.898925874538018[/C][/ROW]
[ROW][C]27[/C][C]115.5[/C][C]111.558925874538[/C][C]3.94107412546198[/C][/ROW]
[ROW][C]28[/C][C]100.7[/C][C]105.070711049446[/C][C]-4.37071104944563[/C][/ROW]
[ROW][C]29[/C][C]109.9[/C][C]103.314905455349[/C][C]6.58509454465086[/C][/ROW]
[ROW][C]30[/C][C]114.6[/C][C]113.154905455349[/C][C]1.44509454465084[/C][/ROW]
[ROW][C]31[/C][C]85.4[/C][C]87.1801739867146[/C][C]-1.78017398671464[/C][/ROW]
[ROW][C]32[/C][C]100.5[/C][C]98.251335105534[/C][C]2.24866489446606[/C][/ROW]
[ROW][C]33[/C][C]114.8[/C][C]112.909012867895[/C][C]1.89098713210466[/C][/ROW]
[ROW][C]34[/C][C]116.5[/C][C]113.567140699630[/C][C]2.93285930036957[/C][/ROW]
[ROW][C]35[/C][C]112.9[/C][C]107.474731468635[/C][C]5.4252685313655[/C][/ROW]
[ROW][C]36[/C][C]102[/C][C]100.595805594096[/C][C]1.40419440590352[/C][/ROW]
[ROW][C]37[/C][C]106[/C][C]99.9887580475506[/C][C]6.01124195244937[/C][/ROW]
[ROW][C]38[/C][C]105.3[/C][C]103.764540803589[/C][C]1.53545919641140[/C][/ROW]
[ROW][C]39[/C][C]118.8[/C][C]113.724540803589[/C][C]5.07545919641139[/C][/ROW]
[ROW][C]40[/C][C]106.1[/C][C]107.236325978496[/C][C]-1.13632597849621[/C][/ROW]
[ROW][C]41[/C][C]109.3[/C][C]106.221594509862[/C][C]3.07840549013829[/C][/ROW]
[ROW][C]42[/C][C]117.2[/C][C]116.617400103958[/C][C]0.582599896041817[/C][/ROW]
[ROW][C]43[/C][C]92.5[/C][C]90.8279371666892[/C][C]1.67206283331082[/C][/ROW]
[ROW][C]44[/C][C]104.2[/C][C]101.899098285508[/C][C]2.30090171449153[/C][/ROW]
[ROW][C]45[/C][C]112.5[/C][C]117.483118704697[/C][C]-4.98311870469735[/C][/ROW]
[ROW][C]46[/C][C]122.4[/C][C]117.029635348239[/C][C]5.37036465176054[/C][/ROW]
[ROW][C]47[/C][C]113.3[/C][C]110.566689054513[/C][C]2.73331094548744[/C][/ROW]
[ROW][C]48[/C][C]100[/C][C]102.576151991782[/C][C]-2.57615199178157[/C][/ROW]
[ROW][C]49[/C][C]110.7[/C][C]102.154372976601[/C][C]8.54562702339879[/C][/ROW]
[ROW][C]50[/C][C]112.8[/C][C]105.559618669908[/C][C]7.2403813300918[/C][/ROW]
[ROW][C]51[/C][C]109.8[/C][C]115.519618669908[/C][C]-5.7196186699082[/C][/ROW]
[ROW][C]52[/C][C]117.3[/C][C]108.846135313450[/C][C]8.4538646865497[/C][/ROW]
[ROW][C]53[/C][C]109.1[/C][C]108.201940907547[/C][C]0.898059092453205[/C][/ROW]
[ROW][C]54[/C][C]115.9[/C][C]117.671403844816[/C][C]-1.77140384481580[/C][/ROW]
[ROW][C]55[/C][C]96[/C][C]92.2524779702778[/C][C]3.74752202972222[/C][/ROW]
[ROW][C]56[/C][C]99.8[/C][C]103.694176151828[/C][C]-3.89417615182807[/C][/ROW]
[ROW][C]57[/C][C]116.8[/C][C]118.722390976920[/C][C]-1.92239097692046[/C][/ROW]
[ROW][C]58[/C][C]115.7[/C][C]118.083639089097[/C][C]-2.38363908909708[/C][/ROW]
[ROW][C]59[/C][C]99.4[/C][C]110.694350138543[/C][C]-11.2943501385427[/C][/ROW]
[ROW][C]60[/C][C]94.3[/C][C]102.148007481715[/C][C]-7.84800748171523[/C][/ROW]
[ROW][C]61[/C][C]91[/C][C]101.355691403804[/C][C]-10.3556914038039[/C][/ROW]
[/TABLE]
Source: https://freestatistics.org/blog/index.php?pk=68388&T=4

Globally Unique Identifier (entire table): ba.freestatistics.org/blog/index.php?pk=68388&T=4

As an alternative you can also use a QR Code:  

The GUIDs for individual cells are displayed in the table below:

Multiple Linear Regression - Actuals, Interpolation, and Residuals
Time or IndexActualsInterpolationForecastResidualsPrediction Error
195.196.6414782936123-1.54147829361233
29799.8614554555538-2.86145545555379
3112.7110.0067239869192.69327601308074
4102.9104.074314755923-1.17431475592336
597.4102.874314755923-5.47431475592336
6111.4112.529046224558-1.12904622455787
787.485.62797209909591.77202790090412
896.896.14332762381870.656672376181293
9114.1110.8010053861803.29899461381989
10110.3110.903327623819-0.603327623818687
11103.9104.625649861457-0.725649861457294
12101.697.19091839282284.40908160717721
1394.697.69548203447-3.09548203446991
1495.9100.915459196411-5.01545919641138
15104.7110.690190665046-5.9901906650459
16102.8104.572512902684-1.77251290268450
1798.1103.187244371319-5.08724437131901
18113.9113.0272443713190.872755628681004
1980.986.3114387772225-5.41143877722252
2095.797.0120628333108-1.31206283331082
21113.2111.4844720643071.71552793569326
22105.9111.216257239214-5.31625723921435
23108.8104.9385794768533.86142052314706
24102.397.6891165395844.61088346041607
259998.5642172439620.435782756037974
26100.7101.598925874538-0.898925874538018
27115.5111.5589258745383.94107412546198
28100.7105.070711049446-4.37071104944563
29109.9103.3149054553496.58509454465086
30114.6113.1549054553491.44509454465084
3185.487.1801739867146-1.78017398671464
32100.598.2513351055342.24866489446606
33114.8112.9090128678951.89098713210466
34116.5113.5671406996302.93285930036957
35112.9107.4747314686355.4252685313655
36102100.5958055940961.40419440590352
3710699.98875804755066.01124195244937
38105.3103.7645408035891.53545919641140
39118.8113.7245408035895.07545919641139
40106.1107.236325978496-1.13632597849621
41109.3106.2215945098623.07840549013829
42117.2116.6174001039580.582599896041817
4392.590.82793716668921.67206283331082
44104.2101.8990982855082.30090171449153
45112.5117.483118704697-4.98311870469735
46122.4117.0296353482395.37036465176054
47113.3110.5666890545132.73331094548744
48100102.576151991782-2.57615199178157
49110.7102.1543729766018.54562702339879
50112.8105.5596186699087.2403813300918
51109.8115.519618669908-5.7196186699082
52117.3108.8461353134508.4538646865497
53109.1108.2019409075470.898059092453205
54115.9117.671403844816-1.77140384481580
559692.25247797027783.74752202972222
5699.8103.694176151828-3.89417615182807
57116.8118.722390976920-1.92239097692046
58115.7118.083639089097-2.38363908909708
5999.4110.694350138543-11.2943501385427
6094.3102.148007481715-7.84800748171523
6191101.355691403804-10.3556914038039


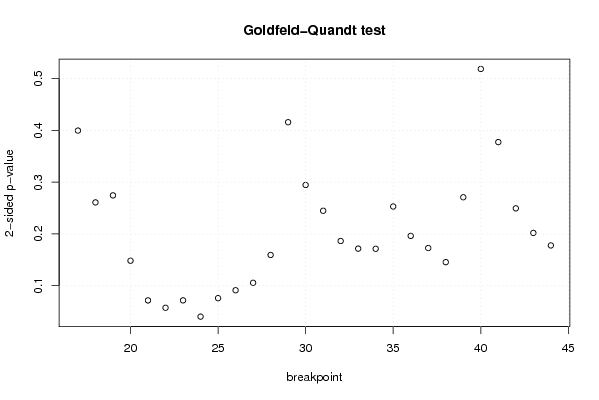
Goldfeld-Quandt test for Heteroskedasticity
p-valuesAlternative Hypothesis
breakpoint indexgreater2-sidedless
170.1998768998677260.3997537997354510.800123100132274
180.1304456390829200.2608912781658390.86955436091708
190.1372346877613940.2744693755227880.862765312238606
200.07405376188288470.1481075237657690.925946238117115
210.03570706790046140.07141413580092280.964292932099539
220.02857464402887040.05714928805774070.97142535597113
230.03576151942757010.07152303885514010.96423848057243
240.0199925740078530.0399851480157060.980007425992147
250.03786959789113410.07573919578226810.962130402108866
260.04551883250954280.09103766501908560.954481167490457
270.05271389513697690.1054277902739540.947286104863023
280.07963222045516510.1592644409103300.920367779544835
290.2079574616207410.4159149232414820.792042538379259
300.1472926130971860.2945852261943710.852707386902814
310.1223485892887780.2446971785775560.877651410711222
320.09313611659397590.1862722331879520.906863883406024
330.08574132608288350.1714826521657670.914258673917117
340.0856227680307170.1712455360614340.914377231969283
350.1264656843731530.2529313687463070.873534315626847
360.09805721657744290.1961144331548860.901942783422557
370.08632693048463280.1726538609692660.913673069515367
380.07268286354278880.1453657270855780.927317136457211
390.1353939817691290.2707879635382580.864606018230871
400.2594518186604780.5189036373209560.740548181339522
410.1887425633717020.3774851267434050.811257436628298
420.1246886111263300.2493772222526590.87531138887367
430.1009591054500930.2019182109001870.899040894549907
440.0888482510011770.1776965020023540.911151748998823

\begin{tabular}{lllllllll}
\hline
Goldfeld-Quandt test for Heteroskedasticity \tabularnewline
p-values & Alternative Hypothesis \tabularnewline
breakpoint index & greater & 2-sided & less \tabularnewline
17 & 0.199876899867726 & 0.399753799735451 & 0.800123100132274 \tabularnewline
18 & 0.130445639082920 & 0.260891278165839 & 0.86955436091708 \tabularnewline
19 & 0.137234687761394 & 0.274469375522788 & 0.862765312238606 \tabularnewline
20 & 0.0740537618828847 & 0.148107523765769 & 0.925946238117115 \tabularnewline
21 & 0.0357070679004614 & 0.0714141358009228 & 0.964292932099539 \tabularnewline
22 & 0.0285746440288704 & 0.0571492880577407 & 0.97142535597113 \tabularnewline
23 & 0.0357615194275701 & 0.0715230388551401 & 0.96423848057243 \tabularnewline
24 & 0.019992574007853 & 0.039985148015706 & 0.980007425992147 \tabularnewline
25 & 0.0378695978911341 & 0.0757391957822681 & 0.962130402108866 \tabularnewline
26 & 0.0455188325095428 & 0.0910376650190856 & 0.954481167490457 \tabularnewline
27 & 0.0527138951369769 & 0.105427790273954 & 0.947286104863023 \tabularnewline
28 & 0.0796322204551651 & 0.159264440910330 & 0.920367779544835 \tabularnewline
29 & 0.207957461620741 & 0.415914923241482 & 0.792042538379259 \tabularnewline
30 & 0.147292613097186 & 0.294585226194371 & 0.852707386902814 \tabularnewline
31 & 0.122348589288778 & 0.244697178577556 & 0.877651410711222 \tabularnewline
32 & 0.0931361165939759 & 0.186272233187952 & 0.906863883406024 \tabularnewline
33 & 0.0857413260828835 & 0.171482652165767 & 0.914258673917117 \tabularnewline
34 & 0.085622768030717 & 0.171245536061434 & 0.914377231969283 \tabularnewline
35 & 0.126465684373153 & 0.252931368746307 & 0.873534315626847 \tabularnewline
36 & 0.0980572165774429 & 0.196114433154886 & 0.901942783422557 \tabularnewline
37 & 0.0863269304846328 & 0.172653860969266 & 0.913673069515367 \tabularnewline
38 & 0.0726828635427888 & 0.145365727085578 & 0.927317136457211 \tabularnewline
39 & 0.135393981769129 & 0.270787963538258 & 0.864606018230871 \tabularnewline
40 & 0.259451818660478 & 0.518903637320956 & 0.740548181339522 \tabularnewline
41 & 0.188742563371702 & 0.377485126743405 & 0.811257436628298 \tabularnewline
42 & 0.124688611126330 & 0.249377222252659 & 0.87531138887367 \tabularnewline
43 & 0.100959105450093 & 0.201918210900187 & 0.899040894549907 \tabularnewline
44 & 0.088848251001177 & 0.177696502002354 & 0.911151748998823 \tabularnewline
\hline
\end{tabular}
%Source: https://freestatistics.org/blog/index.php?pk=68388&T=5

[TABLE]
[ROW][C]Goldfeld-Quandt test for Heteroskedasticity[/C][/ROW]
[ROW][C]p-values[/C][C]Alternative Hypothesis[/C][/ROW]
[ROW][C]breakpoint index[/C][C]greater[/C][C]2-sided[/C][C]less[/C][/ROW]
[ROW][C]17[/C][C]0.199876899867726[/C][C]0.399753799735451[/C][C]0.800123100132274[/C][/ROW]
[ROW][C]18[/C][C]0.130445639082920[/C][C]0.260891278165839[/C][C]0.86955436091708[/C][/ROW]
[ROW][C]19[/C][C]0.137234687761394[/C][C]0.274469375522788[/C][C]0.862765312238606[/C][/ROW]
[ROW][C]20[/C][C]0.0740537618828847[/C][C]0.148107523765769[/C][C]0.925946238117115[/C][/ROW]
[ROW][C]21[/C][C]0.0357070679004614[/C][C]0.0714141358009228[/C][C]0.964292932099539[/C][/ROW]
[ROW][C]22[/C][C]0.0285746440288704[/C][C]0.0571492880577407[/C][C]0.97142535597113[/C][/ROW]
[ROW][C]23[/C][C]0.0357615194275701[/C][C]0.0715230388551401[/C][C]0.96423848057243[/C][/ROW]
[ROW][C]24[/C][C]0.019992574007853[/C][C]0.039985148015706[/C][C]0.980007425992147[/C][/ROW]
[ROW][C]25[/C][C]0.0378695978911341[/C][C]0.0757391957822681[/C][C]0.962130402108866[/C][/ROW]
[ROW][C]26[/C][C]0.0455188325095428[/C][C]0.0910376650190856[/C][C]0.954481167490457[/C][/ROW]
[ROW][C]27[/C][C]0.0527138951369769[/C][C]0.105427790273954[/C][C]0.947286104863023[/C][/ROW]
[ROW][C]28[/C][C]0.0796322204551651[/C][C]0.159264440910330[/C][C]0.920367779544835[/C][/ROW]
[ROW][C]29[/C][C]0.207957461620741[/C][C]0.415914923241482[/C][C]0.792042538379259[/C][/ROW]
[ROW][C]30[/C][C]0.147292613097186[/C][C]0.294585226194371[/C][C]0.852707386902814[/C][/ROW]
[ROW][C]31[/C][C]0.122348589288778[/C][C]0.244697178577556[/C][C]0.877651410711222[/C][/ROW]
[ROW][C]32[/C][C]0.0931361165939759[/C][C]0.186272233187952[/C][C]0.906863883406024[/C][/ROW]
[ROW][C]33[/C][C]0.0857413260828835[/C][C]0.171482652165767[/C][C]0.914258673917117[/C][/ROW]
[ROW][C]34[/C][C]0.085622768030717[/C][C]0.171245536061434[/C][C]0.914377231969283[/C][/ROW]
[ROW][C]35[/C][C]0.126465684373153[/C][C]0.252931368746307[/C][C]0.873534315626847[/C][/ROW]
[ROW][C]36[/C][C]0.0980572165774429[/C][C]0.196114433154886[/C][C]0.901942783422557[/C][/ROW]
[ROW][C]37[/C][C]0.0863269304846328[/C][C]0.172653860969266[/C][C]0.913673069515367[/C][/ROW]
[ROW][C]38[/C][C]0.0726828635427888[/C][C]0.145365727085578[/C][C]0.927317136457211[/C][/ROW]
[ROW][C]39[/C][C]0.135393981769129[/C][C]0.270787963538258[/C][C]0.864606018230871[/C][/ROW]
[ROW][C]40[/C][C]0.259451818660478[/C][C]0.518903637320956[/C][C]0.740548181339522[/C][/ROW]
[ROW][C]41[/C][C]0.188742563371702[/C][C]0.377485126743405[/C][C]0.811257436628298[/C][/ROW]
[ROW][C]42[/C][C]0.124688611126330[/C][C]0.249377222252659[/C][C]0.87531138887367[/C][/ROW]
[ROW][C]43[/C][C]0.100959105450093[/C][C]0.201918210900187[/C][C]0.899040894549907[/C][/ROW]
[ROW][C]44[/C][C]0.088848251001177[/C][C]0.177696502002354[/C][C]0.911151748998823[/C][/ROW]
[/TABLE]
Source: https://freestatistics.org/blog/index.php?pk=68388&T=5

Globally Unique Identifier (entire table): ba.freestatistics.org/blog/index.php?pk=68388&T=5

As an alternative you can also use a QR Code:  

The GUIDs for individual cells are displayed in the table below:

Goldfeld-Quandt test for Heteroskedasticity
p-valuesAlternative Hypothesis
breakpoint indexgreater2-sidedless
170.1998768998677260.3997537997354510.800123100132274
180.1304456390829200.2608912781658390.86955436091708
190.1372346877613940.2744693755227880.862765312238606
200.07405376188288470.1481075237657690.925946238117115
210.03570706790046140.07141413580092280.964292932099539
220.02857464402887040.05714928805774070.97142535597113
230.03576151942757010.07152303885514010.96423848057243
240.0199925740078530.0399851480157060.980007425992147
250.03786959789113410.07573919578226810.962130402108866
260.04551883250954280.09103766501908560.954481167490457
270.05271389513697690.1054277902739540.947286104863023
280.07963222045516510.1592644409103300.920367779544835
290.2079574616207410.4159149232414820.792042538379259
300.1472926130971860.2945852261943710.852707386902814
310.1223485892887780.2446971785775560.877651410711222
320.09313611659397590.1862722331879520.906863883406024
330.08574132608288350.1714826521657670.914258673917117
340.0856227680307170.1712455360614340.914377231969283
350.1264656843731530.2529313687463070.873534315626847
360.09805721657744290.1961144331548860.901942783422557
370.08632693048463280.1726538609692660.913673069515367
380.07268286354278880.1453657270855780.927317136457211
390.1353939817691290.2707879635382580.864606018230871
400.2594518186604780.5189036373209560.740548181339522
410.1887425633717020.3774851267434050.811257436628298
420.1246886111263300.2493772222526590.87531138887367
430.1009591054500930.2019182109001870.899040894549907
440.0888482510011770.1776965020023540.911151748998823


Meta Analysis of Goldfeld-Quandt test for Heteroskedasticity
Description# significant tests% significant testsOK/NOK
1% type I error level00OK
5% type I error level10.0357142857142857OK
10% type I error level60.214285714285714NOK

\begin{tabular}{lllllllll}
\hline
Meta Analysis of Goldfeld-Quandt test for Heteroskedasticity \tabularnewline
Description & # significant tests & % significant tests & OK/NOK \tabularnewline
1% type I error level & 0 & 0 & OK \tabularnewline
5% type I error level & 1 & 0.0357142857142857 & OK \tabularnewline
10% type I error level & 6 & 0.214285714285714 & NOK \tabularnewline
\hline
\end{tabular}
%Source: https://freestatistics.org/blog/index.php?pk=68388&T=6

[TABLE]
[ROW][C]Meta Analysis of Goldfeld-Quandt test for Heteroskedasticity[/C][/ROW]
[ROW][C]Description[/C][C]# significant tests[/C][C]% significant tests[/C][C]OK/NOK[/C][/ROW]
[ROW][C]1% type I error level[/C][C]0[/C][C]0[/C][C]OK[/C][/ROW]
[ROW][C]5% type I error level[/C][C]1[/C][C]0.0357142857142857[/C][C]OK[/C][/ROW]
[ROW][C]10% type I error level[/C][C]6[/C][C]0.214285714285714[/C][C]NOK[/C][/ROW]
[/TABLE]
Source: https://freestatistics.org/blog/index.php?pk=68388&T=6

Globally Unique Identifier (entire table): ba.freestatistics.org/blog/index.php?pk=68388&T=6

As an alternative you can also use a QR Code:  

The GUIDs for individual cells are displayed in the table below:

Meta Analysis of Goldfeld-Quandt test for Heteroskedasticity
Description# significant tests% significant testsOK/NOK
1% type I error level00OK
5% type I error level10.0357142857142857OK
10% type I error level60.214285714285714NOK


Parameters (Session):
par1 = 1 ; par2 = Include Monthly Dummies ; par3 = Linear Trend ;
Parameters (R input):
par1 = 1 ; par2 = Include Monthly Dummies ; par3 = Linear Trend ;
R code (references can be found in the software module):
library(lattice)
library(lmtest)
n25 <- 25 #minimum number of obs. for Goldfeld-Quandt test
par1 <- as.numeric(par1)
x <- t(y)
k <- length(x[1,])
n <- length(x[,1])
x1 <- cbind(x[,par1], x[,1:k!=par1])
mycolnames <- c(colnames(x)[par1], colnames(x)[1:k!=par1])
colnames(x1) <- mycolnames #colnames(x)[par1]
x <- x1
if (par3 == 'First Differences'){
x2 <- array(0, dim=c(n-1,k), dimnames=list(1:(n-1), paste('(1-B)',colnames(x),sep='')))
for (i in 1:n-1) {
for (j in 1:k) {
x2[i,j] <- x[i+1,j] - x[i,j]
}
}
x <- x2
}
if (par2 == 'Include Monthly Dummies'){
x2 <- array(0, dim=c(n,11), dimnames=list(1:n, paste('M', seq(1:11), sep ='')))
for (i in 1:11){
x2[seq(i,n,12),i] <- 1
}
x <- cbind(x, x2)
}
if (par2 == 'Include Quarterly Dummies'){
x2 <- array(0, dim=c(n,3), dimnames=list(1:n, paste('Q', seq(1:3), sep ='')))
for (i in 1:3){
x2[seq(i,n,4),i] <- 1
}
x <- cbind(x, x2)
}
k <- length(x[1,])
if (par3 == 'Linear Trend'){
x <- cbind(x, c(1:n))
colnames(x)[k+1] <- 't'
}
x
k <- length(x[1,])
df <- as.data.frame(x)
(mylm <- lm(df))
(mysum <- summary(mylm))
if (n > n25) {
kp3 <- k + 3
nmkm3 <- n - k - 3
gqarr <- array(NA, dim=c(nmkm3-kp3+1,3))
numgqtests <- 0
numsignificant1 <- 0
numsignificant5 <- 0
numsignificant10 <- 0
for (mypoint in kp3:nmkm3) {
j <- 0
numgqtests <- numgqtests + 1
for (myalt in c('greater', 'two.sided', 'less')) {
j <- j + 1
gqarr[mypoint-kp3+1,j] <- gqtest(mylm, point=mypoint, alternative=myalt)$p.value
}
if (gqarr[mypoint-kp3+1,2] < 0.01) numsignificant1 <- numsignificant1 + 1
if (gqarr[mypoint-kp3+1,2] < 0.05) numsignificant5 <- numsignificant5 + 1
if (gqarr[mypoint-kp3+1,2] < 0.10) numsignificant10 <- numsignificant10 + 1
}
gqarr
}
bitmap(file='test0.png')
plot(x[,1], type='l', main='Actuals and Interpolation', ylab='value of Actuals and Interpolation (dots)', xlab='time or index')
points(x[,1]-mysum$resid)
grid()
dev.off()
bitmap(file='test1.png')
plot(mysum$resid, type='b', pch=19, main='Residuals', ylab='value of Residuals', xlab='time or index')
grid()
dev.off()
bitmap(file='test2.png')
hist(mysum$resid, main='Residual Histogram', xlab='values of Residuals')
grid()
dev.off()
bitmap(file='test3.png')
densityplot(~mysum$resid,col='black',main='Residual Density Plot', xlab='values of Residuals')
dev.off()
bitmap(file='test4.png')
qqnorm(mysum$resid, main='Residual Normal Q-Q Plot')
qqline(mysum$resid)
grid()
dev.off()
(myerror <- as.ts(mysum$resid))
bitmap(file='test5.png')
dum <- cbind(lag(myerror,k=1),myerror)
dum
dum1 <- dum[2:length(myerror),]
dum1
z <- as.data.frame(dum1)
z
plot(z,main=paste('Residual Lag plot, lowess, and regression line'), ylab='values of Residuals', xlab='lagged values of Residuals')
lines(lowess(z))
abline(lm(z))
grid()
dev.off()
bitmap(file='test6.png')
acf(mysum$resid, lag.max=length(mysum$resid)/2, main='Residual Autocorrelation Function')
grid()
dev.off()
bitmap(file='test7.png')
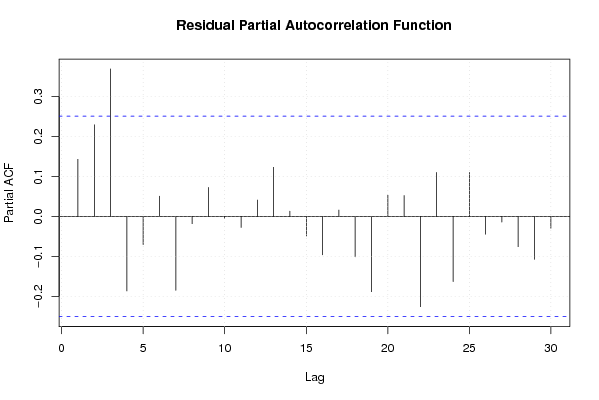
pacf(mysum$resid, lag.max=length(mysum$resid)/2, main='Residual Partial Autocorrelation Function')
grid()
dev.off()
bitmap(file='test8.png')
opar <- par(mfrow = c(2,2), oma = c(0, 0, 1.1, 0))
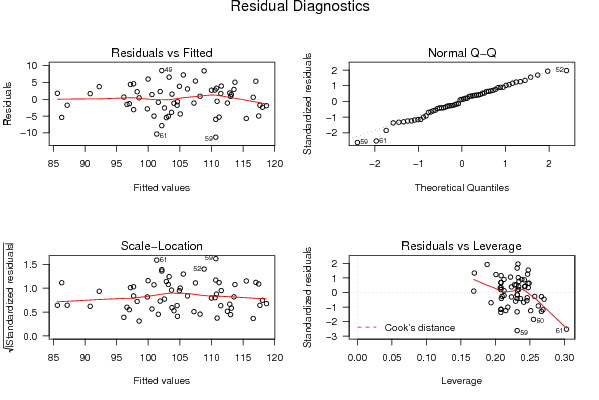
plot(mylm, las = 1, sub='Residual Diagnostics')
par(opar)
dev.off()
if (n > n25) {
bitmap(file='test9.png')
plot(kp3:nmkm3,gqarr[,2], main='Goldfeld-Quandt test',ylab='2-sided p-value',xlab='breakpoint')
grid()
dev.off()
}
load(file='createtable')
a<-table.start()
a<-table.row.start(a)
a<-table.element(a, 'Multiple Linear Regression - Estimated Regression Equation', 1, TRUE)
a<-table.row.end(a)
myeq <- colnames(x)[1]
myeq <- paste(myeq, '[t] = ', sep='')
for (i in 1:k){
if (mysum$coefficients[i,1] > 0) myeq <- paste(myeq, '+', '')
myeq <- paste(myeq, mysum$coefficients[i,1], sep=' ')
if (rownames(mysum$coefficients)[i] != '(Intercept)') {
myeq <- paste(myeq, rownames(mysum$coefficients)[i], sep='')
if (rownames(mysum$coefficients)[i] != 't') myeq <- paste(myeq, '[t]', sep='')
}
}
myeq <- paste(myeq, ' + e[t]')
a<-table.row.start(a)
a<-table.element(a, myeq)
a<-table.row.end(a)
a<-table.end(a)
table.save(a,file='mytable1.tab')
a<-table.start()
a<-table.row.start(a)
a<-table.element(a,hyperlink('ols1.htm','Multiple Linear Regression - Ordinary Least Squares',''), 6, TRUE)
a<-table.row.end(a)
a<-table.row.start(a)
a<-table.element(a,'Variable',header=TRUE)
a<-table.element(a,'Parameter',header=TRUE)
a<-table.element(a,'S.D.',header=TRUE)
a<-table.element(a,'T-STAT
H0: parameter = 0',header=TRUE)
a<-table.element(a,'2-tail p-value',header=TRUE)
a<-table.element(a,'1-tail p-value',header=TRUE)
a<-table.row.end(a)
for (i in 1:k){
a<-table.row.start(a)
a<-table.element(a,rownames(mysum$coefficients)[i],header=TRUE)
a<-table.element(a,mysum$coefficients[i,1])
a<-table.element(a, round(mysum$coefficients[i,2],6))
a<-table.element(a, round(mysum$coefficients[i,3],4))
a<-table.element(a, round(mysum$coefficients[i,4],6))
a<-table.element(a, round(mysum$coefficients[i,4]/2,6))
a<-table.row.end(a)
}
a<-table.end(a)
table.save(a,file='mytable2.tab')
a<-table.start()
a<-table.row.start(a)
a<-table.element(a, 'Multiple Linear Regression - Regression Statistics', 2, TRUE)
a<-table.row.end(a)
a<-table.row.start(a)
a<-table.element(a, 'Multiple R',1,TRUE)
a<-table.element(a, sqrt(mysum$r.squared))
a<-table.row.end(a)
a<-table.row.start(a)
a<-table.element(a, 'R-squared',1,TRUE)
a<-table.element(a, mysum$r.squared)
a<-table.row.end(a)
a<-table.row.start(a)
a<-table.element(a, 'Adjusted R-squared',1,TRUE)
a<-table.element(a, mysum$adj.r.squared)
a<-table.row.end(a)
a<-table.row.start(a)
a<-table.element(a, 'F-TEST (value)',1,TRUE)
a<-table.element(a, mysum$fstatistic[1])
a<-table.row.end(a)
a<-table.row.start(a)
a<-table.element(a, 'F-TEST (DF numerator)',1,TRUE)
a<-table.element(a, mysum$fstatistic[2])
a<-table.row.end(a)
a<-table.row.start(a)
a<-table.element(a, 'F-TEST (DF denominator)',1,TRUE)
a<-table.element(a, mysum$fstatistic[3])
a<-table.row.end(a)
a<-table.row.start(a)
a<-table.element(a, 'p-value',1,TRUE)
a<-table.element(a, 1-pf(mysum$fstatistic[1],mysum$fstatistic[2],mysum$fstatistic[3]))
a<-table.row.end(a)
a<-table.row.start(a)
a<-table.element(a, 'Multiple Linear Regression - Residual Statistics', 2, TRUE)
a<-table.row.end(a)
a<-table.row.start(a)
a<-table.element(a, 'Residual Standard Deviation',1,TRUE)
a<-table.element(a, mysum$sigma)
a<-table.row.end(a)
a<-table.row.start(a)
a<-table.element(a, 'Sum Squared Residuals',1,TRUE)
a<-table.element(a, sum(myerror*myerror))
a<-table.row.end(a)
a<-table.end(a)
table.save(a,file='mytable3.tab')
a<-table.start()
a<-table.row.start(a)
a<-table.element(a, 'Multiple Linear Regression - Actuals, Interpolation, and Residuals', 4, TRUE)
a<-table.row.end(a)
a<-table.row.start(a)
a<-table.element(a, 'Time or Index', 1, TRUE)
a<-table.element(a, 'Actuals', 1, TRUE)
a<-table.element(a, 'Interpolation
Forecast', 1, TRUE)
a<-table.element(a, 'Residuals
Prediction Error', 1, TRUE)
a<-table.row.end(a)
for (i in 1:n) {
a<-table.row.start(a)
a<-table.element(a,i, 1, TRUE)
a<-table.element(a,x[i])
a<-table.element(a,x[i]-mysum$resid[i])
a<-table.element(a,mysum$resid[i])
a<-table.row.end(a)
}
a<-table.end(a)
table.save(a,file='mytable4.tab')
if (n > n25) {
a<-table.start()
a<-table.row.start(a)
a<-table.element(a,'Goldfeld-Quandt test for Heteroskedasticity',4,TRUE)
a<-table.row.end(a)
a<-table.row.start(a)
a<-table.element(a,'p-values',header=TRUE)
a<-table.element(a,'Alternative Hypothesis',3,header=TRUE)
a<-table.row.end(a)
a<-table.row.start(a)
a<-table.element(a,'breakpoint index',header=TRUE)
a<-table.element(a,'greater',header=TRUE)
a<-table.element(a,'2-sided',header=TRUE)
a<-table.element(a,'less',header=TRUE)
a<-table.row.end(a)
for (mypoint in kp3:nmkm3) {
a<-table.row.start(a)
a<-table.element(a,mypoint,header=TRUE)
a<-table.element(a,gqarr[mypoint-kp3+1,1])
a<-table.element(a,gqarr[mypoint-kp3+1,2])
a<-table.element(a,gqarr[mypoint-kp3+1,3])
a<-table.row.end(a)
}
a<-table.end(a)
table.save(a,file='mytable5.tab')
a<-table.start()
a<-table.row.start(a)
a<-table.element(a,'Meta Analysis of Goldfeld-Quandt test for Heteroskedasticity',4,TRUE)
a<-table.row.end(a)
a<-table.row.start(a)
a<-table.element(a,'Description',header=TRUE)
a<-table.element(a,'# significant tests',header=TRUE)
a<-table.element(a,'% significant tests',header=TRUE)
a<-table.element(a,'OK/NOK',header=TRUE)
a<-table.row.end(a)
a<-table.row.start(a)
a<-table.element(a,'1% type I error level',header=TRUE)
a<-table.element(a,numsignificant1)
a<-table.element(a,numsignificant1/numgqtests)
if (numsignificant1/numgqtests < 0.01) dum <- 'OK' else dum <- 'NOK'
a<-table.element(a,dum)
a<-table.row.end(a)
a<-table.row.start(a)
a<-table.element(a,'5% type I error level',header=TRUE)
a<-table.element(a,numsignificant5)
a<-table.element(a,numsignificant5/numgqtests)
if (numsignificant5/numgqtests < 0.05) dum <- 'OK' else dum <- 'NOK'
a<-table.element(a,dum)
a<-table.row.end(a)
a<-table.row.start(a)
a<-table.element(a,'10% type I error level',header=TRUE)
a<-table.element(a,numsignificant10)
a<-table.element(a,numsignificant10/numgqtests)
if (numsignificant10/numgqtests < 0.1) dum <- 'OK' else dum <- 'NOK'
a<-table.element(a,dum)
a<-table.row.end(a)
a<-table.end(a)
table.save(a,file='mytable6.tab')
}