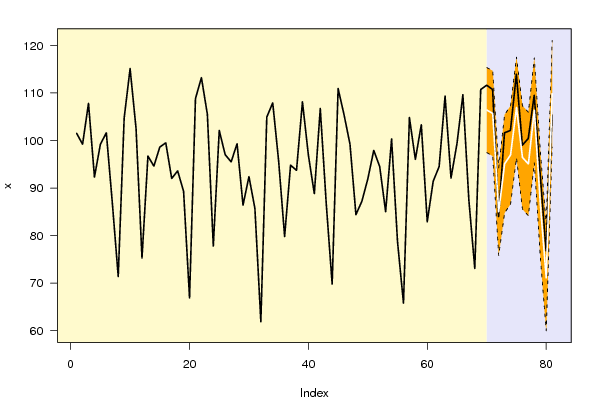
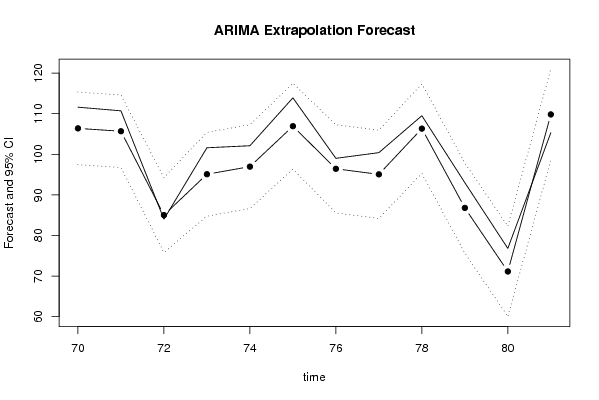
| Univariate ARIMA Extrapolation Forecast | ||||||||
| time | Y[t] | F[t] | 95% LB | 95% UB | p-value (H0: Y[t] = F[t]) | P(F[t]>Y[t-1]) | P(F[t]>Y[t-s]) | P(F[t]>Y[69]) |
| 57 | 104.8 | - | - | - | - | - | - | - |
| 58 | 96 | - | - | - | - | - | - | - |
| 59 | 103.3 | - | - | - | - | - | - | - |
| 60 | 82.9 | - | - | - | - | - | - | - |
| 61 | 91.4 | - | - | - | - | - | - | - |
| 62 | 94.5 | - | - | - | - | - | - | - |
| 63 | 109.3 | - | - | - | - | - | - | - |
| 64 | 92.1 | - | - | - | - | - | - | - |
| 65 | 99.3 | - | - | - | - | - | - | - |
| 66 | 109.6 | - | - | - | - | - | - | - |
| 67 | 87.5 | - | - | - | - | - | - | - |
| 68 | 73.1 | - | - | - | - | - | - | - |
| 69 | 110.7 | - | - | - | - | - | - | - |
| 70 | 111.6 | 106.3783 | 97.4364 | 115.3203 | 0.1262 | 0.1717 | 0.9885 | 0.1717 |
| 71 | 110.7 | 105.67 | 96.7186 | 114.6213 | 0.1354 | 0.0971 | 0.6981 | 0.1354 |
| 72 | 84 | 85.0128 | 75.7966 | 94.229 | 0.4147 | 0 | 0.6734 | 0 |
| 73 | 101.6 | 95.0789 | 84.754 | 105.4039 | 0.1079 | 0.9823 | 0.7575 | 0.0015 |
| 74 | 102.1 | 96.9503 | 86.6249 | 107.2757 | 0.1642 | 0.1887 | 0.6791 | 0.0045 |
| 75 | 113.9 | 106.9149 | 96.3318 | 117.498 | 0.0979 | 0.8137 | 0.3293 | 0.2417 |
| 76 | 99 | 96.4204 | 85.5574 | 107.2833 | 0.3208 | 8e-04 | 0.7822 | 0.005 |
| 77 | 100.4 | 95.0477 | 84.1732 | 105.9223 | 0.1674 | 0.2381 | 0.2217 | 0.0024 |
| 78 | 109.5 | 106.3192 | 95.2908 | 117.3475 | 0.2859 | 0.8536 | 0.2799 | 0.2181 |
| 79 | 93 | 86.7794 | 75.6663 | 97.8925 | 0.1363 | 0 | 0.4494 | 0 |
| 80 | 76.8 | 71.1178 | 59.9853 | 82.2503 | 0.1586 | 1e-04 | 0.3635 | 0 |
| 81 | 105.3 | 109.8134 | 98.6052 | 121.0217 | 0.215 | 1 | 0.4384 | 0.4384 |
| Univariate ARIMA Extrapolation Forecast Performance | ||||||
| time | % S.E. | PE | MAPE | Sq.E | MSE | RMSE |
| 70 | 0.0429 | 0.0491 | 0 | 27.2658 | 0 | 0 |
| 71 | 0.0432 | 0.0476 | 0.0483 | 25.3013 | 26.2836 | 5.1267 |
| 72 | 0.0553 | -0.0119 | 0.0362 | 1.0257 | 17.8643 | 4.2266 |
| 73 | 0.0554 | 0.0686 | 0.0443 | 42.5243 | 24.0293 | 4.902 |
| 74 | 0.0543 | 0.0531 | 0.0461 | 26.5194 | 24.5273 | 4.9525 |
| 75 | 0.0505 | 0.0653 | 0.0493 | 48.7914 | 28.5713 | 5.3452 |
| 76 | 0.0575 | 0.0268 | 0.0461 | 6.6545 | 25.4404 | 5.0438 |
| 77 | 0.0584 | 0.0563 | 0.0473 | 28.6466 | 25.8411 | 5.0834 |
| 78 | 0.0529 | 0.0299 | 0.0454 | 10.1176 | 24.0941 | 4.9086 |
| 79 | 0.0653 | 0.0717 | 0.048 | 38.6958 | 25.5542 | 5.0551 |
| 80 | 0.0799 | 0.0799 | 0.0509 | 32.2875 | 26.1664 | 5.1153 |
| 81 | 0.0521 | -0.0411 | 0.0501 | 20.3709 | 25.6834 | 5.0679 |