Free Statistics

of Irreproducible Research!

Author's title

Author*The author of this computation has been verified*
R Software Modulerwasp_multipleregression.wasp
Title produced by softwareMultiple Regression
Date of computationWed, 16 Dec 2009 06:53:56 -0700
Cite this page as followsStatistical Computations at FreeStatistics.org, Office for Research Development and Education, URL https://freestatistics.org/blog/index.php?v=date/2009/Dec/16/t1260973522v8hgvm32t5jtrzs.htm/, Retrieved Tue, 30 Apr 2024 11:50:36 +0000
Statistical Computations at FreeStatistics.org, Office for Research Development and Education, URL https://freestatistics.org/blog/index.php?pk=68376, Retrieved Tue, 30 Apr 2024 11:50:36 +0000
QR Codes:

Original text written by user:
IsPrivate?No (this computation is public)
User-defined keywords
Estimated Impact101
Family? (F = Feedback message, R = changed R code, M = changed R Module, P = changed Parameters, D = changed Data)
-     [Multiple Regression] [Q1 The Seatbeltlaw] [2007-11-14 19:27:43] [8cd6641b921d30ebe00b648d1481bba0]
- RMPD  [Multiple Regression] [Seatbelt] [2009-11-12 14:03:14] [b98453cac15ba1066b407e146608df68]
- R  D    [Multiple Regression] [Model 2, rekening...] [2009-11-19 16:44:31] [075a06058fde559dd021d126a2b15a40]
-    D        [Multiple Regression] [Model 2, rekening...] [2009-12-16 13:53:56] [154177ed6b2613a730375f7d341441cf] [Current]
Feedback Forum

Post a new message
Dataseries X:
95.1	136
97	133
112.7	126
102.9	120
97.4	114
111.4	116
87.4	153
96.8	162
114.1	161
110.3	149
103.9	139
101.6	135
94.6	130
95.9	127
104.7	122
102.8	117
98.1	112
113.9	113
80.9	149
95.7	157
113.2	157
105.9	147
108.8	137
102.3	132
99	125
100.7	123
115.5	117
100.7	114
109.9	111
114.6	112
85.4	144
100.5	150
114.8	149
116.5	134
112.9	123
102	116
106	117
105.3	111
118.8	105
106.1	102
109.3	95
117.2	93
92.5	124
104.2	130
112.5	124
122.4	115
113.3	106
100	105
110.7	105
112.8	101
109.8	95
117.3	93
109.1	84
115.9	87
96	116
99.8	120
116.8	117
115.7	109
99.4	105
94.3	107
91	109


Summary of computational transaction
Raw Inputview raw input (R code)
Raw Outputview raw output of R engine
Computing time3 seconds
R Server'Gwilym Jenkins' @ 72.249.127.135

\begin{tabular}{lllllllll}
\hline
Summary of computational transaction \tabularnewline
Raw Input & view raw input (R code)  \tabularnewline
Raw Output & view raw output of R engine  \tabularnewline
Computing time & 3 seconds \tabularnewline
R Server & 'Gwilym Jenkins' @ 72.249.127.135 \tabularnewline
\hline
\end{tabular}
%Source: https://freestatistics.org/blog/index.php?pk=68376&T=0

[TABLE]
[ROW][C]Summary of computational transaction[/C][/ROW]
[ROW][C]Raw Input[/C][C]view raw input (R code) [/C][/ROW]
[ROW][C]Raw Output[/C][C]view raw output of R engine [/C][/ROW]
[ROW][C]Computing time[/C][C]3 seconds[/C][/ROW]
[ROW][C]R Server[/C][C]'Gwilym Jenkins' @ 72.249.127.135[/C][/ROW]
[/TABLE]
Source: https://freestatistics.org/blog/index.php?pk=68376&T=0

Globally Unique Identifier (entire table): ba.freestatistics.org/blog/index.php?pk=68376&T=0

As an alternative you can also use a QR Code:  

The GUIDs for individual cells are displayed in the table below:

Summary of computational transaction
Raw Inputview raw input (R code)
Raw Outputview raw output of R engine
Computing time3 seconds
R Server'Gwilym Jenkins' @ 72.249.127.135


Multiple Linear Regression - Estimated Regression Equation
tip[t] = + 121.394817113588 -0.179452244652004wrk[t] -0.400730340464006M1[t] + 2.3M2[t] + 11.1832865320880M3[t] + 4.16136800241036M4[t] + 1.88465453449834M5[t] + 11.9041067791503M6[t] -8.33396914733354M7[t] + 3.81041566736967M8[t] + 18.2956207291353M9[t] + 16.2375364868936M10[t] + 8.15835673395602M11[t] + e[t]

\begin{tabular}{lllllllll}
\hline
Multiple Linear Regression - Estimated Regression Equation \tabularnewline
tip[t] =  +  121.394817113588 -0.179452244652004wrk[t] -0.400730340464006M1[t] +  2.3M2[t] +  11.1832865320880M3[t] +  4.16136800241036M4[t] +  1.88465453449834M5[t] +  11.9041067791503M6[t] -8.33396914733354M7[t] +  3.81041566736967M8[t] +  18.2956207291353M9[t] +  16.2375364868936M10[t] +  8.15835673395602M11[t]  + e[t] \tabularnewline
\hline
\end{tabular}
%Source: https://freestatistics.org/blog/index.php?pk=68376&T=1

[TABLE]
[ROW][C]Multiple Linear Regression - Estimated Regression Equation[/C][/ROW]
[ROW][C]tip[t] =  +  121.394817113588 -0.179452244652004wrk[t] -0.400730340464006M1[t] +  2.3M2[t] +  11.1832865320880M3[t] +  4.16136800241036M4[t] +  1.88465453449834M5[t] +  11.9041067791503M6[t] -8.33396914733354M7[t] +  3.81041566736967M8[t] +  18.2956207291353M9[t] +  16.2375364868936M10[t] +  8.15835673395602M11[t]  + e[t][/C][/ROW]
[/TABLE]
Source: https://freestatistics.org/blog/index.php?pk=68376&T=1

Globally Unique Identifier (entire table): ba.freestatistics.org/blog/index.php?pk=68376&T=1

As an alternative you can also use a QR Code:  

The GUIDs for individual cells are displayed in the table below:

Multiple Linear Regression - Estimated Regression Equation
tip[t] = + 121.394817113588 -0.179452244652004wrk[t] -0.400730340464006M1[t] + 2.3M2[t] + 11.1832865320880M3[t] + 4.16136800241036M4[t] + 1.88465453449834M5[t] + 11.9041067791503M6[t] -8.33396914733354M7[t] + 3.81041566736967M8[t] + 18.2956207291353M9[t] + 16.2375364868936M10[t] + 8.15835673395602M11[t] + e[t]


Multiple Linear Regression - Ordinary Least Squares
VariableParameterS.D.T-STATH0: parameter = 02-tail p-value1-tail p-value
(Intercept)121.3948171135885.92024420.50500
wrk-0.1794522446520040.046266-3.87870.0003190.00016
M1-0.4007303404640062.94741-0.1360.8924210.446211
M22.33.0777950.74730.4585350.229267
M311.18328653208803.0902883.61880.000710.000355
M44.161368002410363.1110131.33760.1873220.093661
M51.884654534498343.1634150.59580.5541310.277065
M611.90410677915033.1530453.77540.000440.00022
M7-8.333969147333543.190904-2.61180.0119860.005993
M83.810415667369673.2847171.160.2517690.125884
M918.29562072913533.2505615.62851e-060
M1016.23753648689363.125845.19464e-062e-06
M118.158356733956023.0809232.6480.0109230.005462

\begin{tabular}{lllllllll}
\hline
Multiple Linear Regression - Ordinary Least Squares \tabularnewline
Variable & Parameter & S.D. & T-STATH0: parameter = 0 & 2-tail p-value & 1-tail p-value \tabularnewline
(Intercept) & 121.394817113588 & 5.920244 & 20.505 & 0 & 0 \tabularnewline
wrk & -0.179452244652004 & 0.046266 & -3.8787 & 0.000319 & 0.00016 \tabularnewline
M1 & -0.400730340464006 & 2.94741 & -0.136 & 0.892421 & 0.446211 \tabularnewline
M2 & 2.3 & 3.077795 & 0.7473 & 0.458535 & 0.229267 \tabularnewline
M3 & 11.1832865320880 & 3.090288 & 3.6188 & 0.00071 & 0.000355 \tabularnewline
M4 & 4.16136800241036 & 3.111013 & 1.3376 & 0.187322 & 0.093661 \tabularnewline
M5 & 1.88465453449834 & 3.163415 & 0.5958 & 0.554131 & 0.277065 \tabularnewline
M6 & 11.9041067791503 & 3.153045 & 3.7754 & 0.00044 & 0.00022 \tabularnewline
M7 & -8.33396914733354 & 3.190904 & -2.6118 & 0.011986 & 0.005993 \tabularnewline
M8 & 3.81041566736967 & 3.284717 & 1.16 & 0.251769 & 0.125884 \tabularnewline
M9 & 18.2956207291353 & 3.250561 & 5.6285 & 1e-06 & 0 \tabularnewline
M10 & 16.2375364868936 & 3.12584 & 5.1946 & 4e-06 & 2e-06 \tabularnewline
M11 & 8.15835673395602 & 3.080923 & 2.648 & 0.010923 & 0.005462 \tabularnewline
\hline
\end{tabular}
%Source: https://freestatistics.org/blog/index.php?pk=68376&T=2

[TABLE]
[ROW][C]Multiple Linear Regression - Ordinary Least Squares[/C][/ROW]
[ROW][C]Variable[/C][C]Parameter[/C][C]S.D.[/C][C]T-STATH0: parameter = 0[/C][C]2-tail p-value[/C][C]1-tail p-value[/C][/ROW]
[ROW][C](Intercept)[/C][C]121.394817113588[/C][C]5.920244[/C][C]20.505[/C][C]0[/C][C]0[/C][/ROW]
[ROW][C]wrk[/C][C]-0.179452244652004[/C][C]0.046266[/C][C]-3.8787[/C][C]0.000319[/C][C]0.00016[/C][/ROW]
[ROW][C]M1[/C][C]-0.400730340464006[/C][C]2.94741[/C][C]-0.136[/C][C]0.892421[/C][C]0.446211[/C][/ROW]
[ROW][C]M2[/C][C]2.3[/C][C]3.077795[/C][C]0.7473[/C][C]0.458535[/C][C]0.229267[/C][/ROW]
[ROW][C]M3[/C][C]11.1832865320880[/C][C]3.090288[/C][C]3.6188[/C][C]0.00071[/C][C]0.000355[/C][/ROW]
[ROW][C]M4[/C][C]4.16136800241036[/C][C]3.111013[/C][C]1.3376[/C][C]0.187322[/C][C]0.093661[/C][/ROW]
[ROW][C]M5[/C][C]1.88465453449834[/C][C]3.163415[/C][C]0.5958[/C][C]0.554131[/C][C]0.277065[/C][/ROW]
[ROW][C]M6[/C][C]11.9041067791503[/C][C]3.153045[/C][C]3.7754[/C][C]0.00044[/C][C]0.00022[/C][/ROW]
[ROW][C]M7[/C][C]-8.33396914733354[/C][C]3.190904[/C][C]-2.6118[/C][C]0.011986[/C][C]0.005993[/C][/ROW]
[ROW][C]M8[/C][C]3.81041566736967[/C][C]3.284717[/C][C]1.16[/C][C]0.251769[/C][C]0.125884[/C][/ROW]
[ROW][C]M9[/C][C]18.2956207291353[/C][C]3.250561[/C][C]5.6285[/C][C]1e-06[/C][C]0[/C][/ROW]
[ROW][C]M10[/C][C]16.2375364868936[/C][C]3.12584[/C][C]5.1946[/C][C]4e-06[/C][C]2e-06[/C][/ROW]
[ROW][C]M11[/C][C]8.15835673395602[/C][C]3.080923[/C][C]2.648[/C][C]0.010923[/C][C]0.005462[/C][/ROW]
[/TABLE]
Source: https://freestatistics.org/blog/index.php?pk=68376&T=2

Globally Unique Identifier (entire table): ba.freestatistics.org/blog/index.php?pk=68376&T=2

As an alternative you can also use a QR Code:  

The GUIDs for individual cells are displayed in the table below:

Multiple Linear Regression - Ordinary Least Squares
VariableParameterS.D.T-STATH0: parameter = 02-tail p-value1-tail p-value
(Intercept)121.3948171135885.92024420.50500
wrk-0.1794522446520040.046266-3.87870.0003190.00016
M1-0.4007303404640062.94741-0.1360.8924210.446211
M22.33.0777950.74730.4585350.229267
M311.18328653208803.0902883.61880.000710.000355
M44.161368002410363.1110131.33760.1873220.093661
M51.884654534498343.1634150.59580.5541310.277065
M611.90410677915033.1530453.77540.000440.00022
M7-8.333969147333543.190904-2.61180.0119860.005993
M83.810415667369673.2847171.160.2517690.125884
M918.29562072913533.2505615.62851e-060
M1016.23753648689363.125845.19464e-062e-06
M118.158356733956023.0809232.6480.0109230.005462


Multiple Linear Regression - Regression Statistics
Multiple R0.878569063356793
R-squared0.771883599087633
Adjusted R-squared0.714854498859542
F-TEST (value)13.5349075472072
F-TEST (DF numerator)12
F-TEST (DF denominator)48
p-value1.36221034452433e-11
Multiple Linear Regression - Residual Statistics
Residual Standard Deviation4.86642040031007
Sum Squared Residuals1136.73828060259

\begin{tabular}{lllllllll}
\hline
Multiple Linear Regression - Regression Statistics \tabularnewline
Multiple R & 0.878569063356793 \tabularnewline
R-squared & 0.771883599087633 \tabularnewline
Adjusted R-squared & 0.714854498859542 \tabularnewline
F-TEST (value) & 13.5349075472072 \tabularnewline
F-TEST (DF numerator) & 12 \tabularnewline
F-TEST (DF denominator) & 48 \tabularnewline
p-value & 1.36221034452433e-11 \tabularnewline
Multiple Linear Regression - Residual Statistics \tabularnewline
Residual Standard Deviation & 4.86642040031007 \tabularnewline
Sum Squared Residuals & 1136.73828060259 \tabularnewline
\hline
\end{tabular}
%Source: https://freestatistics.org/blog/index.php?pk=68376&T=3

[TABLE]
[ROW][C]Multiple Linear Regression - Regression Statistics[/C][/ROW]
[ROW][C]Multiple R[/C][C]0.878569063356793[/C][/ROW]
[ROW][C]R-squared[/C][C]0.771883599087633[/C][/ROW]
[ROW][C]Adjusted R-squared[/C][C]0.714854498859542[/C][/ROW]
[ROW][C]F-TEST (value)[/C][C]13.5349075472072[/C][/ROW]
[ROW][C]F-TEST (DF numerator)[/C][C]12[/C][/ROW]
[ROW][C]F-TEST (DF denominator)[/C][C]48[/C][/ROW]
[ROW][C]p-value[/C][C]1.36221034452433e-11[/C][/ROW]
[ROW][C]Multiple Linear Regression - Residual Statistics[/C][/ROW]
[ROW][C]Residual Standard Deviation[/C][C]4.86642040031007[/C][/ROW]
[ROW][C]Sum Squared Residuals[/C][C]1136.73828060259[/C][/ROW]
[/TABLE]
Source: https://freestatistics.org/blog/index.php?pk=68376&T=3

Globally Unique Identifier (entire table): ba.freestatistics.org/blog/index.php?pk=68376&T=3

As an alternative you can also use a QR Code:  

The GUIDs for individual cells are displayed in the table below:

Multiple Linear Regression - Regression Statistics
Multiple R0.878569063356793
R-squared0.771883599087633
Adjusted R-squared0.714854498859542
F-TEST (value)13.5349075472072
F-TEST (DF numerator)12
F-TEST (DF denominator)48
p-value1.36221034452433e-11
Multiple Linear Regression - Residual Statistics
Residual Standard Deviation4.86642040031007
Sum Squared Residuals1136.73828060259


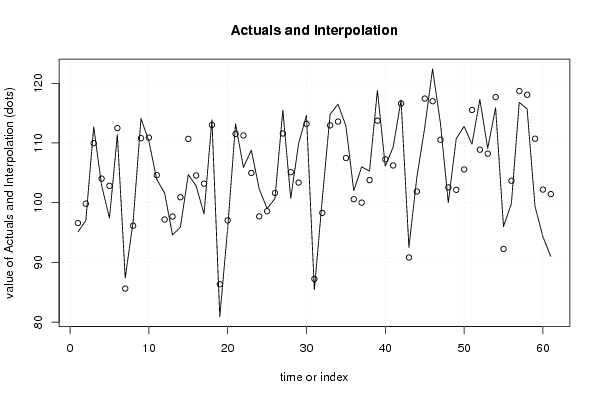
Multiple Linear Regression - Actuals, Interpolation, and Residuals
Time or IndexActualsInterpolationForecastResidualsPrediction Error
195.196.588581500452-1.48858150045198
29799.827668574872-2.82766857487196
3112.7109.9671208195242.73287918047606
4102.9104.021915757758-1.12191575775836
597.4102.821915757758-5.42191575775836
6111.4112.482463513106-1.08246351310636
787.485.60465453449841.79534546550166
896.896.13396914733350.66603085266646
9114.1110.7986264537513.30137354624887
10110.3110.893969147334-0.59396914733352
11103.9104.609311840916-0.709311840915936
12101.697.1687640855684.43123591443206
1394.697.665294968364-3.06529496836396
1495.9100.904382042784-5.00438204278396
15104.7110.684929798132-5.98492979813197
16102.8104.560272491714-1.76027249171437
1798.1103.180820247062-5.08082024706237
18113.9113.0208202470620.879179752937634
1980.986.3224635131064-5.42246351310636
2095.797.0312303705935-1.33123037059355
21113.2111.5164354323591.68356456764086
22105.9111.252873636638-5.35287363663755
23108.8104.968216330223.83178366978005
24102.397.7071208195244.59287918047604
259998.5625561916240.437443808376024
26100.7101.622191021392-0.92219102139198
27115.5111.5821910213923.91780897860801
28100.7105.098629225670-4.39862922567038
29109.9103.3602724917146.53972750828563
30114.6113.2002724917141.39972750828562
3185.487.2197247363664-1.81972473636638
32100.598.28739608315762.21260391684242
33114.8112.9520533895751.84794661042483
34116.5113.5857528171142.91424718288641
35112.9107.4805477553485.41945224465201
36102100.5783567339561.42164326604399
3710699.998174148846.00182585115999
38105.3103.7756179572161.52438204278397
39118.8113.7356179572165.06438204278397
40106.1107.252056161494-1.15205616149443
41109.3106.2315084061463.06849159385357
42117.2116.6098651401020.590134859897562
4392.590.80876962940651.69123037059355
44104.2101.8764409761982.32355902380235
45112.5117.438359505875-4.93835950587527
46122.4116.9953454655025.40465453449834
47113.3110.5312359144322.76876408556794
48100102.552331425128-2.55233142512805
49110.7102.1516010846648.54839891533596
50112.8105.5701404037367.22985959626394
51109.8115.530140403736-5.73014040373607
52117.3108.8671263633628.43287363663755
53109.1108.2054830973180.894516902681529
54115.9117.686578608014-1.78657860801446
559692.24438758662253.75561241337752
5699.8103.670963422718-3.87096342271769
57116.8118.694525218439-1.89452521843929
58115.7118.072058933414-2.37205893341368
5999.4110.710688159084-11.3106881590841
6094.3102.193426935824-7.89342693582405
6191101.433792106056-10.4337921060560

\begin{tabular}{lllllllll}
\hline
Multiple Linear Regression - Actuals, Interpolation, and Residuals \tabularnewline
Time or Index & Actuals & InterpolationForecast & ResidualsPrediction Error \tabularnewline
1 & 95.1 & 96.588581500452 & -1.48858150045198 \tabularnewline
2 & 97 & 99.827668574872 & -2.82766857487196 \tabularnewline
3 & 112.7 & 109.967120819524 & 2.73287918047606 \tabularnewline
4 & 102.9 & 104.021915757758 & -1.12191575775836 \tabularnewline
5 & 97.4 & 102.821915757758 & -5.42191575775836 \tabularnewline
6 & 111.4 & 112.482463513106 & -1.08246351310636 \tabularnewline
7 & 87.4 & 85.6046545344984 & 1.79534546550166 \tabularnewline
8 & 96.8 & 96.1339691473335 & 0.66603085266646 \tabularnewline
9 & 114.1 & 110.798626453751 & 3.30137354624887 \tabularnewline
10 & 110.3 & 110.893969147334 & -0.59396914733352 \tabularnewline
11 & 103.9 & 104.609311840916 & -0.709311840915936 \tabularnewline
12 & 101.6 & 97.168764085568 & 4.43123591443206 \tabularnewline
13 & 94.6 & 97.665294968364 & -3.06529496836396 \tabularnewline
14 & 95.9 & 100.904382042784 & -5.00438204278396 \tabularnewline
15 & 104.7 & 110.684929798132 & -5.98492979813197 \tabularnewline
16 & 102.8 & 104.560272491714 & -1.76027249171437 \tabularnewline
17 & 98.1 & 103.180820247062 & -5.08082024706237 \tabularnewline
18 & 113.9 & 113.020820247062 & 0.879179752937634 \tabularnewline
19 & 80.9 & 86.3224635131064 & -5.42246351310636 \tabularnewline
20 & 95.7 & 97.0312303705935 & -1.33123037059355 \tabularnewline
21 & 113.2 & 111.516435432359 & 1.68356456764086 \tabularnewline
22 & 105.9 & 111.252873636638 & -5.35287363663755 \tabularnewline
23 & 108.8 & 104.96821633022 & 3.83178366978005 \tabularnewline
24 & 102.3 & 97.707120819524 & 4.59287918047604 \tabularnewline
25 & 99 & 98.562556191624 & 0.437443808376024 \tabularnewline
26 & 100.7 & 101.622191021392 & -0.92219102139198 \tabularnewline
27 & 115.5 & 111.582191021392 & 3.91780897860801 \tabularnewline
28 & 100.7 & 105.098629225670 & -4.39862922567038 \tabularnewline
29 & 109.9 & 103.360272491714 & 6.53972750828563 \tabularnewline
30 & 114.6 & 113.200272491714 & 1.39972750828562 \tabularnewline
31 & 85.4 & 87.2197247363664 & -1.81972473636638 \tabularnewline
32 & 100.5 & 98.2873960831576 & 2.21260391684242 \tabularnewline
33 & 114.8 & 112.952053389575 & 1.84794661042483 \tabularnewline
34 & 116.5 & 113.585752817114 & 2.91424718288641 \tabularnewline
35 & 112.9 & 107.480547755348 & 5.41945224465201 \tabularnewline
36 & 102 & 100.578356733956 & 1.42164326604399 \tabularnewline
37 & 106 & 99.99817414884 & 6.00182585115999 \tabularnewline
38 & 105.3 & 103.775617957216 & 1.52438204278397 \tabularnewline
39 & 118.8 & 113.735617957216 & 5.06438204278397 \tabularnewline
40 & 106.1 & 107.252056161494 & -1.15205616149443 \tabularnewline
41 & 109.3 & 106.231508406146 & 3.06849159385357 \tabularnewline
42 & 117.2 & 116.609865140102 & 0.590134859897562 \tabularnewline
43 & 92.5 & 90.8087696294065 & 1.69123037059355 \tabularnewline
44 & 104.2 & 101.876440976198 & 2.32355902380235 \tabularnewline
45 & 112.5 & 117.438359505875 & -4.93835950587527 \tabularnewline
46 & 122.4 & 116.995345465502 & 5.40465453449834 \tabularnewline
47 & 113.3 & 110.531235914432 & 2.76876408556794 \tabularnewline
48 & 100 & 102.552331425128 & -2.55233142512805 \tabularnewline
49 & 110.7 & 102.151601084664 & 8.54839891533596 \tabularnewline
50 & 112.8 & 105.570140403736 & 7.22985959626394 \tabularnewline
51 & 109.8 & 115.530140403736 & -5.73014040373607 \tabularnewline
52 & 117.3 & 108.867126363362 & 8.43287363663755 \tabularnewline
53 & 109.1 & 108.205483097318 & 0.894516902681529 \tabularnewline
54 & 115.9 & 117.686578608014 & -1.78657860801446 \tabularnewline
55 & 96 & 92.2443875866225 & 3.75561241337752 \tabularnewline
56 & 99.8 & 103.670963422718 & -3.87096342271769 \tabularnewline
57 & 116.8 & 118.694525218439 & -1.89452521843929 \tabularnewline
58 & 115.7 & 118.072058933414 & -2.37205893341368 \tabularnewline
59 & 99.4 & 110.710688159084 & -11.3106881590841 \tabularnewline
60 & 94.3 & 102.193426935824 & -7.89342693582405 \tabularnewline
61 & 91 & 101.433792106056 & -10.4337921060560 \tabularnewline
\hline
\end{tabular}
%Source: https://freestatistics.org/blog/index.php?pk=68376&T=4

[TABLE]
[ROW][C]Multiple Linear Regression - Actuals, Interpolation, and Residuals[/C][/ROW]
[ROW][C]Time or Index[/C][C]Actuals[/C][C]InterpolationForecast[/C][C]ResidualsPrediction Error[/C][/ROW]
[ROW][C]1[/C][C]95.1[/C][C]96.588581500452[/C][C]-1.48858150045198[/C][/ROW]
[ROW][C]2[/C][C]97[/C][C]99.827668574872[/C][C]-2.82766857487196[/C][/ROW]
[ROW][C]3[/C][C]112.7[/C][C]109.967120819524[/C][C]2.73287918047606[/C][/ROW]
[ROW][C]4[/C][C]102.9[/C][C]104.021915757758[/C][C]-1.12191575775836[/C][/ROW]
[ROW][C]5[/C][C]97.4[/C][C]102.821915757758[/C][C]-5.42191575775836[/C][/ROW]
[ROW][C]6[/C][C]111.4[/C][C]112.482463513106[/C][C]-1.08246351310636[/C][/ROW]
[ROW][C]7[/C][C]87.4[/C][C]85.6046545344984[/C][C]1.79534546550166[/C][/ROW]
[ROW][C]8[/C][C]96.8[/C][C]96.1339691473335[/C][C]0.66603085266646[/C][/ROW]
[ROW][C]9[/C][C]114.1[/C][C]110.798626453751[/C][C]3.30137354624887[/C][/ROW]
[ROW][C]10[/C][C]110.3[/C][C]110.893969147334[/C][C]-0.59396914733352[/C][/ROW]
[ROW][C]11[/C][C]103.9[/C][C]104.609311840916[/C][C]-0.709311840915936[/C][/ROW]
[ROW][C]12[/C][C]101.6[/C][C]97.168764085568[/C][C]4.43123591443206[/C][/ROW]
[ROW][C]13[/C][C]94.6[/C][C]97.665294968364[/C][C]-3.06529496836396[/C][/ROW]
[ROW][C]14[/C][C]95.9[/C][C]100.904382042784[/C][C]-5.00438204278396[/C][/ROW]
[ROW][C]15[/C][C]104.7[/C][C]110.684929798132[/C][C]-5.98492979813197[/C][/ROW]
[ROW][C]16[/C][C]102.8[/C][C]104.560272491714[/C][C]-1.76027249171437[/C][/ROW]
[ROW][C]17[/C][C]98.1[/C][C]103.180820247062[/C][C]-5.08082024706237[/C][/ROW]
[ROW][C]18[/C][C]113.9[/C][C]113.020820247062[/C][C]0.879179752937634[/C][/ROW]
[ROW][C]19[/C][C]80.9[/C][C]86.3224635131064[/C][C]-5.42246351310636[/C][/ROW]
[ROW][C]20[/C][C]95.7[/C][C]97.0312303705935[/C][C]-1.33123037059355[/C][/ROW]
[ROW][C]21[/C][C]113.2[/C][C]111.516435432359[/C][C]1.68356456764086[/C][/ROW]
[ROW][C]22[/C][C]105.9[/C][C]111.252873636638[/C][C]-5.35287363663755[/C][/ROW]
[ROW][C]23[/C][C]108.8[/C][C]104.96821633022[/C][C]3.83178366978005[/C][/ROW]
[ROW][C]24[/C][C]102.3[/C][C]97.707120819524[/C][C]4.59287918047604[/C][/ROW]
[ROW][C]25[/C][C]99[/C][C]98.562556191624[/C][C]0.437443808376024[/C][/ROW]
[ROW][C]26[/C][C]100.7[/C][C]101.622191021392[/C][C]-0.92219102139198[/C][/ROW]
[ROW][C]27[/C][C]115.5[/C][C]111.582191021392[/C][C]3.91780897860801[/C][/ROW]
[ROW][C]28[/C][C]100.7[/C][C]105.098629225670[/C][C]-4.39862922567038[/C][/ROW]
[ROW][C]29[/C][C]109.9[/C][C]103.360272491714[/C][C]6.53972750828563[/C][/ROW]
[ROW][C]30[/C][C]114.6[/C][C]113.200272491714[/C][C]1.39972750828562[/C][/ROW]
[ROW][C]31[/C][C]85.4[/C][C]87.2197247363664[/C][C]-1.81972473636638[/C][/ROW]
[ROW][C]32[/C][C]100.5[/C][C]98.2873960831576[/C][C]2.21260391684242[/C][/ROW]
[ROW][C]33[/C][C]114.8[/C][C]112.952053389575[/C][C]1.84794661042483[/C][/ROW]
[ROW][C]34[/C][C]116.5[/C][C]113.585752817114[/C][C]2.91424718288641[/C][/ROW]
[ROW][C]35[/C][C]112.9[/C][C]107.480547755348[/C][C]5.41945224465201[/C][/ROW]
[ROW][C]36[/C][C]102[/C][C]100.578356733956[/C][C]1.42164326604399[/C][/ROW]
[ROW][C]37[/C][C]106[/C][C]99.99817414884[/C][C]6.00182585115999[/C][/ROW]
[ROW][C]38[/C][C]105.3[/C][C]103.775617957216[/C][C]1.52438204278397[/C][/ROW]
[ROW][C]39[/C][C]118.8[/C][C]113.735617957216[/C][C]5.06438204278397[/C][/ROW]
[ROW][C]40[/C][C]106.1[/C][C]107.252056161494[/C][C]-1.15205616149443[/C][/ROW]
[ROW][C]41[/C][C]109.3[/C][C]106.231508406146[/C][C]3.06849159385357[/C][/ROW]
[ROW][C]42[/C][C]117.2[/C][C]116.609865140102[/C][C]0.590134859897562[/C][/ROW]
[ROW][C]43[/C][C]92.5[/C][C]90.8087696294065[/C][C]1.69123037059355[/C][/ROW]
[ROW][C]44[/C][C]104.2[/C][C]101.876440976198[/C][C]2.32355902380235[/C][/ROW]
[ROW][C]45[/C][C]112.5[/C][C]117.438359505875[/C][C]-4.93835950587527[/C][/ROW]
[ROW][C]46[/C][C]122.4[/C][C]116.995345465502[/C][C]5.40465453449834[/C][/ROW]
[ROW][C]47[/C][C]113.3[/C][C]110.531235914432[/C][C]2.76876408556794[/C][/ROW]
[ROW][C]48[/C][C]100[/C][C]102.552331425128[/C][C]-2.55233142512805[/C][/ROW]
[ROW][C]49[/C][C]110.7[/C][C]102.151601084664[/C][C]8.54839891533596[/C][/ROW]
[ROW][C]50[/C][C]112.8[/C][C]105.570140403736[/C][C]7.22985959626394[/C][/ROW]
[ROW][C]51[/C][C]109.8[/C][C]115.530140403736[/C][C]-5.73014040373607[/C][/ROW]
[ROW][C]52[/C][C]117.3[/C][C]108.867126363362[/C][C]8.43287363663755[/C][/ROW]
[ROW][C]53[/C][C]109.1[/C][C]108.205483097318[/C][C]0.894516902681529[/C][/ROW]
[ROW][C]54[/C][C]115.9[/C][C]117.686578608014[/C][C]-1.78657860801446[/C][/ROW]
[ROW][C]55[/C][C]96[/C][C]92.2443875866225[/C][C]3.75561241337752[/C][/ROW]
[ROW][C]56[/C][C]99.8[/C][C]103.670963422718[/C][C]-3.87096342271769[/C][/ROW]
[ROW][C]57[/C][C]116.8[/C][C]118.694525218439[/C][C]-1.89452521843929[/C][/ROW]
[ROW][C]58[/C][C]115.7[/C][C]118.072058933414[/C][C]-2.37205893341368[/C][/ROW]
[ROW][C]59[/C][C]99.4[/C][C]110.710688159084[/C][C]-11.3106881590841[/C][/ROW]
[ROW][C]60[/C][C]94.3[/C][C]102.193426935824[/C][C]-7.89342693582405[/C][/ROW]
[ROW][C]61[/C][C]91[/C][C]101.433792106056[/C][C]-10.4337921060560[/C][/ROW]
[/TABLE]
Source: https://freestatistics.org/blog/index.php?pk=68376&T=4

Globally Unique Identifier (entire table): ba.freestatistics.org/blog/index.php?pk=68376&T=4

As an alternative you can also use a QR Code:  

The GUIDs for individual cells are displayed in the table below:

Multiple Linear Regression - Actuals, Interpolation, and Residuals
Time or IndexActualsInterpolationForecastResidualsPrediction Error
195.196.588581500452-1.48858150045198
29799.827668574872-2.82766857487196
3112.7109.9671208195242.73287918047606
4102.9104.021915757758-1.12191575775836
597.4102.821915757758-5.42191575775836
6111.4112.482463513106-1.08246351310636
787.485.60465453449841.79534546550166
896.896.13396914733350.66603085266646
9114.1110.7986264537513.30137354624887
10110.3110.893969147334-0.59396914733352
11103.9104.609311840916-0.709311840915936
12101.697.1687640855684.43123591443206
1394.697.665294968364-3.06529496836396
1495.9100.904382042784-5.00438204278396
15104.7110.684929798132-5.98492979813197
16102.8104.560272491714-1.76027249171437
1798.1103.180820247062-5.08082024706237
18113.9113.0208202470620.879179752937634
1980.986.3224635131064-5.42246351310636
2095.797.0312303705935-1.33123037059355
21113.2111.5164354323591.68356456764086
22105.9111.252873636638-5.35287363663755
23108.8104.968216330223.83178366978005
24102.397.7071208195244.59287918047604
259998.5625561916240.437443808376024
26100.7101.622191021392-0.92219102139198
27115.5111.5821910213923.91780897860801
28100.7105.098629225670-4.39862922567038
29109.9103.3602724917146.53972750828563
30114.6113.2002724917141.39972750828562
3185.487.2197247363664-1.81972473636638
32100.598.28739608315762.21260391684242
33114.8112.9520533895751.84794661042483
34116.5113.5857528171142.91424718288641
35112.9107.4805477553485.41945224465201
36102100.5783567339561.42164326604399
3710699.998174148846.00182585115999
38105.3103.7756179572161.52438204278397
39118.8113.7356179572165.06438204278397
40106.1107.252056161494-1.15205616149443
41109.3106.2315084061463.06849159385357
42117.2116.6098651401020.590134859897562
4392.590.80876962940651.69123037059355
44104.2101.8764409761982.32355902380235
45112.5117.438359505875-4.93835950587527
46122.4116.9953454655025.40465453449834
47113.3110.5312359144322.76876408556794
48100102.552331425128-2.55233142512805
49110.7102.1516010846648.54839891533596
50112.8105.5701404037367.22985959626394
51109.8115.530140403736-5.73014040373607
52117.3108.8671263633628.43287363663755
53109.1108.2054830973180.894516902681529
54115.9117.686578608014-1.78657860801446
559692.24438758662253.75561241337752
5699.8103.670963422718-3.87096342271769
57116.8118.694525218439-1.89452521843929
58115.7118.072058933414-2.37205893341368
5999.4110.710688159084-11.3106881590841
6094.3102.193426935824-7.89342693582405
6191101.433792106056-10.4337921060560


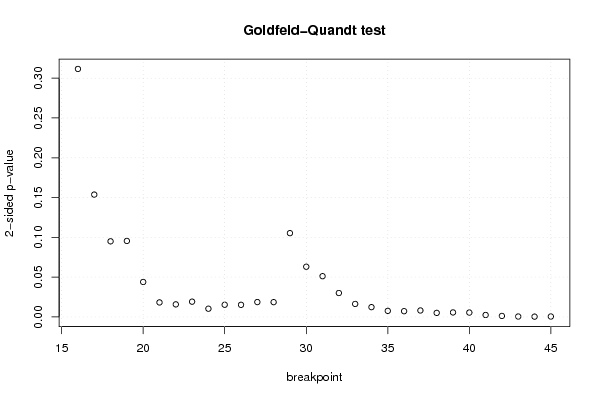
Goldfeld-Quandt test for Heteroskedasticity
p-valuesAlternative Hypothesis
breakpoint indexgreater2-sidedless
160.1558077422061360.3116154844122720.844192257793864
170.0768466259566610.1536932519133220.92315337404334
180.04748847357040680.09497694714081350.952511526429593
190.04771996978157610.09543993956315220.952280030218424
200.02192613813437610.04385227626875230.978073861865624
210.009080735183976260.01816147036795250.990919264816024
220.007868770038151990.01573754007630400.992131229961848
230.009558129198280870.01911625839656170.99044187080172
240.005139859142359240.01027971828471850.99486014085764
250.007612701500248910.01522540300049780.99238729849975
260.00756532307228320.01513064614456640.992434676927717
270.009312147188111980.01862429437622400.990687852811888
280.009249181284393850.01849836256878770.990750818715606
290.05263081694878930.1052616338975790.94736918305121
300.03150751741398950.0630150348279790.96849248258601
310.02557043082160630.05114086164321250.974429569178394
320.01499959391618970.02999918783237940.98500040608381
330.008127241102795390.01625448220559080.991872758897205
340.006114488577581840.01222897715516370.993885511422418
350.003786258150040670.007572516300081340.99621374184996
360.003580918814406680.007161837628813360.996419081185593
370.004027780604654490.008055561209308990.995972219395346
380.002509453571751600.005018907143503210.997490546428248
390.002789172506099980.005578345012199960.9972108274939
400.002714864043689720.005429728087379440.99728513595631
410.001189377135768750.002378754271537490.998810622864231
420.0005913907961766830.001182781592353370.999408609203823
430.0002181016384305360.0004362032768610720.99978189836157
440.0001420874017964090.0002841748035928180.999857912598204
450.000230049636019890.000460099272039780.99976995036398

\begin{tabular}{lllllllll}
\hline
Goldfeld-Quandt test for Heteroskedasticity \tabularnewline
p-values & Alternative Hypothesis \tabularnewline
breakpoint index & greater & 2-sided & less \tabularnewline
16 & 0.155807742206136 & 0.311615484412272 & 0.844192257793864 \tabularnewline
17 & 0.076846625956661 & 0.153693251913322 & 0.92315337404334 \tabularnewline
18 & 0.0474884735704068 & 0.0949769471408135 & 0.952511526429593 \tabularnewline
19 & 0.0477199697815761 & 0.0954399395631522 & 0.952280030218424 \tabularnewline
20 & 0.0219261381343761 & 0.0438522762687523 & 0.978073861865624 \tabularnewline
21 & 0.00908073518397626 & 0.0181614703679525 & 0.990919264816024 \tabularnewline
22 & 0.00786877003815199 & 0.0157375400763040 & 0.992131229961848 \tabularnewline
23 & 0.00955812919828087 & 0.0191162583965617 & 0.99044187080172 \tabularnewline
24 & 0.00513985914235924 & 0.0102797182847185 & 0.99486014085764 \tabularnewline
25 & 0.00761270150024891 & 0.0152254030004978 & 0.99238729849975 \tabularnewline
26 & 0.0075653230722832 & 0.0151306461445664 & 0.992434676927717 \tabularnewline
27 & 0.00931214718811198 & 0.0186242943762240 & 0.990687852811888 \tabularnewline
28 & 0.00924918128439385 & 0.0184983625687877 & 0.990750818715606 \tabularnewline
29 & 0.0526308169487893 & 0.105261633897579 & 0.94736918305121 \tabularnewline
30 & 0.0315075174139895 & 0.063015034827979 & 0.96849248258601 \tabularnewline
31 & 0.0255704308216063 & 0.0511408616432125 & 0.974429569178394 \tabularnewline
32 & 0.0149995939161897 & 0.0299991878323794 & 0.98500040608381 \tabularnewline
33 & 0.00812724110279539 & 0.0162544822055908 & 0.991872758897205 \tabularnewline
34 & 0.00611448857758184 & 0.0122289771551637 & 0.993885511422418 \tabularnewline
35 & 0.00378625815004067 & 0.00757251630008134 & 0.99621374184996 \tabularnewline
36 & 0.00358091881440668 & 0.00716183762881336 & 0.996419081185593 \tabularnewline
37 & 0.00402778060465449 & 0.00805556120930899 & 0.995972219395346 \tabularnewline
38 & 0.00250945357175160 & 0.00501890714350321 & 0.997490546428248 \tabularnewline
39 & 0.00278917250609998 & 0.00557834501219996 & 0.9972108274939 \tabularnewline
40 & 0.00271486404368972 & 0.00542972808737944 & 0.99728513595631 \tabularnewline
41 & 0.00118937713576875 & 0.00237875427153749 & 0.998810622864231 \tabularnewline
42 & 0.000591390796176683 & 0.00118278159235337 & 0.999408609203823 \tabularnewline
43 & 0.000218101638430536 & 0.000436203276861072 & 0.99978189836157 \tabularnewline
44 & 0.000142087401796409 & 0.000284174803592818 & 0.999857912598204 \tabularnewline
45 & 0.00023004963601989 & 0.00046009927203978 & 0.99976995036398 \tabularnewline
\hline
\end{tabular}
%Source: https://freestatistics.org/blog/index.php?pk=68376&T=5

[TABLE]
[ROW][C]Goldfeld-Quandt test for Heteroskedasticity[/C][/ROW]
[ROW][C]p-values[/C][C]Alternative Hypothesis[/C][/ROW]
[ROW][C]breakpoint index[/C][C]greater[/C][C]2-sided[/C][C]less[/C][/ROW]
[ROW][C]16[/C][C]0.155807742206136[/C][C]0.311615484412272[/C][C]0.844192257793864[/C][/ROW]
[ROW][C]17[/C][C]0.076846625956661[/C][C]0.153693251913322[/C][C]0.92315337404334[/C][/ROW]
[ROW][C]18[/C][C]0.0474884735704068[/C][C]0.0949769471408135[/C][C]0.952511526429593[/C][/ROW]
[ROW][C]19[/C][C]0.0477199697815761[/C][C]0.0954399395631522[/C][C]0.952280030218424[/C][/ROW]
[ROW][C]20[/C][C]0.0219261381343761[/C][C]0.0438522762687523[/C][C]0.978073861865624[/C][/ROW]
[ROW][C]21[/C][C]0.00908073518397626[/C][C]0.0181614703679525[/C][C]0.990919264816024[/C][/ROW]
[ROW][C]22[/C][C]0.00786877003815199[/C][C]0.0157375400763040[/C][C]0.992131229961848[/C][/ROW]
[ROW][C]23[/C][C]0.00955812919828087[/C][C]0.0191162583965617[/C][C]0.99044187080172[/C][/ROW]
[ROW][C]24[/C][C]0.00513985914235924[/C][C]0.0102797182847185[/C][C]0.99486014085764[/C][/ROW]
[ROW][C]25[/C][C]0.00761270150024891[/C][C]0.0152254030004978[/C][C]0.99238729849975[/C][/ROW]
[ROW][C]26[/C][C]0.0075653230722832[/C][C]0.0151306461445664[/C][C]0.992434676927717[/C][/ROW]
[ROW][C]27[/C][C]0.00931214718811198[/C][C]0.0186242943762240[/C][C]0.990687852811888[/C][/ROW]
[ROW][C]28[/C][C]0.00924918128439385[/C][C]0.0184983625687877[/C][C]0.990750818715606[/C][/ROW]
[ROW][C]29[/C][C]0.0526308169487893[/C][C]0.105261633897579[/C][C]0.94736918305121[/C][/ROW]
[ROW][C]30[/C][C]0.0315075174139895[/C][C]0.063015034827979[/C][C]0.96849248258601[/C][/ROW]
[ROW][C]31[/C][C]0.0255704308216063[/C][C]0.0511408616432125[/C][C]0.974429569178394[/C][/ROW]
[ROW][C]32[/C][C]0.0149995939161897[/C][C]0.0299991878323794[/C][C]0.98500040608381[/C][/ROW]
[ROW][C]33[/C][C]0.00812724110279539[/C][C]0.0162544822055908[/C][C]0.991872758897205[/C][/ROW]
[ROW][C]34[/C][C]0.00611448857758184[/C][C]0.0122289771551637[/C][C]0.993885511422418[/C][/ROW]
[ROW][C]35[/C][C]0.00378625815004067[/C][C]0.00757251630008134[/C][C]0.99621374184996[/C][/ROW]
[ROW][C]36[/C][C]0.00358091881440668[/C][C]0.00716183762881336[/C][C]0.996419081185593[/C][/ROW]
[ROW][C]37[/C][C]0.00402778060465449[/C][C]0.00805556120930899[/C][C]0.995972219395346[/C][/ROW]
[ROW][C]38[/C][C]0.00250945357175160[/C][C]0.00501890714350321[/C][C]0.997490546428248[/C][/ROW]
[ROW][C]39[/C][C]0.00278917250609998[/C][C]0.00557834501219996[/C][C]0.9972108274939[/C][/ROW]
[ROW][C]40[/C][C]0.00271486404368972[/C][C]0.00542972808737944[/C][C]0.99728513595631[/C][/ROW]
[ROW][C]41[/C][C]0.00118937713576875[/C][C]0.00237875427153749[/C][C]0.998810622864231[/C][/ROW]
[ROW][C]42[/C][C]0.000591390796176683[/C][C]0.00118278159235337[/C][C]0.999408609203823[/C][/ROW]
[ROW][C]43[/C][C]0.000218101638430536[/C][C]0.000436203276861072[/C][C]0.99978189836157[/C][/ROW]
[ROW][C]44[/C][C]0.000142087401796409[/C][C]0.000284174803592818[/C][C]0.999857912598204[/C][/ROW]
[ROW][C]45[/C][C]0.00023004963601989[/C][C]0.00046009927203978[/C][C]0.99976995036398[/C][/ROW]
[/TABLE]
Source: https://freestatistics.org/blog/index.php?pk=68376&T=5

Globally Unique Identifier (entire table): ba.freestatistics.org/blog/index.php?pk=68376&T=5

As an alternative you can also use a QR Code:  

The GUIDs for individual cells are displayed in the table below:

Goldfeld-Quandt test for Heteroskedasticity
p-valuesAlternative Hypothesis
breakpoint indexgreater2-sidedless
160.1558077422061360.3116154844122720.844192257793864
170.0768466259566610.1536932519133220.92315337404334
180.04748847357040680.09497694714081350.952511526429593
190.04771996978157610.09543993956315220.952280030218424
200.02192613813437610.04385227626875230.978073861865624
210.009080735183976260.01816147036795250.990919264816024
220.007868770038151990.01573754007630400.992131229961848
230.009558129198280870.01911625839656170.99044187080172
240.005139859142359240.01027971828471850.99486014085764
250.007612701500248910.01522540300049780.99238729849975
260.00756532307228320.01513064614456640.992434676927717
270.009312147188111980.01862429437622400.990687852811888
280.009249181284393850.01849836256878770.990750818715606
290.05263081694878930.1052616338975790.94736918305121
300.03150751741398950.0630150348279790.96849248258601
310.02557043082160630.05114086164321250.974429569178394
320.01499959391618970.02999918783237940.98500040608381
330.008127241102795390.01625448220559080.991872758897205
340.006114488577581840.01222897715516370.993885511422418
350.003786258150040670.007572516300081340.99621374184996
360.003580918814406680.007161837628813360.996419081185593
370.004027780604654490.008055561209308990.995972219395346
380.002509453571751600.005018907143503210.997490546428248
390.002789172506099980.005578345012199960.9972108274939
400.002714864043689720.005429728087379440.99728513595631
410.001189377135768750.002378754271537490.998810622864231
420.0005913907961766830.001182781592353370.999408609203823
430.0002181016384305360.0004362032768610720.99978189836157
440.0001420874017964090.0002841748035928180.999857912598204
450.000230049636019890.000460099272039780.99976995036398


Meta Analysis of Goldfeld-Quandt test for Heteroskedasticity
Description# significant tests% significant testsOK/NOK
1% type I error level110.366666666666667NOK
5% type I error level230.766666666666667NOK
10% type I error level270.9NOK

\begin{tabular}{lllllllll}
\hline
Meta Analysis of Goldfeld-Quandt test for Heteroskedasticity \tabularnewline
Description & # significant tests & % significant tests & OK/NOK \tabularnewline
1% type I error level & 11 & 0.366666666666667 & NOK \tabularnewline
5% type I error level & 23 & 0.766666666666667 & NOK \tabularnewline
10% type I error level & 27 & 0.9 & NOK \tabularnewline
\hline
\end{tabular}
%Source: https://freestatistics.org/blog/index.php?pk=68376&T=6

[TABLE]
[ROW][C]Meta Analysis of Goldfeld-Quandt test for Heteroskedasticity[/C][/ROW]
[ROW][C]Description[/C][C]# significant tests[/C][C]% significant tests[/C][C]OK/NOK[/C][/ROW]
[ROW][C]1% type I error level[/C][C]11[/C][C]0.366666666666667[/C][C]NOK[/C][/ROW]
[ROW][C]5% type I error level[/C][C]23[/C][C]0.766666666666667[/C][C]NOK[/C][/ROW]
[ROW][C]10% type I error level[/C][C]27[/C][C]0.9[/C][C]NOK[/C][/ROW]
[/TABLE]
Source: https://freestatistics.org/blog/index.php?pk=68376&T=6

Globally Unique Identifier (entire table): ba.freestatistics.org/blog/index.php?pk=68376&T=6

As an alternative you can also use a QR Code:  

The GUIDs for individual cells are displayed in the table below:

Meta Analysis of Goldfeld-Quandt test for Heteroskedasticity
Description# significant tests% significant testsOK/NOK
1% type I error level110.366666666666667NOK
5% type I error level230.766666666666667NOK
10% type I error level270.9NOK


Parameters (Session):
par1 = 1 ; par2 = Include Monthly Dummies ; par3 = No Linear Trend ;
Parameters (R input):
par1 = 1 ; par2 = Include Monthly Dummies ; par3 = No Linear Trend ;
R code (references can be found in the software module):
library(lattice)
library(lmtest)
n25 <- 25 #minimum number of obs. for Goldfeld-Quandt test
par1 <- as.numeric(par1)
x <- t(y)
k <- length(x[1,])
n <- length(x[,1])
x1 <- cbind(x[,par1], x[,1:k!=par1])
mycolnames <- c(colnames(x)[par1], colnames(x)[1:k!=par1])
colnames(x1) <- mycolnames #colnames(x)[par1]
x <- x1
if (par3 == 'First Differences'){
x2 <- array(0, dim=c(n-1,k), dimnames=list(1:(n-1), paste('(1-B)',colnames(x),sep='')))
for (i in 1:n-1) {
for (j in 1:k) {
x2[i,j] <- x[i+1,j] - x[i,j]
}
}
x <- x2
}
if (par2 == 'Include Monthly Dummies'){
x2 <- array(0, dim=c(n,11), dimnames=list(1:n, paste('M', seq(1:11), sep ='')))
for (i in 1:11){
x2[seq(i,n,12),i] <- 1
}
x <- cbind(x, x2)
}
if (par2 == 'Include Quarterly Dummies'){
x2 <- array(0, dim=c(n,3), dimnames=list(1:n, paste('Q', seq(1:3), sep ='')))
for (i in 1:3){
x2[seq(i,n,4),i] <- 1
}
x <- cbind(x, x2)
}
k <- length(x[1,])
if (par3 == 'Linear Trend'){
x <- cbind(x, c(1:n))
colnames(x)[k+1] <- 't'
}
x
k <- length(x[1,])
df <- as.data.frame(x)
(mylm <- lm(df))
(mysum <- summary(mylm))
if (n > n25) {
kp3 <- k + 3
nmkm3 <- n - k - 3
gqarr <- array(NA, dim=c(nmkm3-kp3+1,3))
numgqtests <- 0
numsignificant1 <- 0
numsignificant5 <- 0
numsignificant10 <- 0
for (mypoint in kp3:nmkm3) {
j <- 0
numgqtests <- numgqtests + 1
for (myalt in c('greater', 'two.sided', 'less')) {
j <- j + 1
gqarr[mypoint-kp3+1,j] <- gqtest(mylm, point=mypoint, alternative=myalt)$p.value
}
if (gqarr[mypoint-kp3+1,2] < 0.01) numsignificant1 <- numsignificant1 + 1
if (gqarr[mypoint-kp3+1,2] < 0.05) numsignificant5 <- numsignificant5 + 1
if (gqarr[mypoint-kp3+1,2] < 0.10) numsignificant10 <- numsignificant10 + 1
}
gqarr
}
bitmap(file='test0.png')
plot(x[,1], type='l', main='Actuals and Interpolation', ylab='value of Actuals and Interpolation (dots)', xlab='time or index')
points(x[,1]-mysum$resid)
grid()
dev.off()
bitmap(file='test1.png')
plot(mysum$resid, type='b', pch=19, main='Residuals', ylab='value of Residuals', xlab='time or index')
grid()
dev.off()
bitmap(file='test2.png')
hist(mysum$resid, main='Residual Histogram', xlab='values of Residuals')
grid()
dev.off()
bitmap(file='test3.png')
densityplot(~mysum$resid,col='black',main='Residual Density Plot', xlab='values of Residuals')
dev.off()
bitmap(file='test4.png')
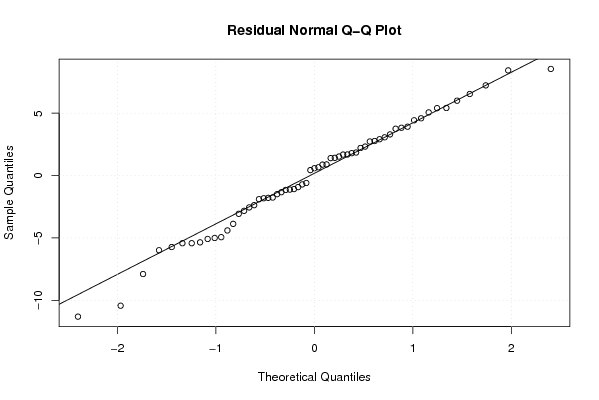
qqnorm(mysum$resid, main='Residual Normal Q-Q Plot')
qqline(mysum$resid)
grid()
dev.off()
(myerror <- as.ts(mysum$resid))
bitmap(file='test5.png')
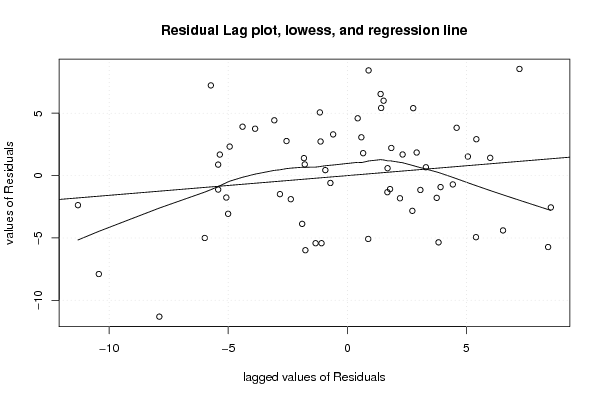
dum <- cbind(lag(myerror,k=1),myerror)
dum
dum1 <- dum[2:length(myerror),]
dum1
z <- as.data.frame(dum1)
z
plot(z,main=paste('Residual Lag plot, lowess, and regression line'), ylab='values of Residuals', xlab='lagged values of Residuals')
lines(lowess(z))
abline(lm(z))
grid()
dev.off()
bitmap(file='test6.png')
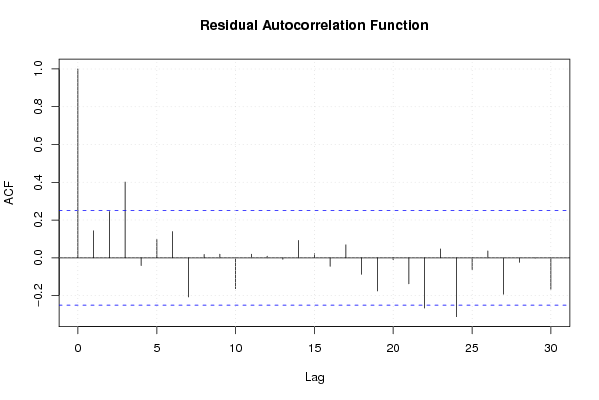
acf(mysum$resid, lag.max=length(mysum$resid)/2, main='Residual Autocorrelation Function')
grid()
dev.off()
bitmap(file='test7.png')
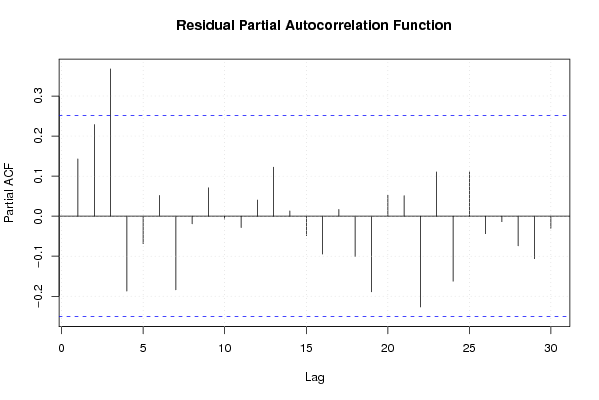
pacf(mysum$resid, lag.max=length(mysum$resid)/2, main='Residual Partial Autocorrelation Function')
grid()
dev.off()
bitmap(file='test8.png')
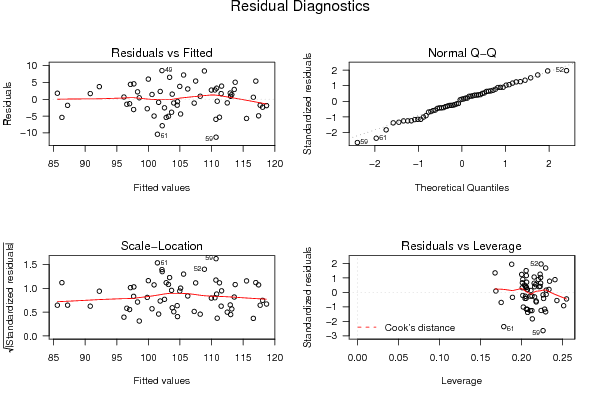
opar <- par(mfrow = c(2,2), oma = c(0, 0, 1.1, 0))
plot(mylm, las = 1, sub='Residual Diagnostics')
par(opar)
dev.off()
if (n > n25) {
bitmap(file='test9.png')
plot(kp3:nmkm3,gqarr[,2], main='Goldfeld-Quandt test',ylab='2-sided p-value',xlab='breakpoint')
grid()
dev.off()
}
load(file='createtable')
a<-table.start()
a<-table.row.start(a)
a<-table.element(a, 'Multiple Linear Regression - Estimated Regression Equation', 1, TRUE)
a<-table.row.end(a)
myeq <- colnames(x)[1]
myeq <- paste(myeq, '[t] = ', sep='')
for (i in 1:k){
if (mysum$coefficients[i,1] > 0) myeq <- paste(myeq, '+', '')
myeq <- paste(myeq, mysum$coefficients[i,1], sep=' ')
if (rownames(mysum$coefficients)[i] != '(Intercept)') {
myeq <- paste(myeq, rownames(mysum$coefficients)[i], sep='')
if (rownames(mysum$coefficients)[i] != 't') myeq <- paste(myeq, '[t]', sep='')
}
}
myeq <- paste(myeq, ' + e[t]')
a<-table.row.start(a)
a<-table.element(a, myeq)
a<-table.row.end(a)
a<-table.end(a)
table.save(a,file='mytable1.tab')
a<-table.start()
a<-table.row.start(a)
a<-table.element(a,hyperlink('ols1.htm','Multiple Linear Regression - Ordinary Least Squares',''), 6, TRUE)
a<-table.row.end(a)
a<-table.row.start(a)
a<-table.element(a,'Variable',header=TRUE)
a<-table.element(a,'Parameter',header=TRUE)
a<-table.element(a,'S.D.',header=TRUE)
a<-table.element(a,'T-STAT
H0: parameter = 0',header=TRUE)
a<-table.element(a,'2-tail p-value',header=TRUE)
a<-table.element(a,'1-tail p-value',header=TRUE)
a<-table.row.end(a)
for (i in 1:k){
a<-table.row.start(a)
a<-table.element(a,rownames(mysum$coefficients)[i],header=TRUE)
a<-table.element(a,mysum$coefficients[i,1])
a<-table.element(a, round(mysum$coefficients[i,2],6))
a<-table.element(a, round(mysum$coefficients[i,3],4))
a<-table.element(a, round(mysum$coefficients[i,4],6))
a<-table.element(a, round(mysum$coefficients[i,4]/2,6))
a<-table.row.end(a)
}
a<-table.end(a)
table.save(a,file='mytable2.tab')
a<-table.start()
a<-table.row.start(a)
a<-table.element(a, 'Multiple Linear Regression - Regression Statistics', 2, TRUE)
a<-table.row.end(a)
a<-table.row.start(a)
a<-table.element(a, 'Multiple R',1,TRUE)
a<-table.element(a, sqrt(mysum$r.squared))
a<-table.row.end(a)
a<-table.row.start(a)
a<-table.element(a, 'R-squared',1,TRUE)
a<-table.element(a, mysum$r.squared)
a<-table.row.end(a)
a<-table.row.start(a)
a<-table.element(a, 'Adjusted R-squared',1,TRUE)
a<-table.element(a, mysum$adj.r.squared)
a<-table.row.end(a)
a<-table.row.start(a)
a<-table.element(a, 'F-TEST (value)',1,TRUE)
a<-table.element(a, mysum$fstatistic[1])
a<-table.row.end(a)
a<-table.row.start(a)
a<-table.element(a, 'F-TEST (DF numerator)',1,TRUE)
a<-table.element(a, mysum$fstatistic[2])
a<-table.row.end(a)
a<-table.row.start(a)
a<-table.element(a, 'F-TEST (DF denominator)',1,TRUE)
a<-table.element(a, mysum$fstatistic[3])
a<-table.row.end(a)
a<-table.row.start(a)
a<-table.element(a, 'p-value',1,TRUE)
a<-table.element(a, 1-pf(mysum$fstatistic[1],mysum$fstatistic[2],mysum$fstatistic[3]))
a<-table.row.end(a)
a<-table.row.start(a)
a<-table.element(a, 'Multiple Linear Regression - Residual Statistics', 2, TRUE)
a<-table.row.end(a)
a<-table.row.start(a)
a<-table.element(a, 'Residual Standard Deviation',1,TRUE)
a<-table.element(a, mysum$sigma)
a<-table.row.end(a)
a<-table.row.start(a)
a<-table.element(a, 'Sum Squared Residuals',1,TRUE)
a<-table.element(a, sum(myerror*myerror))
a<-table.row.end(a)
a<-table.end(a)
table.save(a,file='mytable3.tab')
a<-table.start()
a<-table.row.start(a)
a<-table.element(a, 'Multiple Linear Regression - Actuals, Interpolation, and Residuals', 4, TRUE)
a<-table.row.end(a)
a<-table.row.start(a)
a<-table.element(a, 'Time or Index', 1, TRUE)
a<-table.element(a, 'Actuals', 1, TRUE)
a<-table.element(a, 'Interpolation
Forecast', 1, TRUE)
a<-table.element(a, 'Residuals
Prediction Error', 1, TRUE)
a<-table.row.end(a)
for (i in 1:n) {
a<-table.row.start(a)
a<-table.element(a,i, 1, TRUE)
a<-table.element(a,x[i])
a<-table.element(a,x[i]-mysum$resid[i])
a<-table.element(a,mysum$resid[i])
a<-table.row.end(a)
}
a<-table.end(a)
table.save(a,file='mytable4.tab')
if (n > n25) {
a<-table.start()
a<-table.row.start(a)
a<-table.element(a,'Goldfeld-Quandt test for Heteroskedasticity',4,TRUE)
a<-table.row.end(a)
a<-table.row.start(a)
a<-table.element(a,'p-values',header=TRUE)
a<-table.element(a,'Alternative Hypothesis',3,header=TRUE)
a<-table.row.end(a)
a<-table.row.start(a)
a<-table.element(a,'breakpoint index',header=TRUE)
a<-table.element(a,'greater',header=TRUE)
a<-table.element(a,'2-sided',header=TRUE)
a<-table.element(a,'less',header=TRUE)
a<-table.row.end(a)
for (mypoint in kp3:nmkm3) {
a<-table.row.start(a)
a<-table.element(a,mypoint,header=TRUE)
a<-table.element(a,gqarr[mypoint-kp3+1,1])
a<-table.element(a,gqarr[mypoint-kp3+1,2])
a<-table.element(a,gqarr[mypoint-kp3+1,3])
a<-table.row.end(a)
}
a<-table.end(a)
table.save(a,file='mytable5.tab')
a<-table.start()
a<-table.row.start(a)
a<-table.element(a,'Meta Analysis of Goldfeld-Quandt test for Heteroskedasticity',4,TRUE)
a<-table.row.end(a)
a<-table.row.start(a)
a<-table.element(a,'Description',header=TRUE)
a<-table.element(a,'# significant tests',header=TRUE)
a<-table.element(a,'% significant tests',header=TRUE)
a<-table.element(a,'OK/NOK',header=TRUE)
a<-table.row.end(a)
a<-table.row.start(a)
a<-table.element(a,'1% type I error level',header=TRUE)
a<-table.element(a,numsignificant1)
a<-table.element(a,numsignificant1/numgqtests)
if (numsignificant1/numgqtests < 0.01) dum <- 'OK' else dum <- 'NOK'
a<-table.element(a,dum)
a<-table.row.end(a)
a<-table.row.start(a)
a<-table.element(a,'5% type I error level',header=TRUE)
a<-table.element(a,numsignificant5)
a<-table.element(a,numsignificant5/numgqtests)
if (numsignificant5/numgqtests < 0.05) dum <- 'OK' else dum <- 'NOK'
a<-table.element(a,dum)
a<-table.row.end(a)
a<-table.row.start(a)
a<-table.element(a,'10% type I error level',header=TRUE)
a<-table.element(a,numsignificant10)
a<-table.element(a,numsignificant10/numgqtests)
if (numsignificant10/numgqtests < 0.1) dum <- 'OK' else dum <- 'NOK'
a<-table.element(a,dum)
a<-table.row.end(a)
a<-table.end(a)
table.save(a,file='mytable6.tab')
}