Free Statistics

of Irreproducible Research!

Author's title

Author*The author of this computation has been verified*
R Software Modulerwasp_autocorrelation.wasp
Title produced by software(Partial) Autocorrelation Function
Date of computationWed, 16 Dec 2009 07:16:06 -0700
Cite this page as followsStatistical Computations at FreeStatistics.org, Office for Research Development and Education, URL https://freestatistics.org/blog/index.php?v=date/2009/Dec/16/t12609731213n3f1jov3latai5.htm/, Retrieved Tue, 30 Apr 2024 09:39:44 +0000
Statistical Computations at FreeStatistics.org, Office for Research Development and Education, URL https://freestatistics.org/blog/index.php?pk=68367, Retrieved Tue, 30 Apr 2024 09:39:44 +0000
QR Codes:

Original text written by user:
IsPrivate?No (this computation is public)
User-defined keywords
Estimated Impact113
Family? (F = Feedback message, R = changed R code, M = changed R Module, P = changed Parameters, D = changed Data)
-     [Univariate Data Series] [data set] [2008-12-01 19:54:57] [b98453cac15ba1066b407e146608df68]
- RMP   [(Partial) Autocorrelation Function] [] [2009-11-27 14:47:30] [b98453cac15ba1066b407e146608df68]
-    D      [(Partial) Autocorrelation Function] [] [2009-12-16 14:16:06] [7cc673c2b3a8ab442a3ec6ca430f2445] [Current]
Feedback Forum

Post a new message
Dataseries X:
19915
19843
19761
20858
21968
23061
22661
22269
21857
21568
21274
20987
19683
19381
19071
20772
22485
24181
23479
22782
22067
21489
20903
20330
19736
19483
19242
20334
21423
22523
21986
21462
20908
20575
20237
19904
19610
19251
18941
20450
21946
23409
22741
22069
21539
21189
20960
20704
19697
19598
19456
20316
21083
22158
21469
20892
20578
20233
19947
20049


Summary of computational transaction
Raw Inputview raw input (R code)
Raw Outputview raw output of R engine
Computing time1 seconds
R Server'Gwilym Jenkins' @ 72.249.127.135

\begin{tabular}{lllllllll}
\hline
Summary of computational transaction \tabularnewline
Raw Input & view raw input (R code)  \tabularnewline
Raw Output & view raw output of R engine  \tabularnewline
Computing time & 1 seconds \tabularnewline
R Server & 'Gwilym Jenkins' @ 72.249.127.135 \tabularnewline
\hline
\end{tabular}
%Source: https://freestatistics.org/blog/index.php?pk=68367&T=0

[TABLE]
[ROW][C]Summary of computational transaction[/C][/ROW]
[ROW][C]Raw Input[/C][C]view raw input (R code) [/C][/ROW]
[ROW][C]Raw Output[/C][C]view raw output of R engine [/C][/ROW]
[ROW][C]Computing time[/C][C]1 seconds[/C][/ROW]
[ROW][C]R Server[/C][C]'Gwilym Jenkins' @ 72.249.127.135[/C][/ROW]
[/TABLE]
Source: https://freestatistics.org/blog/index.php?pk=68367&T=0

Globally Unique Identifier (entire table): ba.freestatistics.org/blog/index.php?pk=68367&T=0

As an alternative you can also use a QR Code:  

The GUIDs for individual cells are displayed in the table below:

Summary of computational transaction
Raw Inputview raw input (R code)
Raw Outputview raw output of R engine
Computing time1 seconds
R Server'Gwilym Jenkins' @ 72.249.127.135


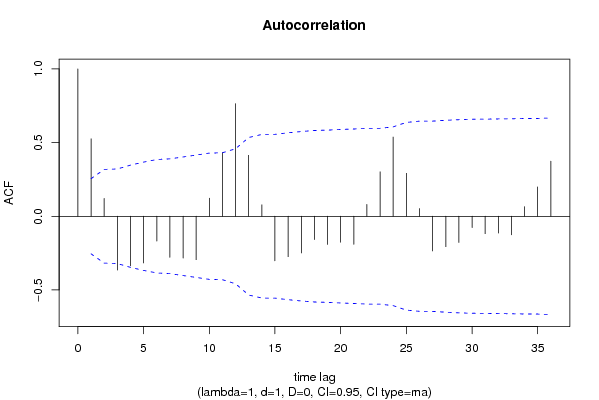
Autocorrelation Function
Time lag kACF(k)T-STATP-value
10.5260694.04087.8e-05
20.1205280.92580.179163
3-0.365585-2.80810.003373
4-0.33635-2.58360.006138
5-0.316645-2.43220.00903
6-0.168755-1.29620.099972
7-0.278575-2.13980.01826
8-0.283565-2.17810.016704
9-0.294642-2.26320.013659
100.1223850.94010.175511
110.43223.31980.000774
120.7641595.86960
130.4137543.17810.00118
140.0779320.59860.275863
15-0.302453-2.32320.011818
16-0.274312-2.1070.019688
17-0.249152-1.91380.030252
18-0.157955-1.21330.11493
19-0.191602-1.47170.073204
20-0.175736-1.34990.091109
21-0.190389-1.46240.074469
220.0798990.61370.270881
230.3014382.31540.012044
240.5374584.12835.8e-05
250.2914922.2390.01447
260.0517950.39780.346091
27-0.235563-1.80940.037743
28-0.206251-1.58420.059242
29-0.177839-1.3660.088561
30-0.07678-0.58980.278803
31-0.118379-0.90930.183449
32-0.114361-0.87840.191638
33-0.126149-0.9690.168258
340.0647010.4970.310526
350.1991411.52960.065726
360.3735822.86950.002849

\begin{tabular}{lllllllll}
\hline
Autocorrelation Function \tabularnewline
Time lag k & ACF(k) & T-STAT & P-value \tabularnewline
1 & 0.526069 & 4.0408 & 7.8e-05 \tabularnewline
2 & 0.120528 & 0.9258 & 0.179163 \tabularnewline
3 & -0.365585 & -2.8081 & 0.003373 \tabularnewline
4 & -0.33635 & -2.5836 & 0.006138 \tabularnewline
5 & -0.316645 & -2.4322 & 0.00903 \tabularnewline
6 & -0.168755 & -1.2962 & 0.099972 \tabularnewline
7 & -0.278575 & -2.1398 & 0.01826 \tabularnewline
8 & -0.283565 & -2.1781 & 0.016704 \tabularnewline
9 & -0.294642 & -2.2632 & 0.013659 \tabularnewline
10 & 0.122385 & 0.9401 & 0.175511 \tabularnewline
11 & 0.4322 & 3.3198 & 0.000774 \tabularnewline
12 & 0.764159 & 5.8696 & 0 \tabularnewline
13 & 0.413754 & 3.1781 & 0.00118 \tabularnewline
14 & 0.077932 & 0.5986 & 0.275863 \tabularnewline
15 & -0.302453 & -2.3232 & 0.011818 \tabularnewline
16 & -0.274312 & -2.107 & 0.019688 \tabularnewline
17 & -0.249152 & -1.9138 & 0.030252 \tabularnewline
18 & -0.157955 & -1.2133 & 0.11493 \tabularnewline
19 & -0.191602 & -1.4717 & 0.073204 \tabularnewline
20 & -0.175736 & -1.3499 & 0.091109 \tabularnewline
21 & -0.190389 & -1.4624 & 0.074469 \tabularnewline
22 & 0.079899 & 0.6137 & 0.270881 \tabularnewline
23 & 0.301438 & 2.3154 & 0.012044 \tabularnewline
24 & 0.537458 & 4.1283 & 5.8e-05 \tabularnewline
25 & 0.291492 & 2.239 & 0.01447 \tabularnewline
26 & 0.051795 & 0.3978 & 0.346091 \tabularnewline
27 & -0.235563 & -1.8094 & 0.037743 \tabularnewline
28 & -0.206251 & -1.5842 & 0.059242 \tabularnewline
29 & -0.177839 & -1.366 & 0.088561 \tabularnewline
30 & -0.07678 & -0.5898 & 0.278803 \tabularnewline
31 & -0.118379 & -0.9093 & 0.183449 \tabularnewline
32 & -0.114361 & -0.8784 & 0.191638 \tabularnewline
33 & -0.126149 & -0.969 & 0.168258 \tabularnewline
34 & 0.064701 & 0.497 & 0.310526 \tabularnewline
35 & 0.199141 & 1.5296 & 0.065726 \tabularnewline
36 & 0.373582 & 2.8695 & 0.002849 \tabularnewline
\hline
\end{tabular}
%Source: https://freestatistics.org/blog/index.php?pk=68367&T=1

[TABLE]
[ROW][C]Autocorrelation Function[/C][/ROW]
[ROW][C]Time lag k[/C][C]ACF(k)[/C][C]T-STAT[/C][C]P-value[/C][/ROW]
[ROW][C]1[/C][C]0.526069[/C][C]4.0408[/C][C]7.8e-05[/C][/ROW]
[ROW][C]2[/C][C]0.120528[/C][C]0.9258[/C][C]0.179163[/C][/ROW]
[ROW][C]3[/C][C]-0.365585[/C][C]-2.8081[/C][C]0.003373[/C][/ROW]
[ROW][C]4[/C][C]-0.33635[/C][C]-2.5836[/C][C]0.006138[/C][/ROW]
[ROW][C]5[/C][C]-0.316645[/C][C]-2.4322[/C][C]0.00903[/C][/ROW]
[ROW][C]6[/C][C]-0.168755[/C][C]-1.2962[/C][C]0.099972[/C][/ROW]
[ROW][C]7[/C][C]-0.278575[/C][C]-2.1398[/C][C]0.01826[/C][/ROW]
[ROW][C]8[/C][C]-0.283565[/C][C]-2.1781[/C][C]0.016704[/C][/ROW]
[ROW][C]9[/C][C]-0.294642[/C][C]-2.2632[/C][C]0.013659[/C][/ROW]
[ROW][C]10[/C][C]0.122385[/C][C]0.9401[/C][C]0.175511[/C][/ROW]
[ROW][C]11[/C][C]0.4322[/C][C]3.3198[/C][C]0.000774[/C][/ROW]
[ROW][C]12[/C][C]0.764159[/C][C]5.8696[/C][C]0[/C][/ROW]
[ROW][C]13[/C][C]0.413754[/C][C]3.1781[/C][C]0.00118[/C][/ROW]
[ROW][C]14[/C][C]0.077932[/C][C]0.5986[/C][C]0.275863[/C][/ROW]
[ROW][C]15[/C][C]-0.302453[/C][C]-2.3232[/C][C]0.011818[/C][/ROW]
[ROW][C]16[/C][C]-0.274312[/C][C]-2.107[/C][C]0.019688[/C][/ROW]
[ROW][C]17[/C][C]-0.249152[/C][C]-1.9138[/C][C]0.030252[/C][/ROW]
[ROW][C]18[/C][C]-0.157955[/C][C]-1.2133[/C][C]0.11493[/C][/ROW]
[ROW][C]19[/C][C]-0.191602[/C][C]-1.4717[/C][C]0.073204[/C][/ROW]
[ROW][C]20[/C][C]-0.175736[/C][C]-1.3499[/C][C]0.091109[/C][/ROW]
[ROW][C]21[/C][C]-0.190389[/C][C]-1.4624[/C][C]0.074469[/C][/ROW]
[ROW][C]22[/C][C]0.079899[/C][C]0.6137[/C][C]0.270881[/C][/ROW]
[ROW][C]23[/C][C]0.301438[/C][C]2.3154[/C][C]0.012044[/C][/ROW]
[ROW][C]24[/C][C]0.537458[/C][C]4.1283[/C][C]5.8e-05[/C][/ROW]
[ROW][C]25[/C][C]0.291492[/C][C]2.239[/C][C]0.01447[/C][/ROW]
[ROW][C]26[/C][C]0.051795[/C][C]0.3978[/C][C]0.346091[/C][/ROW]
[ROW][C]27[/C][C]-0.235563[/C][C]-1.8094[/C][C]0.037743[/C][/ROW]
[ROW][C]28[/C][C]-0.206251[/C][C]-1.5842[/C][C]0.059242[/C][/ROW]
[ROW][C]29[/C][C]-0.177839[/C][C]-1.366[/C][C]0.088561[/C][/ROW]
[ROW][C]30[/C][C]-0.07678[/C][C]-0.5898[/C][C]0.278803[/C][/ROW]
[ROW][C]31[/C][C]-0.118379[/C][C]-0.9093[/C][C]0.183449[/C][/ROW]
[ROW][C]32[/C][C]-0.114361[/C][C]-0.8784[/C][C]0.191638[/C][/ROW]
[ROW][C]33[/C][C]-0.126149[/C][C]-0.969[/C][C]0.168258[/C][/ROW]
[ROW][C]34[/C][C]0.064701[/C][C]0.497[/C][C]0.310526[/C][/ROW]
[ROW][C]35[/C][C]0.199141[/C][C]1.5296[/C][C]0.065726[/C][/ROW]
[ROW][C]36[/C][C]0.373582[/C][C]2.8695[/C][C]0.002849[/C][/ROW]
[/TABLE]
Source: https://freestatistics.org/blog/index.php?pk=68367&T=1

Globally Unique Identifier (entire table): ba.freestatistics.org/blog/index.php?pk=68367&T=1

As an alternative you can also use a QR Code:  

The GUIDs for individual cells are displayed in the table below:

Autocorrelation Function
Time lag kACF(k)T-STATP-value
10.5260694.04087.8e-05
20.1205280.92580.179163
3-0.365585-2.80810.003373
4-0.33635-2.58360.006138
5-0.316645-2.43220.00903
6-0.168755-1.29620.099972
7-0.278575-2.13980.01826
8-0.283565-2.17810.016704
9-0.294642-2.26320.013659
100.1223850.94010.175511
110.43223.31980.000774
120.7641595.86960
130.4137543.17810.00118
140.0779320.59860.275863
15-0.302453-2.32320.011818
16-0.274312-2.1070.019688
17-0.249152-1.91380.030252
18-0.157955-1.21330.11493
19-0.191602-1.47170.073204
20-0.175736-1.34990.091109
21-0.190389-1.46240.074469
220.0798990.61370.270881
230.3014382.31540.012044
240.5374584.12835.8e-05
250.2914922.2390.01447
260.0517950.39780.346091
27-0.235563-1.80940.037743
28-0.206251-1.58420.059242
29-0.177839-1.3660.088561
30-0.07678-0.58980.278803
31-0.118379-0.90930.183449
32-0.114361-0.87840.191638
33-0.126149-0.9690.168258
340.0647010.4970.310526
350.1991411.52960.065726
360.3735822.86950.002849


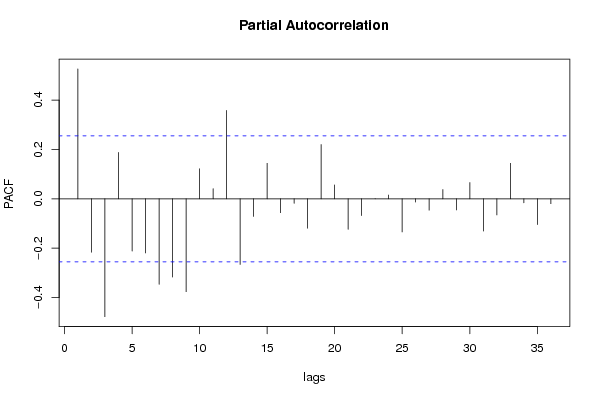
Partial Autocorrelation Function
Time lag kPACF(k)T-STATP-value
10.5260694.04087.8e-05
2-0.215999-1.65910.0512
3-0.477233-3.66570.000265
40.1880391.44440.076965
5-0.211635-1.62560.054682
6-0.219401-1.68520.048612
7-0.34649-2.66140.005004
8-0.316668-2.43240.009026
9-0.376313-2.89050.002687
100.1217130.93490.176826
110.0411630.31620.376491
120.3578042.74830.003967
13-0.265751-2.04130.022852
14-0.071407-0.54850.292712
150.1438141.10470.136897
16-0.056016-0.43030.334285
17-0.018186-0.13970.444692
18-0.118801-0.91250.182602
190.2198161.68840.048304
200.0564970.4340.332949
21-0.123512-0.94870.173318
22-0.06788-0.52140.302022
230.000410.00310.498749
240.0150470.11560.454189
25-0.133866-1.02820.154016
26-0.013163-0.10110.459905
27-0.046145-0.35440.362134
280.0374370.28760.387345
29-0.045204-0.34720.364831
300.0657350.50490.307749
31-0.130486-1.00230.16015
32-0.065313-0.50170.308881
330.1437141.10390.137061
34-0.015921-0.12230.451541
35-0.10422-0.80050.213307
36-0.019853-0.15250.43966

\begin{tabular}{lllllllll}
\hline
Partial Autocorrelation Function \tabularnewline
Time lag k & PACF(k) & T-STAT & P-value \tabularnewline
1 & 0.526069 & 4.0408 & 7.8e-05 \tabularnewline
2 & -0.215999 & -1.6591 & 0.0512 \tabularnewline
3 & -0.477233 & -3.6657 & 0.000265 \tabularnewline
4 & 0.188039 & 1.4444 & 0.076965 \tabularnewline
5 & -0.211635 & -1.6256 & 0.054682 \tabularnewline
6 & -0.219401 & -1.6852 & 0.048612 \tabularnewline
7 & -0.34649 & -2.6614 & 0.005004 \tabularnewline
8 & -0.316668 & -2.4324 & 0.009026 \tabularnewline
9 & -0.376313 & -2.8905 & 0.002687 \tabularnewline
10 & 0.121713 & 0.9349 & 0.176826 \tabularnewline
11 & 0.041163 & 0.3162 & 0.376491 \tabularnewline
12 & 0.357804 & 2.7483 & 0.003967 \tabularnewline
13 & -0.265751 & -2.0413 & 0.022852 \tabularnewline
14 & -0.071407 & -0.5485 & 0.292712 \tabularnewline
15 & 0.143814 & 1.1047 & 0.136897 \tabularnewline
16 & -0.056016 & -0.4303 & 0.334285 \tabularnewline
17 & -0.018186 & -0.1397 & 0.444692 \tabularnewline
18 & -0.118801 & -0.9125 & 0.182602 \tabularnewline
19 & 0.219816 & 1.6884 & 0.048304 \tabularnewline
20 & 0.056497 & 0.434 & 0.332949 \tabularnewline
21 & -0.123512 & -0.9487 & 0.173318 \tabularnewline
22 & -0.06788 & -0.5214 & 0.302022 \tabularnewline
23 & 0.00041 & 0.0031 & 0.498749 \tabularnewline
24 & 0.015047 & 0.1156 & 0.454189 \tabularnewline
25 & -0.133866 & -1.0282 & 0.154016 \tabularnewline
26 & -0.013163 & -0.1011 & 0.459905 \tabularnewline
27 & -0.046145 & -0.3544 & 0.362134 \tabularnewline
28 & 0.037437 & 0.2876 & 0.387345 \tabularnewline
29 & -0.045204 & -0.3472 & 0.364831 \tabularnewline
30 & 0.065735 & 0.5049 & 0.307749 \tabularnewline
31 & -0.130486 & -1.0023 & 0.16015 \tabularnewline
32 & -0.065313 & -0.5017 & 0.308881 \tabularnewline
33 & 0.143714 & 1.1039 & 0.137061 \tabularnewline
34 & -0.015921 & -0.1223 & 0.451541 \tabularnewline
35 & -0.10422 & -0.8005 & 0.213307 \tabularnewline
36 & -0.019853 & -0.1525 & 0.43966 \tabularnewline
\hline
\end{tabular}
%Source: https://freestatistics.org/blog/index.php?pk=68367&T=2

[TABLE]
[ROW][C]Partial Autocorrelation Function[/C][/ROW]
[ROW][C]Time lag k[/C][C]PACF(k)[/C][C]T-STAT[/C][C]P-value[/C][/ROW]
[ROW][C]1[/C][C]0.526069[/C][C]4.0408[/C][C]7.8e-05[/C][/ROW]
[ROW][C]2[/C][C]-0.215999[/C][C]-1.6591[/C][C]0.0512[/C][/ROW]
[ROW][C]3[/C][C]-0.477233[/C][C]-3.6657[/C][C]0.000265[/C][/ROW]
[ROW][C]4[/C][C]0.188039[/C][C]1.4444[/C][C]0.076965[/C][/ROW]
[ROW][C]5[/C][C]-0.211635[/C][C]-1.6256[/C][C]0.054682[/C][/ROW]
[ROW][C]6[/C][C]-0.219401[/C][C]-1.6852[/C][C]0.048612[/C][/ROW]
[ROW][C]7[/C][C]-0.34649[/C][C]-2.6614[/C][C]0.005004[/C][/ROW]
[ROW][C]8[/C][C]-0.316668[/C][C]-2.4324[/C][C]0.009026[/C][/ROW]
[ROW][C]9[/C][C]-0.376313[/C][C]-2.8905[/C][C]0.002687[/C][/ROW]
[ROW][C]10[/C][C]0.121713[/C][C]0.9349[/C][C]0.176826[/C][/ROW]
[ROW][C]11[/C][C]0.041163[/C][C]0.3162[/C][C]0.376491[/C][/ROW]
[ROW][C]12[/C][C]0.357804[/C][C]2.7483[/C][C]0.003967[/C][/ROW]
[ROW][C]13[/C][C]-0.265751[/C][C]-2.0413[/C][C]0.022852[/C][/ROW]
[ROW][C]14[/C][C]-0.071407[/C][C]-0.5485[/C][C]0.292712[/C][/ROW]
[ROW][C]15[/C][C]0.143814[/C][C]1.1047[/C][C]0.136897[/C][/ROW]
[ROW][C]16[/C][C]-0.056016[/C][C]-0.4303[/C][C]0.334285[/C][/ROW]
[ROW][C]17[/C][C]-0.018186[/C][C]-0.1397[/C][C]0.444692[/C][/ROW]
[ROW][C]18[/C][C]-0.118801[/C][C]-0.9125[/C][C]0.182602[/C][/ROW]
[ROW][C]19[/C][C]0.219816[/C][C]1.6884[/C][C]0.048304[/C][/ROW]
[ROW][C]20[/C][C]0.056497[/C][C]0.434[/C][C]0.332949[/C][/ROW]
[ROW][C]21[/C][C]-0.123512[/C][C]-0.9487[/C][C]0.173318[/C][/ROW]
[ROW][C]22[/C][C]-0.06788[/C][C]-0.5214[/C][C]0.302022[/C][/ROW]
[ROW][C]23[/C][C]0.00041[/C][C]0.0031[/C][C]0.498749[/C][/ROW]
[ROW][C]24[/C][C]0.015047[/C][C]0.1156[/C][C]0.454189[/C][/ROW]
[ROW][C]25[/C][C]-0.133866[/C][C]-1.0282[/C][C]0.154016[/C][/ROW]
[ROW][C]26[/C][C]-0.013163[/C][C]-0.1011[/C][C]0.459905[/C][/ROW]
[ROW][C]27[/C][C]-0.046145[/C][C]-0.3544[/C][C]0.362134[/C][/ROW]
[ROW][C]28[/C][C]0.037437[/C][C]0.2876[/C][C]0.387345[/C][/ROW]
[ROW][C]29[/C][C]-0.045204[/C][C]-0.3472[/C][C]0.364831[/C][/ROW]
[ROW][C]30[/C][C]0.065735[/C][C]0.5049[/C][C]0.307749[/C][/ROW]
[ROW][C]31[/C][C]-0.130486[/C][C]-1.0023[/C][C]0.16015[/C][/ROW]
[ROW][C]32[/C][C]-0.065313[/C][C]-0.5017[/C][C]0.308881[/C][/ROW]
[ROW][C]33[/C][C]0.143714[/C][C]1.1039[/C][C]0.137061[/C][/ROW]
[ROW][C]34[/C][C]-0.015921[/C][C]-0.1223[/C][C]0.451541[/C][/ROW]
[ROW][C]35[/C][C]-0.10422[/C][C]-0.8005[/C][C]0.213307[/C][/ROW]
[ROW][C]36[/C][C]-0.019853[/C][C]-0.1525[/C][C]0.43966[/C][/ROW]
[/TABLE]
Source: https://freestatistics.org/blog/index.php?pk=68367&T=2

Globally Unique Identifier (entire table): ba.freestatistics.org/blog/index.php?pk=68367&T=2

As an alternative you can also use a QR Code:  

The GUIDs for individual cells are displayed in the table below:

Partial Autocorrelation Function
Time lag kPACF(k)T-STATP-value
10.5260694.04087.8e-05
2-0.215999-1.65910.0512
3-0.477233-3.66570.000265
40.1880391.44440.076965
5-0.211635-1.62560.054682
6-0.219401-1.68520.048612
7-0.34649-2.66140.005004
8-0.316668-2.43240.009026
9-0.376313-2.89050.002687
100.1217130.93490.176826
110.0411630.31620.376491
120.3578042.74830.003967
13-0.265751-2.04130.022852
14-0.071407-0.54850.292712
150.1438141.10470.136897
16-0.056016-0.43030.334285
17-0.018186-0.13970.444692
18-0.118801-0.91250.182602
190.2198161.68840.048304
200.0564970.4340.332949
21-0.123512-0.94870.173318
22-0.06788-0.52140.302022
230.000410.00310.498749
240.0150470.11560.454189
25-0.133866-1.02820.154016
26-0.013163-0.10110.459905
27-0.046145-0.35440.362134
280.0374370.28760.387345
29-0.045204-0.34720.364831
300.0657350.50490.307749
31-0.130486-1.00230.16015
32-0.065313-0.50170.308881
330.1437141.10390.137061
34-0.015921-0.12230.451541
35-0.10422-0.80050.213307
36-0.019853-0.15250.43966


Parameters (Session):
par1 = 36 ; par2 = 1 ; par3 = 1 ; par4 = 0 ; par5 = 12 ; par6 = MA ; par7 = 0.95 ;
Parameters (R input):
par1 = 36 ; par2 = 1 ; par3 = 1 ; par4 = 0 ; par5 = 12 ; par6 = MA ; par7 = 0.95 ;
R code (references can be found in the software module):
if (par1 == 'Default') {
par1 = 10*log10(length(x))
} else {
par1 <- as.numeric(par1)
}
par2 <- as.numeric(par2)
par3 <- as.numeric(par3)
par4 <- as.numeric(par4)
par5 <- as.numeric(par5)
if (par6 == 'White Noise') par6 <- 'white' else par6 <- 'ma'
par7 <- as.numeric(par7)
if (par2 == 0) {
x <- log(x)
} else {
x <- (x ^ par2 - 1) / par2
}
if (par3 > 0) x <- diff(x,lag=1,difference=par3)
if (par4 > 0) x <- diff(x,lag=par5,difference=par4)
bitmap(file='pic1.png')
racf <- acf(x, par1, main='Autocorrelation', xlab='time lag', ylab='ACF', ci.type=par6, ci=par7, sub=paste('(lambda=',par2,', d=',par3,', D=',par4,', CI=', par7, ', CI type=',par6,')',sep=''))
dev.off()
bitmap(file='pic2.png')
rpacf <- pacf(x,par1,main='Partial Autocorrelation',xlab='lags',ylab='PACF')
dev.off()
(myacf <- c(racf$acf))
(mypacf <- c(rpacf$acf))
lengthx <- length(x)
sqrtn <- sqrt(lengthx)
load(file='createtable')
a<-table.start()
a<-table.row.start(a)
a<-table.element(a,'Autocorrelation Function',4,TRUE)
a<-table.row.end(a)
a<-table.row.start(a)
a<-table.element(a,'Time lag k',header=TRUE)
a<-table.element(a,hyperlink('basics.htm','ACF(k)','click here for more information about the Autocorrelation Function'),header=TRUE)
a<-table.element(a,'T-STAT',header=TRUE)
a<-table.element(a,'P-value',header=TRUE)
a<-table.row.end(a)
for (i in 2:(par1+1)) {
a<-table.row.start(a)
a<-table.element(a,i-1,header=TRUE)
a<-table.element(a,round(myacf[i],6))
mytstat <- myacf[i]*sqrtn
a<-table.element(a,round(mytstat,4))
a<-table.element(a,round(1-pt(abs(mytstat),lengthx),6))
a<-table.row.end(a)
}
a<-table.end(a)
table.save(a,file='mytable.tab')
a<-table.start()
a<-table.row.start(a)
a<-table.element(a,'Partial Autocorrelation Function',4,TRUE)
a<-table.row.end(a)
a<-table.row.start(a)
a<-table.element(a,'Time lag k',header=TRUE)
a<-table.element(a,hyperlink('basics.htm','PACF(k)','click here for more information about the Partial Autocorrelation Function'),header=TRUE)
a<-table.element(a,'T-STAT',header=TRUE)
a<-table.element(a,'P-value',header=TRUE)
a<-table.row.end(a)
for (i in 1:par1) {
a<-table.row.start(a)
a<-table.element(a,i,header=TRUE)
a<-table.element(a,round(mypacf[i],6))
mytstat <- mypacf[i]*sqrtn
a<-table.element(a,round(mytstat,4))
a<-table.element(a,round(1-pt(abs(mytstat),lengthx),6))
a<-table.row.end(a)
}
a<-table.end(a)
table.save(a,file='mytable1.tab')