Free Statistics

of Irreproducible Research!

Author's title

Author*The author of this computation has been verified*
R Software Modulerwasp_exponentialsmoothing.wasp
Title produced by softwareExponential Smoothing
Date of computationWed, 16 Dec 2009 07:14:38 -0700
Cite this page as followsStatistical Computations at FreeStatistics.org, Office for Research Development and Education, URL https://freestatistics.org/blog/index.php?v=date/2009/Dec/16/t12609729950uv9lhl5rvnij1i.htm/, Retrieved Tue, 30 Apr 2024 10:56:03 +0000
Statistical Computations at FreeStatistics.org, Office for Research Development and Education, URL https://freestatistics.org/blog/index.php?pk=68366, Retrieved Tue, 30 Apr 2024 10:56:03 +0000
QR Codes:

Original text written by user:
IsPrivate?No (this computation is public)
User-defined keywords
Estimated Impact108
Family? (F = Feedback message, R = changed R code, M = changed R Module, P = changed Parameters, D = changed Data)
-     [Univariate Data Series] [data set] [2008-12-01 19:54:57] [b98453cac15ba1066b407e146608df68]
- RMP   [Exponential Smoothing] [] [2009-11-27 15:04:36] [b98453cac15ba1066b407e146608df68]
- R  D      [Exponential Smoothing] [] [2009-12-16 14:14:38] [c88a5f1b97e332c6387d668c465455af] [Current]
Feedback Forum

Post a new message
Dataseries X:
19915
19843
19761
20858
21968
23061
22661
22269
21857
21568
21274
20987
19683
19381
19071
20772
22485
24181
23479
22782
22067
21489
20903
20330
19736
19483
19242
20334
21423
22523
21986
21462
20908
20575
20237
19904
19610
19251
18941
20450
21946
23409
22741
22069
21539
21189
20960
20704
19697
19598
19456
20316
21083
22158
21469
20892
20578
20233
19947
20049


Summary of computational transaction
Raw Inputview raw input (R code)
Raw Outputview raw output of R engine
Computing time1 seconds
R Server'Gwilym Jenkins' @ 72.249.127.135

\begin{tabular}{lllllllll}
\hline
Summary of computational transaction \tabularnewline
Raw Input & view raw input (R code)  \tabularnewline
Raw Output & view raw output of R engine  \tabularnewline
Computing time & 1 seconds \tabularnewline
R Server & 'Gwilym Jenkins' @ 72.249.127.135 \tabularnewline
\hline
\end{tabular}
%Source: https://freestatistics.org/blog/index.php?pk=68366&T=0

[TABLE]
[ROW][C]Summary of computational transaction[/C][/ROW]
[ROW][C]Raw Input[/C][C]view raw input (R code) [/C][/ROW]
[ROW][C]Raw Output[/C][C]view raw output of R engine [/C][/ROW]
[ROW][C]Computing time[/C][C]1 seconds[/C][/ROW]
[ROW][C]R Server[/C][C]'Gwilym Jenkins' @ 72.249.127.135[/C][/ROW]
[/TABLE]
Source: https://freestatistics.org/blog/index.php?pk=68366&T=0

Globally Unique Identifier (entire table): ba.freestatistics.org/blog/index.php?pk=68366&T=0

As an alternative you can also use a QR Code:  

The GUIDs for individual cells are displayed in the table below:

Summary of computational transaction
Raw Inputview raw input (R code)
Raw Outputview raw output of R engine
Computing time1 seconds
R Server'Gwilym Jenkins' @ 72.249.127.135


Estimated Parameters of Exponential Smoothing
ParameterValue
alpha0.598370702820769
beta0.0107745129481494
gamma1

\begin{tabular}{lllllllll}
\hline
Estimated Parameters of Exponential Smoothing \tabularnewline
Parameter & Value \tabularnewline
alpha & 0.598370702820769 \tabularnewline
beta & 0.0107745129481494 \tabularnewline
gamma & 1 \tabularnewline
\hline
\end{tabular}
%Source: https://freestatistics.org/blog/index.php?pk=68366&T=1

[TABLE]
[ROW][C]Estimated Parameters of Exponential Smoothing[/C][/ROW]
[ROW][C]Parameter[/C][C]Value[/C][/ROW]
[ROW][C]alpha[/C][C]0.598370702820769[/C][/ROW]
[ROW][C]beta[/C][C]0.0107745129481494[/C][/ROW]
[ROW][C]gamma[/C][C]1[/C][/ROW]
[/TABLE]
Source: https://freestatistics.org/blog/index.php?pk=68366&T=1

Globally Unique Identifier (entire table): ba.freestatistics.org/blog/index.php?pk=68366&T=1

As an alternative you can also use a QR Code:  

The GUIDs for individual cells are displayed in the table below:

Estimated Parameters of Exponential Smoothing
ParameterValue
alpha0.598370702820769
beta0.0107745129481494
gamma1


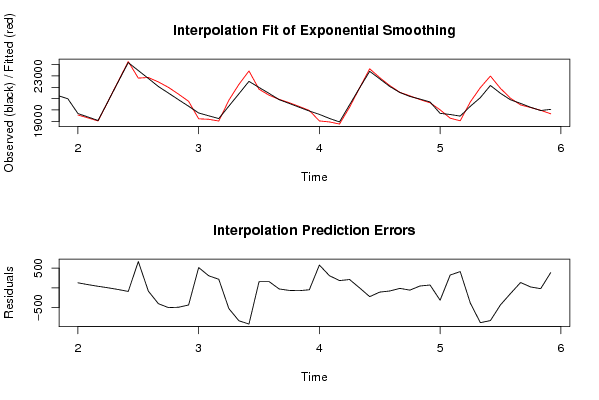
Interpolation Forecasts of Exponential Smoothing
tObservedFittedResiduals
131968319555.2445023852127.755497614751
141938119300.009799671880.9902003282441
151907119031.988064247939.0119357521253
162077220771.39656153160.603438468384411
172248522527.9424913596-42.942491359634
182418124273.0405170656-92.040517065554
192347922811.4104974059667.589502594074
202278222867.2479659161-85.2479659161218
212206722470.6351640011-403.635164001094
222148921991.6786582602-502.678658260164
232090321396.6514386398-493.651438639772
242033020766.0182017139-436.01820171385
251973619220.9352701911515.064729808906
261948319177.3644472700305.63555273004
271924219024.6391491622217.360850837838
282033420861.1049392308-527.104939230769
292142322260.2714793545-837.271479354516
302252323443.2061833741-920.206183374095
312198621830.7669769188155.233023081189
322146221303.4537869478158.546213052217
332090820936.7489180875-28.7489180874945
342057520641.1143367415-66.114336741528
352023720309.8613155447-72.8613155446583
361990419953.5953116783-49.5953116782694
371961019031.1261848107578.873815189312
381925118943.5175002801307.482499719870
391894118757.8803619225183.119638077493
402045020238.9907461483211.009253851709
412194621948.8905239335-2.89052393353268
422340923633.3330987482-224.333098748197
432274122850.0509888369-109.050988836931
442206922149.6809603769-80.6809603769252
452153921553.4840770882-14.4840770881929
462118921247.2876431217-58.2876431216646
472096020913.707999978846.2920000212107
482070420633.046880579470.9531194205738
491969720012.0874739407-315.087473940694
501959819273.8826648136324.117335186431
511945619043.5873658153412.412634184657
522031620700.0625314756-384.062531475611
532108321967.7457822828-884.745782282811
542215822990.6224750623-832.622475062348
552146921902.2384502922-433.238450292247
562089221036.8092259392-144.809225939214
572057820442.6467721509135.353227849053
582023320211.816500878621.1834991214419
591994719968.5491458151-21.5491458151373
602004919660.3160643856388.683935614412

\begin{tabular}{lllllllll}
\hline
Interpolation Forecasts of Exponential Smoothing \tabularnewline
t & Observed & Fitted & Residuals \tabularnewline
13 & 19683 & 19555.2445023852 & 127.755497614751 \tabularnewline
14 & 19381 & 19300.0097996718 & 80.9902003282441 \tabularnewline
15 & 19071 & 19031.9880642479 & 39.0119357521253 \tabularnewline
16 & 20772 & 20771.3965615316 & 0.603438468384411 \tabularnewline
17 & 22485 & 22527.9424913596 & -42.942491359634 \tabularnewline
18 & 24181 & 24273.0405170656 & -92.040517065554 \tabularnewline
19 & 23479 & 22811.4104974059 & 667.589502594074 \tabularnewline
20 & 22782 & 22867.2479659161 & -85.2479659161218 \tabularnewline
21 & 22067 & 22470.6351640011 & -403.635164001094 \tabularnewline
22 & 21489 & 21991.6786582602 & -502.678658260164 \tabularnewline
23 & 20903 & 21396.6514386398 & -493.651438639772 \tabularnewline
24 & 20330 & 20766.0182017139 & -436.01820171385 \tabularnewline
25 & 19736 & 19220.9352701911 & 515.064729808906 \tabularnewline
26 & 19483 & 19177.3644472700 & 305.63555273004 \tabularnewline
27 & 19242 & 19024.6391491622 & 217.360850837838 \tabularnewline
28 & 20334 & 20861.1049392308 & -527.104939230769 \tabularnewline
29 & 21423 & 22260.2714793545 & -837.271479354516 \tabularnewline
30 & 22523 & 23443.2061833741 & -920.206183374095 \tabularnewline
31 & 21986 & 21830.7669769188 & 155.233023081189 \tabularnewline
32 & 21462 & 21303.4537869478 & 158.546213052217 \tabularnewline
33 & 20908 & 20936.7489180875 & -28.7489180874945 \tabularnewline
34 & 20575 & 20641.1143367415 & -66.114336741528 \tabularnewline
35 & 20237 & 20309.8613155447 & -72.8613155446583 \tabularnewline
36 & 19904 & 19953.5953116783 & -49.5953116782694 \tabularnewline
37 & 19610 & 19031.1261848107 & 578.873815189312 \tabularnewline
38 & 19251 & 18943.5175002801 & 307.482499719870 \tabularnewline
39 & 18941 & 18757.8803619225 & 183.119638077493 \tabularnewline
40 & 20450 & 20238.9907461483 & 211.009253851709 \tabularnewline
41 & 21946 & 21948.8905239335 & -2.89052393353268 \tabularnewline
42 & 23409 & 23633.3330987482 & -224.333098748197 \tabularnewline
43 & 22741 & 22850.0509888369 & -109.050988836931 \tabularnewline
44 & 22069 & 22149.6809603769 & -80.6809603769252 \tabularnewline
45 & 21539 & 21553.4840770882 & -14.4840770881929 \tabularnewline
46 & 21189 & 21247.2876431217 & -58.2876431216646 \tabularnewline
47 & 20960 & 20913.7079999788 & 46.2920000212107 \tabularnewline
48 & 20704 & 20633.0468805794 & 70.9531194205738 \tabularnewline
49 & 19697 & 20012.0874739407 & -315.087473940694 \tabularnewline
50 & 19598 & 19273.8826648136 & 324.117335186431 \tabularnewline
51 & 19456 & 19043.5873658153 & 412.412634184657 \tabularnewline
52 & 20316 & 20700.0625314756 & -384.062531475611 \tabularnewline
53 & 21083 & 21967.7457822828 & -884.745782282811 \tabularnewline
54 & 22158 & 22990.6224750623 & -832.622475062348 \tabularnewline
55 & 21469 & 21902.2384502922 & -433.238450292247 \tabularnewline
56 & 20892 & 21036.8092259392 & -144.809225939214 \tabularnewline
57 & 20578 & 20442.6467721509 & 135.353227849053 \tabularnewline
58 & 20233 & 20211.8165008786 & 21.1834991214419 \tabularnewline
59 & 19947 & 19968.5491458151 & -21.5491458151373 \tabularnewline
60 & 20049 & 19660.3160643856 & 388.683935614412 \tabularnewline
\hline
\end{tabular}
%Source: https://freestatistics.org/blog/index.php?pk=68366&T=2

[TABLE]
[ROW][C]Interpolation Forecasts of Exponential Smoothing[/C][/ROW]
[ROW][C]t[/C][C]Observed[/C][C]Fitted[/C][C]Residuals[/C][/ROW]
[ROW][C]13[/C][C]19683[/C][C]19555.2445023852[/C][C]127.755497614751[/C][/ROW]
[ROW][C]14[/C][C]19381[/C][C]19300.0097996718[/C][C]80.9902003282441[/C][/ROW]
[ROW][C]15[/C][C]19071[/C][C]19031.9880642479[/C][C]39.0119357521253[/C][/ROW]
[ROW][C]16[/C][C]20772[/C][C]20771.3965615316[/C][C]0.603438468384411[/C][/ROW]
[ROW][C]17[/C][C]22485[/C][C]22527.9424913596[/C][C]-42.942491359634[/C][/ROW]
[ROW][C]18[/C][C]24181[/C][C]24273.0405170656[/C][C]-92.040517065554[/C][/ROW]
[ROW][C]19[/C][C]23479[/C][C]22811.4104974059[/C][C]667.589502594074[/C][/ROW]
[ROW][C]20[/C][C]22782[/C][C]22867.2479659161[/C][C]-85.2479659161218[/C][/ROW]
[ROW][C]21[/C][C]22067[/C][C]22470.6351640011[/C][C]-403.635164001094[/C][/ROW]
[ROW][C]22[/C][C]21489[/C][C]21991.6786582602[/C][C]-502.678658260164[/C][/ROW]
[ROW][C]23[/C][C]20903[/C][C]21396.6514386398[/C][C]-493.651438639772[/C][/ROW]
[ROW][C]24[/C][C]20330[/C][C]20766.0182017139[/C][C]-436.01820171385[/C][/ROW]
[ROW][C]25[/C][C]19736[/C][C]19220.9352701911[/C][C]515.064729808906[/C][/ROW]
[ROW][C]26[/C][C]19483[/C][C]19177.3644472700[/C][C]305.63555273004[/C][/ROW]
[ROW][C]27[/C][C]19242[/C][C]19024.6391491622[/C][C]217.360850837838[/C][/ROW]
[ROW][C]28[/C][C]20334[/C][C]20861.1049392308[/C][C]-527.104939230769[/C][/ROW]
[ROW][C]29[/C][C]21423[/C][C]22260.2714793545[/C][C]-837.271479354516[/C][/ROW]
[ROW][C]30[/C][C]22523[/C][C]23443.2061833741[/C][C]-920.206183374095[/C][/ROW]
[ROW][C]31[/C][C]21986[/C][C]21830.7669769188[/C][C]155.233023081189[/C][/ROW]
[ROW][C]32[/C][C]21462[/C][C]21303.4537869478[/C][C]158.546213052217[/C][/ROW]
[ROW][C]33[/C][C]20908[/C][C]20936.7489180875[/C][C]-28.7489180874945[/C][/ROW]
[ROW][C]34[/C][C]20575[/C][C]20641.1143367415[/C][C]-66.114336741528[/C][/ROW]
[ROW][C]35[/C][C]20237[/C][C]20309.8613155447[/C][C]-72.8613155446583[/C][/ROW]
[ROW][C]36[/C][C]19904[/C][C]19953.5953116783[/C][C]-49.5953116782694[/C][/ROW]
[ROW][C]37[/C][C]19610[/C][C]19031.1261848107[/C][C]578.873815189312[/C][/ROW]
[ROW][C]38[/C][C]19251[/C][C]18943.5175002801[/C][C]307.482499719870[/C][/ROW]
[ROW][C]39[/C][C]18941[/C][C]18757.8803619225[/C][C]183.119638077493[/C][/ROW]
[ROW][C]40[/C][C]20450[/C][C]20238.9907461483[/C][C]211.009253851709[/C][/ROW]
[ROW][C]41[/C][C]21946[/C][C]21948.8905239335[/C][C]-2.89052393353268[/C][/ROW]
[ROW][C]42[/C][C]23409[/C][C]23633.3330987482[/C][C]-224.333098748197[/C][/ROW]
[ROW][C]43[/C][C]22741[/C][C]22850.0509888369[/C][C]-109.050988836931[/C][/ROW]
[ROW][C]44[/C][C]22069[/C][C]22149.6809603769[/C][C]-80.6809603769252[/C][/ROW]
[ROW][C]45[/C][C]21539[/C][C]21553.4840770882[/C][C]-14.4840770881929[/C][/ROW]
[ROW][C]46[/C][C]21189[/C][C]21247.2876431217[/C][C]-58.2876431216646[/C][/ROW]
[ROW][C]47[/C][C]20960[/C][C]20913.7079999788[/C][C]46.2920000212107[/C][/ROW]
[ROW][C]48[/C][C]20704[/C][C]20633.0468805794[/C][C]70.9531194205738[/C][/ROW]
[ROW][C]49[/C][C]19697[/C][C]20012.0874739407[/C][C]-315.087473940694[/C][/ROW]
[ROW][C]50[/C][C]19598[/C][C]19273.8826648136[/C][C]324.117335186431[/C][/ROW]
[ROW][C]51[/C][C]19456[/C][C]19043.5873658153[/C][C]412.412634184657[/C][/ROW]
[ROW][C]52[/C][C]20316[/C][C]20700.0625314756[/C][C]-384.062531475611[/C][/ROW]
[ROW][C]53[/C][C]21083[/C][C]21967.7457822828[/C][C]-884.745782282811[/C][/ROW]
[ROW][C]54[/C][C]22158[/C][C]22990.6224750623[/C][C]-832.622475062348[/C][/ROW]
[ROW][C]55[/C][C]21469[/C][C]21902.2384502922[/C][C]-433.238450292247[/C][/ROW]
[ROW][C]56[/C][C]20892[/C][C]21036.8092259392[/C][C]-144.809225939214[/C][/ROW]
[ROW][C]57[/C][C]20578[/C][C]20442.6467721509[/C][C]135.353227849053[/C][/ROW]
[ROW][C]58[/C][C]20233[/C][C]20211.8165008786[/C][C]21.1834991214419[/C][/ROW]
[ROW][C]59[/C][C]19947[/C][C]19968.5491458151[/C][C]-21.5491458151373[/C][/ROW]
[ROW][C]60[/C][C]20049[/C][C]19660.3160643856[/C][C]388.683935614412[/C][/ROW]
[/TABLE]
Source: https://freestatistics.org/blog/index.php?pk=68366&T=2

Globally Unique Identifier (entire table): ba.freestatistics.org/blog/index.php?pk=68366&T=2

As an alternative you can also use a QR Code:  

The GUIDs for individual cells are displayed in the table below:

Interpolation Forecasts of Exponential Smoothing
tObservedFittedResiduals
131968319555.2445023852127.755497614751
141938119300.009799671880.9902003282441
151907119031.988064247939.0119357521253
162077220771.39656153160.603438468384411
172248522527.9424913596-42.942491359634
182418124273.0405170656-92.040517065554
192347922811.4104974059667.589502594074
202278222867.2479659161-85.2479659161218
212206722470.6351640011-403.635164001094
222148921991.6786582602-502.678658260164
232090321396.6514386398-493.651438639772
242033020766.0182017139-436.01820171385
251973619220.9352701911515.064729808906
261948319177.3644472700305.63555273004
271924219024.6391491622217.360850837838
282033420861.1049392308-527.104939230769
292142322260.2714793545-837.271479354516
302252323443.2061833741-920.206183374095
312198621830.7669769188155.233023081189
322146221303.4537869478158.546213052217
332090820936.7489180875-28.7489180874945
342057520641.1143367415-66.114336741528
352023720309.8613155447-72.8613155446583
361990419953.5953116783-49.5953116782694
371961019031.1261848107578.873815189312
381925118943.5175002801307.482499719870
391894118757.8803619225183.119638077493
402045020238.9907461483211.009253851709
412194621948.8905239335-2.89052393353268
422340923633.3330987482-224.333098748197
432274122850.0509888369-109.050988836931
442206922149.6809603769-80.6809603769252
452153921553.4840770882-14.4840770881929
462118921247.2876431217-58.2876431216646
472096020913.707999978846.2920000212107
482070420633.046880579470.9531194205738
491969720012.0874739407-315.087473940694
501959819273.8826648136324.117335186431
511945619043.5873658153412.412634184657
522031620700.0625314756-384.062531475611
532108321967.7457822828-884.745782282811
542215822990.6224750623-832.622475062348
552146921902.2384502922-433.238450292247
562089221036.8092259392-144.809225939214
572057820442.6467721509135.353227849053
582023320211.816500878621.1834991214419
591994719968.5491458151-21.5491458151373
602004919660.3160643856388.683935614412


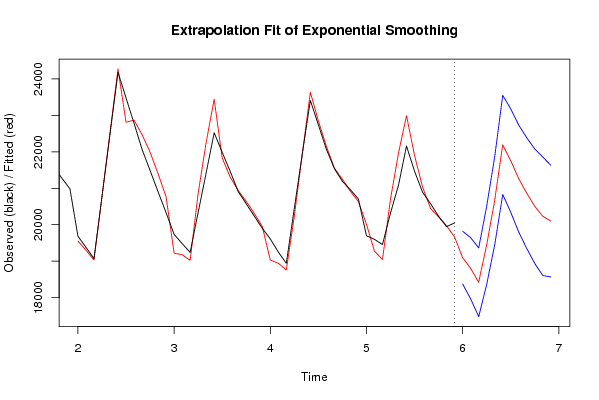
Extrapolation Forecasts of Exponential Smoothing
tForecast95% Lower Bound95% Upper Bound
6119096.53044993618373.695048850519819.3658510215
6218804.401249925817963.127562570519645.6749372812
6318420.748506361217478.766839824319362.730172898
6419439.366226976718366.96238602920511.7700679244
6520661.468760245819452.335821043621870.6016994479
6622190.802392964820831.018259656323550.5865262732
6721758.231128307520341.306943334323175.1553132807
6821263.638122278819796.553826306822730.7224182508
6920864.882066261619345.813146100722383.9509864226
7020504.765246709718934.487290808522075.0432026110
7120230.365852765118606.163830533721854.5678749965
7220098.585504490118566.555875981021630.6151329992

\begin{tabular}{lllllllll}
\hline
Extrapolation Forecasts of Exponential Smoothing \tabularnewline
t & Forecast & 95% Lower Bound & 95% Upper Bound \tabularnewline
61 & 19096.530449936 & 18373.6950488505 & 19819.3658510215 \tabularnewline
62 & 18804.4012499258 & 17963.1275625705 & 19645.6749372812 \tabularnewline
63 & 18420.7485063612 & 17478.7668398243 & 19362.730172898 \tabularnewline
64 & 19439.3662269767 & 18366.962386029 & 20511.7700679244 \tabularnewline
65 & 20661.4687602458 & 19452.3358210436 & 21870.6016994479 \tabularnewline
66 & 22190.8023929648 & 20831.0182596563 & 23550.5865262732 \tabularnewline
67 & 21758.2311283075 & 20341.3069433343 & 23175.1553132807 \tabularnewline
68 & 21263.6381222788 & 19796.5538263068 & 22730.7224182508 \tabularnewline
69 & 20864.8820662616 & 19345.8131461007 & 22383.9509864226 \tabularnewline
70 & 20504.7652467097 & 18934.4872908085 & 22075.0432026110 \tabularnewline
71 & 20230.3658527651 & 18606.1638305337 & 21854.5678749965 \tabularnewline
72 & 20098.5855044901 & 18566.5558759810 & 21630.6151329992 \tabularnewline
\hline
\end{tabular}
%Source: https://freestatistics.org/blog/index.php?pk=68366&T=3

[TABLE]
[ROW][C]Extrapolation Forecasts of Exponential Smoothing[/C][/ROW]
[ROW][C]t[/C][C]Forecast[/C][C]95% Lower Bound[/C][C]95% Upper Bound[/C][/ROW]
[ROW][C]61[/C][C]19096.530449936[/C][C]18373.6950488505[/C][C]19819.3658510215[/C][/ROW]
[ROW][C]62[/C][C]18804.4012499258[/C][C]17963.1275625705[/C][C]19645.6749372812[/C][/ROW]
[ROW][C]63[/C][C]18420.7485063612[/C][C]17478.7668398243[/C][C]19362.730172898[/C][/ROW]
[ROW][C]64[/C][C]19439.3662269767[/C][C]18366.962386029[/C][C]20511.7700679244[/C][/ROW]
[ROW][C]65[/C][C]20661.4687602458[/C][C]19452.3358210436[/C][C]21870.6016994479[/C][/ROW]
[ROW][C]66[/C][C]22190.8023929648[/C][C]20831.0182596563[/C][C]23550.5865262732[/C][/ROW]
[ROW][C]67[/C][C]21758.2311283075[/C][C]20341.3069433343[/C][C]23175.1553132807[/C][/ROW]
[ROW][C]68[/C][C]21263.6381222788[/C][C]19796.5538263068[/C][C]22730.7224182508[/C][/ROW]
[ROW][C]69[/C][C]20864.8820662616[/C][C]19345.8131461007[/C][C]22383.9509864226[/C][/ROW]
[ROW][C]70[/C][C]20504.7652467097[/C][C]18934.4872908085[/C][C]22075.0432026110[/C][/ROW]
[ROW][C]71[/C][C]20230.3658527651[/C][C]18606.1638305337[/C][C]21854.5678749965[/C][/ROW]
[ROW][C]72[/C][C]20098.5855044901[/C][C]18566.5558759810[/C][C]21630.6151329992[/C][/ROW]
[/TABLE]
Source: https://freestatistics.org/blog/index.php?pk=68366&T=3

Globally Unique Identifier (entire table): ba.freestatistics.org/blog/index.php?pk=68366&T=3

As an alternative you can also use a QR Code:  

The GUIDs for individual cells are displayed in the table below:

Extrapolation Forecasts of Exponential Smoothing
tForecast95% Lower Bound95% Upper Bound
6119096.53044993618373.695048850519819.3658510215
6218804.401249925817963.127562570519645.6749372812
6318420.748506361217478.766839824319362.730172898
6419439.366226976718366.96238602920511.7700679244
6520661.468760245819452.335821043621870.6016994479
6622190.802392964820831.018259656323550.5865262732
6721758.231128307520341.306943334323175.1553132807
6821263.638122278819796.553826306822730.7224182508
6920864.882066261619345.813146100722383.9509864226
7020504.765246709718934.487290808522075.0432026110
7120230.365852765118606.163830533721854.5678749965
7220098.585504490118566.555875981021630.6151329992


Parameters (Session):
par1 = 12 ; par2 = Triple ; par3 = multiplicative ;
Parameters (R input):
par1 = 12 ; par2 = Triple ; par3 = multiplicative ;
R code (references can be found in the software module):
par1 <- as.numeric(par1)
if (par2 == 'Single') K <- 1
if (par2 == 'Double') K <- 2
if (par2 == 'Triple') K <- par1
nx <- length(x)
nxmK <- nx - K
x <- ts(x, frequency = par1)
if (par2 == 'Single') fit <- HoltWinters(x, gamma=0, beta=0)
if (par2 == 'Double') fit <- HoltWinters(x, gamma=0)
if (par2 == 'Triple') fit <- HoltWinters(x, seasonal=par3)
fit
myresid <- x - fit$fitted[,'xhat']
bitmap(file='test1.png')
op <- par(mfrow=c(2,1))
plot(fit,ylab='Observed (black) / Fitted (red)',main='Interpolation Fit of Exponential Smoothing')
plot(myresid,ylab='Residuals',main='Interpolation Prediction Errors')
par(op)
dev.off()
bitmap(file='test2.png')
p <- predict(fit, par1, prediction.interval=TRUE)
np <- length(p[,1])
plot(fit,p,ylab='Observed (black) / Fitted (red)',main='Extrapolation Fit of Exponential Smoothing')
dev.off()
bitmap(file='test3.png')
op <- par(mfrow = c(2,2))
acf(as.numeric(myresid),lag.max = nx/2,main='Residual ACF')
spectrum(myresid,main='Residals Periodogram')
cpgram(myresid,main='Residal Cumulative Periodogram')
qqnorm(myresid,main='Residual Normal QQ Plot')
qqline(myresid)
par(op)
dev.off()
load(file='createtable')
a<-table.start()
a<-table.row.start(a)
a<-table.element(a,'Estimated Parameters of Exponential Smoothing',2,TRUE)
a<-table.row.end(a)
a<-table.row.start(a)
a<-table.element(a,'Parameter',header=TRUE)
a<-table.element(a,'Value',header=TRUE)
a<-table.row.end(a)
a<-table.row.start(a)
a<-table.element(a,'alpha',header=TRUE)
a<-table.element(a,fit$alpha)
a<-table.row.end(a)
a<-table.row.start(a)
a<-table.element(a,'beta',header=TRUE)
a<-table.element(a,fit$beta)
a<-table.row.end(a)
a<-table.row.start(a)
a<-table.element(a,'gamma',header=TRUE)
a<-table.element(a,fit$gamma)
a<-table.row.end(a)
a<-table.end(a)
table.save(a,file='mytable.tab')
a<-table.start()
a<-table.row.start(a)
a<-table.element(a,'Interpolation Forecasts of Exponential Smoothing',4,TRUE)
a<-table.row.end(a)
a<-table.row.start(a)
a<-table.element(a,'t',header=TRUE)
a<-table.element(a,'Observed',header=TRUE)
a<-table.element(a,'Fitted',header=TRUE)
a<-table.element(a,'Residuals',header=TRUE)
a<-table.row.end(a)
for (i in 1:nxmK) {
a<-table.row.start(a)
a<-table.element(a,i+K,header=TRUE)
a<-table.element(a,x[i+K])
a<-table.element(a,fit$fitted[i,'xhat'])
a<-table.element(a,myresid[i])
a<-table.row.end(a)
}
a<-table.end(a)
table.save(a,file='mytable1.tab')
a<-table.start()
a<-table.row.start(a)
a<-table.element(a,'Extrapolation Forecasts of Exponential Smoothing',4,TRUE)
a<-table.row.end(a)
a<-table.row.start(a)
a<-table.element(a,'t',header=TRUE)
a<-table.element(a,'Forecast',header=TRUE)
a<-table.element(a,'95% Lower Bound',header=TRUE)
a<-table.element(a,'95% Upper Bound',header=TRUE)
a<-table.row.end(a)
for (i in 1:np) {
a<-table.row.start(a)
a<-table.element(a,nx+i,header=TRUE)
a<-table.element(a,p[i,'fit'])
a<-table.element(a,p[i,'lwr'])
a<-table.element(a,p[i,'upr'])
a<-table.row.end(a)
}
a<-table.end(a)
table.save(a,file='mytable2.tab')