| Multiple Linear Regression - Estimated Regression Equation |
| Y[t] = + 4707.37233564554 -889.595599244605X[t] + 0.153530771296594Y1[t] + 0.436558232697684Y2[t] + 0.0508654692781182Y3[t] -6720.22713821588M1[t] + 14266.9491999809M2[t] + 11667.1125103659M3[t] + 7644.99499046983M4[t] + 4714.7777808122M5[t] + 460.306602584105M6[t] + 3169.10551863843M7[t] -1444.75317412772M8[t] -2090.70678676465M9[t] + 2356.44218947412M10[t] + 5209.20853962815M11[t] + 14.0026261095115t + e[t] |
| Multiple Linear Regression - Ordinary Least Squares | |||||
| Variable | Parameter | S.D. | T-STAT H0: parameter = 0 | 2-tail p-value | 1-tail p-value |
| (Intercept) | 4707.37233564554 | 3579.149132 | 1.3152 | 0.195926 | 0.097963 |
| X | -889.595599244605 | 889.524958 | -1.0001 | 0.323284 | 0.161642 |
| Y1 | 0.153530771296594 | 0.15948 | 0.9627 | 0.341483 | 0.170742 |
| Y2 | 0.436558232697684 | 0.143608 | 3.0399 | 0.00416 | 0.00208 |
| Y3 | 0.0508654692781182 | 0.15997 | 0.318 | 0.752162 | 0.376081 |
| M1 | -6720.22713821588 | 1491.209035 | -4.5066 | 5.6e-05 | 2.8e-05 |
| M2 | 14266.9491999809 | 2354.156582 | 6.0603 | 0 | 0 |
| M3 | 11667.1125103659 | 2236.842751 | 5.2159 | 6e-06 | 3e-06 |
| M4 | 7644.99499046983 | 2523.660912 | 3.0293 | 0.00428 | 0.00214 |
| M5 | 4714.7777808122 | 2035.268652 | 2.3165 | 0.025735 | 0.012867 |
| M6 | 460.306602584105 | 1983.605589 | 0.2321 | 0.817678 | 0.408839 |
| M7 | 3169.10551863843 | 2204.852622 | 1.4373 | 0.158401 | 0.0792 |
| M8 | -1444.75317412772 | 1755.2875 | -0.8231 | 0.415339 | 0.20767 |
| M9 | -2090.70678676465 | 1833.958534 | -1.14 | 0.261068 | 0.130534 |
| M10 | 2356.44218947412 | 2051.721378 | 1.1485 | 0.257576 | 0.128788 |
| M11 | 5209.20853962815 | 1359.892516 | 3.8306 | 0.000441 | 0.000221 |
| t | 14.0026261095115 | 24.084759 | 0.5814 | 0.56424 | 0.28212 |
| Multiple Linear Regression - Regression Statistics | |
| Multiple R | 0.966482294440936 |
| R-squared | 0.934088025467816 |
| Adjusted R-squared | 0.907723235654942 |
| F-TEST (value) | 35.4293750148430 |
| F-TEST (DF numerator) | 16 |
| F-TEST (DF denominator) | 40 |
| p-value | 0 |
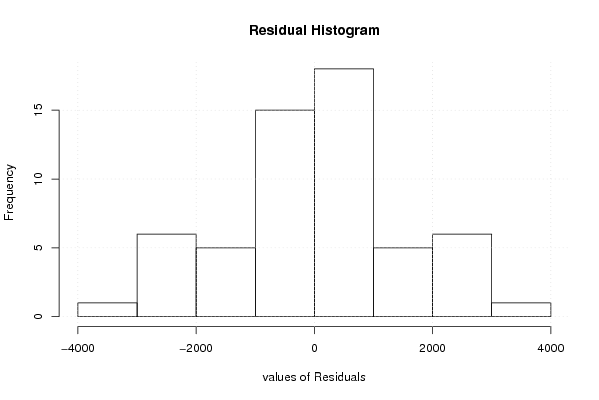
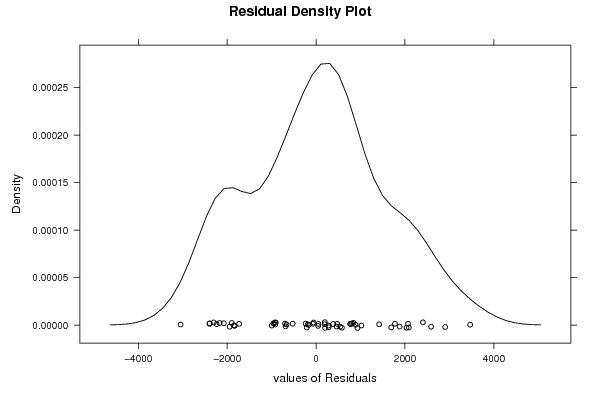
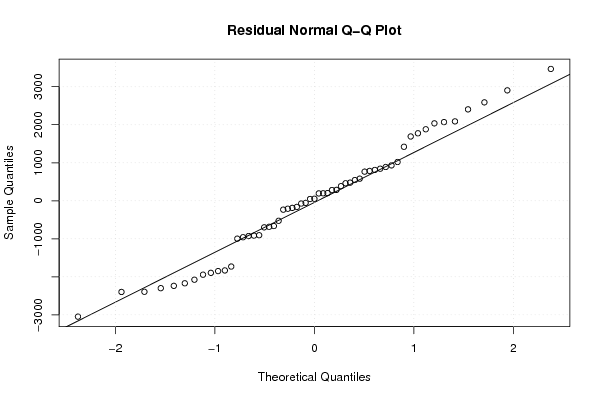
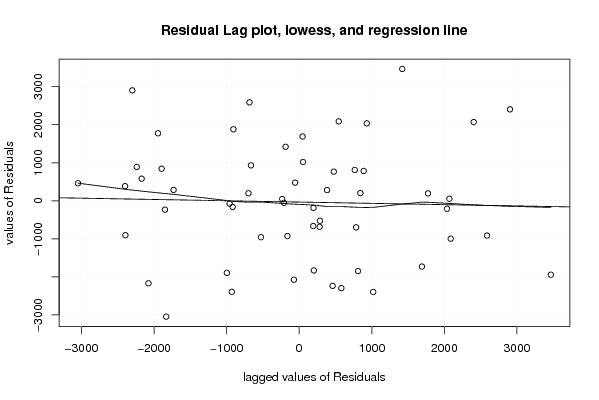
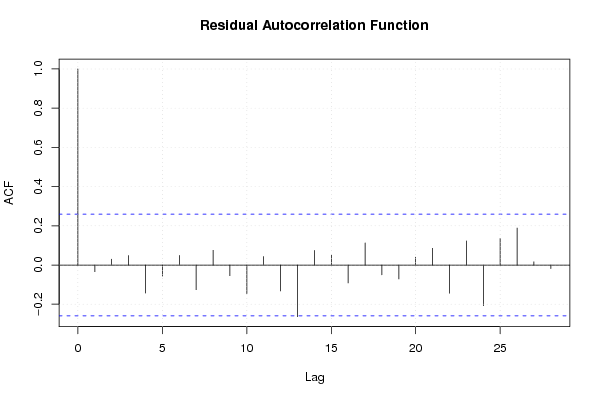
| Multiple Linear Regression - Residual Statistics | |
| Residual Standard Deviation | 1786.11048781796 |
| Sum Squared Residuals | 127607626.987733 |
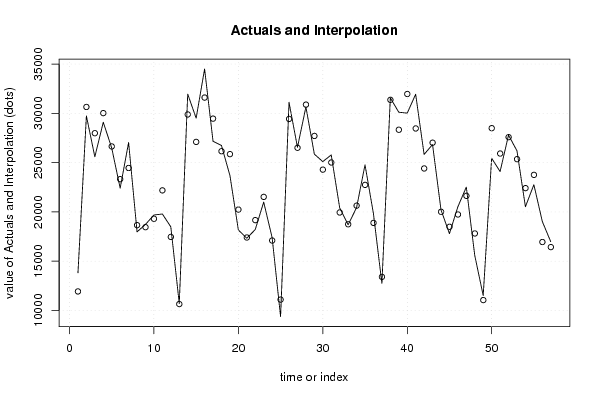
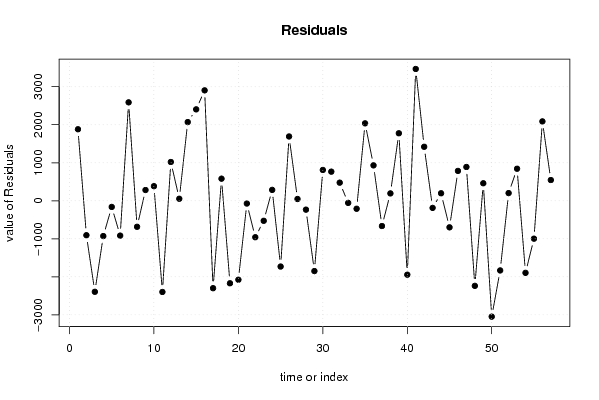
| Multiple Linear Regression - Actuals, Interpolation, and Residuals | |||
| Time or Index | Actuals | Interpolation Forecast | Residuals Prediction Error |
| 1 | 13807 | 11925.7749831604 | 1881.22501683961 |
| 2 | 29743 | 30649.3280308136 | -906.328030813608 |
| 3 | 25591 | 27985.5581544637 | -2394.55815446371 |
| 4 | 29096 | 30024.2348482547 | -928.23484825475 |
| 5 | 26482 | 26644.1479543565 | -162.147954356516 |
| 6 | 22405 | 23321.2931432313 | -916.293143231263 |
| 7 | 27044 | 24455.2699803669 | 2588.73001963306 |
| 8 | 17970 | 18654.8329103538 | -684.832910353758 |
| 9 | 18730 | 18447.5588283187 | 282.441171681305 |
| 10 | 19684 | 19300.0293253348 | 383.970674665202 |
| 11 | 19785 | 22183.4976460359 | -2398.49764603589 |
| 12 | 18479 | 17458.9326510632 | 1020.06734893684 |
| 13 | 10698 | 10644.8149908372 | 53.1850091627691 |
| 14 | 31956 | 29886.3633841787 | 2069.63661582131 |
| 15 | 29506 | 27100.9965453982 | 2405.00345460179 |
| 16 | 34506 | 31601.3019561694 | 2904.69804383064 |
| 17 | 27165 | 29464.4717049091 | -2299.47170490913 |
| 18 | 26736 | 26155.1045244593 | 580.895475540727 |
| 19 | 23691 | 25861.5947258938 | -2170.59472589377 |
| 20 | 18157 | 20233.5505688410 | -2076.55056884103 |
| 21 | 17328 | 17400.8191890735 | -72.8191890734954 |
| 22 | 18205 | 19163.8951683160 | -958.895168316047 |
| 23 | 20995 | 21521.9143491152 | -526.91434911522 |
| 24 | 17382 | 17095.7533835584 | 286.246616441618 |
| 25 | 9367 | 11097.4286805409 | -1730.42868054086 |
| 26 | 31124 | 29432.6882774542 | 1691.31172254578 |
| 27 | 26551 | 26504.4320294749 | 46.5679705251251 |
| 28 | 30651 | 30884.7316510884 | -233.731651088411 |
| 29 | 25859 | 27708.2924468138 | -1849.29244681385 |
| 30 | 25100 | 24289.3854016936 | 810.61459830635 |
| 31 | 25778 | 25012.2184613964 | 765.78153860364 |
| 32 | 20418 | 19941.3612302805 | 476.638769719473 |
| 33 | 18688 | 18743.8649001903 | -55.8649001902982 |
| 34 | 20424 | 20633.9429291065 | -209.94292910645 |
| 35 | 24776 | 22739.3566664432 | 2036.64333355682 |
| 36 | 19814 | 18882.1844997193 | 931.815500280656 |
| 37 | 12738 | 13402.3441838064 | -664.344183806407 |
| 38 | 31566 | 31372.3039820705 | 193.696017929485 |
| 39 | 30111 | 28335.6667674104 | 1775.33323258962 |
| 40 | 30019 | 31963.7589460073 | -1944.75894600734 |
| 41 | 31934 | 28466.3267592486 | 3467.67324075139 |
| 42 | 25826 | 24405.6970189552 | 1420.30298104484 |
| 43 | 26835 | 27022.0620024819 | -187.062002481873 |
| 44 | 20205 | 20008.0281724136 | 196.971827586355 |
| 45 | 17789 | 18487.9691426310 | -698.969142631017 |
| 46 | 20520 | 19735.1325772427 | 784.867422757295 |
| 47 | 22518 | 21629.2313384057 | 888.768661594281 |
| 48 | 15572 | 17810.1294656591 | -2238.12946565911 |
| 49 | 11509 | 11048.6371616551 | 460.362838344891 |
| 50 | 25447 | 28495.3163254830 | -3048.31632548296 |
| 51 | 24090 | 25922.3465032528 | -1832.34650325282 |
| 52 | 27786 | 27583.9725984801 | 202.027401519862 |
| 53 | 26195 | 25351.7611346719 | 843.238865328108 |
| 54 | 20516 | 22411.5199116607 | -1895.51991166066 |
| 55 | 22759 | 23755.8548298611 | -996.85482986105 |
| 56 | 19028 | 16940.2271181110 | 2087.77288188896 |
| 57 | 16971 | 16425.7879397865 | 545.212060213505 |
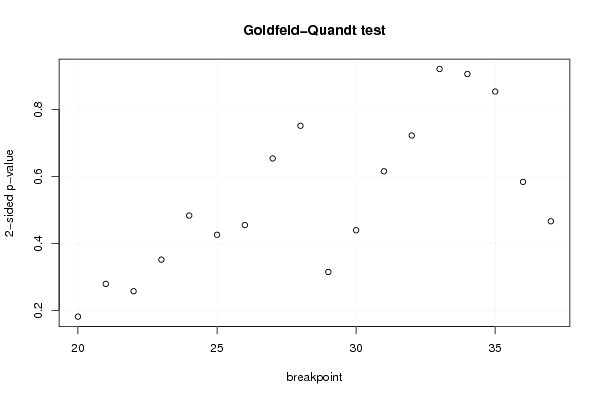
| Goldfeld-Quandt test for Heteroskedasticity | |||
| p-values | Alternative Hypothesis | ||
| breakpoint index | greater | 2-sided | less |
| 20 | 0.909121855315953 | 0.181756289368093 | 0.0908781446840466 |
| 21 | 0.860275762944488 | 0.279448474111024 | 0.139724237055512 |
| 22 | 0.87122683975094 | 0.25754632049812 | 0.12877316024906 |
| 23 | 0.824165683322474 | 0.351668633355053 | 0.175834316677526 |
| 24 | 0.758401090187357 | 0.483197819625285 | 0.241598909812643 |
| 25 | 0.787089033908096 | 0.425821932183808 | 0.212910966091904 |
| 26 | 0.772563768371864 | 0.454872463256272 | 0.227436231628136 |
| 27 | 0.673245012282214 | 0.653509975435571 | 0.326754987717786 |
| 28 | 0.624544464574429 | 0.750911070851142 | 0.375455535425571 |
| 29 | 0.842517244145238 | 0.314965511709525 | 0.157482755854762 |
| 30 | 0.780293636601265 | 0.43941272679747 | 0.219706363398735 |
| 31 | 0.69240743453583 | 0.61518513092834 | 0.30759256546417 |
| 32 | 0.639034900735557 | 0.721930198528885 | 0.360965099264443 |
| 33 | 0.539816943555905 | 0.92036611288819 | 0.460183056444095 |
| 34 | 0.45264395528209 | 0.90528791056418 | 0.54735604471791 |
| 35 | 0.426483185229102 | 0.852966370458204 | 0.573516814770898 |
| 36 | 0.291847511579805 | 0.58369502315961 | 0.708152488420195 |
| 37 | 0.233085331138173 | 0.466170662276346 | 0.766914668861827 |
| Meta Analysis of Goldfeld-Quandt test for Heteroskedasticity | |||
| Description | # significant tests | % significant tests | OK/NOK |
| 1% type I error level | 0 | 0 | OK |
| 5% type I error level | 0 | 0 | OK |
| 10% type I error level | 0 | 0 | OK |