| Multiple Linear Regression - Estimated Regression Equation |
| Y[t] = + 18301.5517241379 -1000.87931034482X[t] + 1738.42413793102M1[t] + 4069.82413793103M2[t] -18.1758620689729M3[t] -6477.57586206898M4[t] + 11865.8241379310M5[t] + 9068.42413793104M6[t] + 12310.2241379310M7[t] + 9625.8M8[t] + 6215.4M9[t] + 7320.2M10[t] + 1254.40000000000M11[t] + e[t] |
| Multiple Linear Regression - Ordinary Least Squares | |||||
| Variable | Parameter | S.D. | T-STAT H0: parameter = 0 | 2-tail p-value | 1-tail p-value |
| (Intercept) | 18301.5517241379 | 915.181699 | 19.9977 | 0 | 0 |
| X | -1000.87931034482 | 581.14096 | -1.7223 | 0.091597 | 0.045798 |
| M1 | 1738.42413793102 | 1257.200118 | 1.3828 | 0.173269 | 0.086634 |
| M2 | 4069.82413793103 | 1257.200118 | 3.2372 | 0.002216 | 0.001108 |
| M3 | -18.1758620689729 | 1257.200118 | -0.0145 | 0.988526 | 0.494263 |
| M4 | -6477.57586206898 | 1257.200118 | -5.1524 | 5e-06 | 3e-06 |
| M5 | 11865.8241379310 | 1257.200118 | 9.4383 | 0 | 0 |
| M6 | 9068.42413793104 | 1257.200118 | 7.2132 | 0 | 0 |
| M7 | 12310.2241379310 | 1257.200118 | 9.7918 | 0 | 0 |
| M8 | 9625.8 | 1251.815939 | 7.6895 | 0 | 0 |
| M9 | 6215.4 | 1251.815939 | 4.9651 | 9e-06 | 5e-06 |
| M10 | 7320.2 | 1251.815939 | 5.8477 | 0 | 0 |
| M11 | 1254.40000000000 | 1251.815939 | 1.0021 | 0.321444 | 0.160722 |
| Multiple Linear Regression - Regression Statistics | |
| Multiple R | 0.951753185657985 |
| R-squared | 0.905834126410122 |
| Adjusted R-squared | 0.881791775706323 |
| F-TEST (value) | 37.6766039881035 |
| F-TEST (DF numerator) | 12 |
| F-TEST (DF denominator) | 47 |
| p-value | 0 |
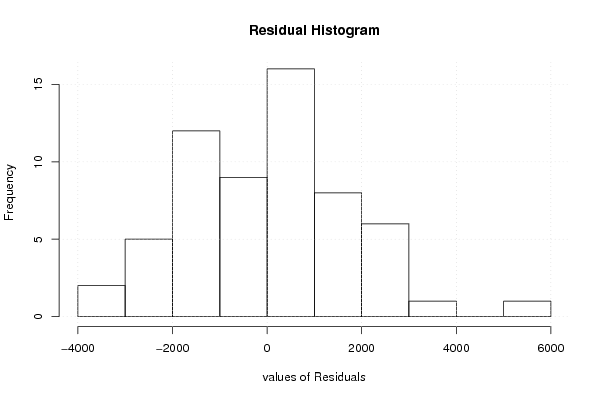
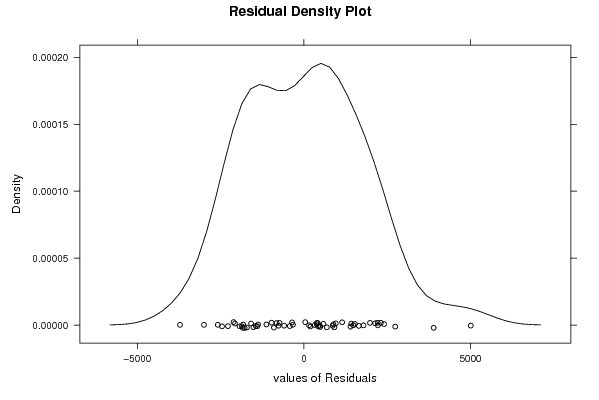
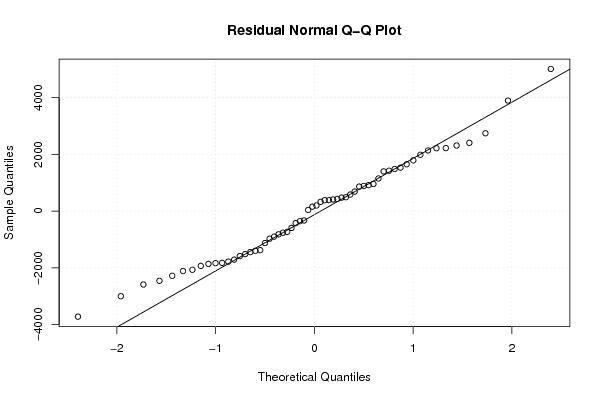
| Multiple Linear Regression - Residual Statistics | |
| Residual Standard Deviation | 1979.29478861406 |
| Sum Squared Residuals | 184127569.431034 |
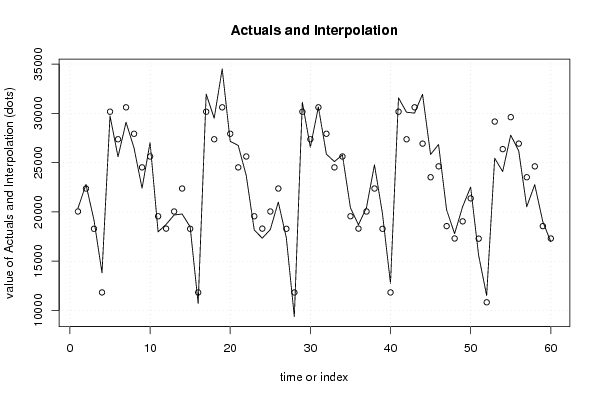
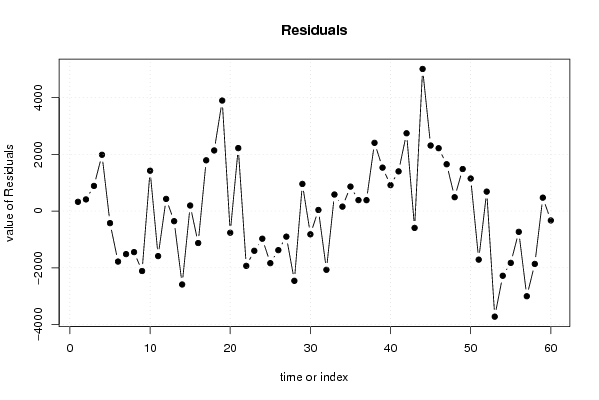
| Multiple Linear Regression - Actuals, Interpolation, and Residuals | |||
| Time or Index | Actuals | Interpolation Forecast | Residuals Prediction Error |
| 1 | 20366 | 20039.975862069 | 326.024137930996 |
| 2 | 22782 | 22371.3758620690 | 410.62413793103 |
| 3 | 19169 | 18283.3758620690 | 885.624137931035 |
| 4 | 13807 | 11823.9758620690 | 1983.02413793103 |
| 5 | 29743 | 30167.3758620690 | -424.375862068960 |
| 6 | 25591 | 27369.9758620689 | -1778.97586206895 |
| 7 | 29096 | 30611.775862069 | -1515.77586206897 |
| 8 | 26482 | 27927.3517241379 | -1445.35172413794 |
| 9 | 22405 | 24516.9517241379 | -2111.95172413793 |
| 10 | 27044 | 25621.7517241379 | 1422.24827586208 |
| 11 | 17970 | 19555.9517241379 | -1585.95172413793 |
| 12 | 18730 | 18301.5517241379 | 428.448275862066 |
| 13 | 19684 | 20039.9758620690 | -355.975862068954 |
| 14 | 19785 | 22371.3758620690 | -2586.37586206897 |
| 15 | 18479 | 18283.3758620690 | 195.624137931036 |
| 16 | 10698 | 11823.9758620690 | -1125.97586206896 |
| 17 | 31956 | 30167.3758620690 | 1788.62413793103 |
| 18 | 29506 | 27369.9758620690 | 2136.02413793103 |
| 19 | 34506 | 30611.7758620690 | 3894.22413793104 |
| 20 | 27165 | 27927.3517241379 | -762.351724137928 |
| 21 | 26736 | 24516.9517241379 | 2219.04827586207 |
| 22 | 23691 | 25621.7517241379 | -1930.75172413793 |
| 23 | 18157 | 19555.9517241379 | -1398.95172413793 |
| 24 | 17328 | 18301.5517241379 | -973.551724137935 |
| 25 | 18205 | 20039.9758620690 | -1834.97586206895 |
| 26 | 20995 | 22371.3758620690 | -1376.37586206896 |
| 27 | 17382 | 18283.3758620690 | -901.375862068965 |
| 28 | 9367 | 11823.9758620690 | -2456.97586206896 |
| 29 | 31124 | 30167.3758620690 | 956.624137931035 |
| 30 | 26551 | 27369.975862069 | -818.97586206897 |
| 31 | 30651 | 30611.7758620690 | 39.2241379310378 |
| 32 | 25859 | 27927.3517241379 | -2068.35172413793 |
| 33 | 25100 | 24516.9517241379 | 583.048275862069 |
| 34 | 25778 | 25621.7517241379 | 156.248275862067 |
| 35 | 20418 | 19555.9517241379 | 862.048275862068 |
| 36 | 18688 | 18301.5517241379 | 386.448275862067 |
| 37 | 20424 | 20039.9758620690 | 384.024137931045 |
| 38 | 24776 | 22371.3758620690 | 2404.62413793104 |
| 39 | 19814 | 18283.3758620690 | 1530.62413793103 |
| 40 | 12738 | 11823.9758620690 | 914.024137931036 |
| 41 | 31566 | 30167.3758620690 | 1398.62413793103 |
| 42 | 30111 | 27369.9758620690 | 2741.02413793103 |
| 43 | 30019 | 30611.7758620690 | -592.775862068962 |
| 44 | 31934 | 26926.4724137931 | 5007.5275862069 |
| 45 | 25826 | 23516.0724137931 | 2309.9275862069 |
| 46 | 26835 | 24620.8724137931 | 2214.12758620690 |
| 47 | 20205 | 18555.0724137931 | 1649.92758620690 |
| 48 | 17789 | 17300.6724137931 | 488.327586206894 |
| 49 | 20520 | 19039.0965517241 | 1480.90344827587 |
| 50 | 22518 | 21370.4965517241 | 1147.50344827586 |
| 51 | 15572 | 17282.4965517241 | -1710.49655172414 |
| 52 | 11509 | 10823.0965517241 | 685.903448275864 |
| 53 | 25447 | 29166.4965517241 | -3719.49655172414 |
| 54 | 24090 | 26369.0965517241 | -2279.09655172415 |
| 55 | 27786 | 29610.8965517241 | -1824.89655172414 |
| 56 | 26195 | 26926.4724137931 | -731.472413793099 |
| 57 | 20516 | 23516.0724137931 | -3000.0724137931 |
| 58 | 22759 | 24620.8724137931 | -1861.87241379311 |
| 59 | 19028 | 18555.0724137931 | 472.927586206896 |
| 60 | 16971 | 17300.6724137931 | -329.672413793106 |
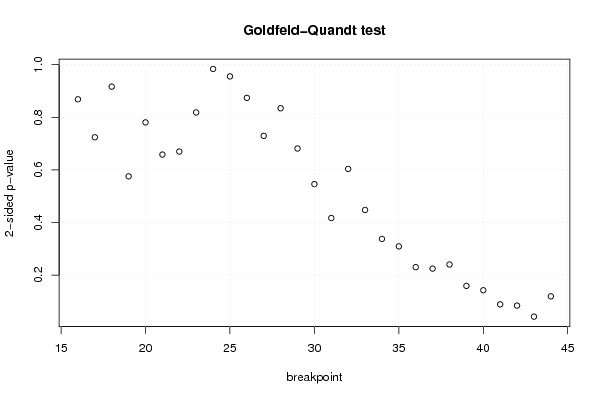
| Goldfeld-Quandt test for Heteroskedasticity | |||
| p-values | Alternative Hypothesis | ||
| breakpoint index | greater | 2-sided | less |
| 16 | 0.434215370757491 | 0.868430741514982 | 0.565784629242509 |
| 17 | 0.362034345264923 | 0.724068690529846 | 0.637965654735077 |
| 18 | 0.458274952599164 | 0.916549905198329 | 0.541725047400836 |
| 19 | 0.712277836676402 | 0.575444326647196 | 0.287722163323598 |
| 20 | 0.609684659507402 | 0.780630680985196 | 0.390315340492598 |
| 21 | 0.670905512708472 | 0.658188974583056 | 0.329094487291528 |
| 22 | 0.665179459141195 | 0.66964108171761 | 0.334820540858805 |
| 23 | 0.590793257565373 | 0.818413484869254 | 0.409206742434627 |
| 24 | 0.50808385304524 | 0.98383229390952 | 0.49191614695476 |
| 25 | 0.477764504304505 | 0.95552900860901 | 0.522235495695495 |
| 26 | 0.436928345613133 | 0.873856691226266 | 0.563071654386867 |
| 27 | 0.364694441475242 | 0.729388882950484 | 0.635305558524758 |
| 28 | 0.41718955925058 | 0.83437911850116 | 0.58281044074942 |
| 29 | 0.340625771831903 | 0.681251543663807 | 0.659374228168097 |
| 30 | 0.272985990792843 | 0.545971981585687 | 0.727014009207157 |
| 31 | 0.208470900156062 | 0.416941800312124 | 0.791529099843938 |
| 32 | 0.301824357395061 | 0.603648714790122 | 0.698175642604939 |
| 33 | 0.223820835724783 | 0.447641671449567 | 0.776179164275217 |
| 34 | 0.168717293983573 | 0.337434587967146 | 0.831282706016427 |
| 35 | 0.154639180334303 | 0.309278360668607 | 0.845360819665697 |
| 36 | 0.115015673653942 | 0.230031347307884 | 0.884984326346058 |
| 37 | 0.112296293117408 | 0.224592586234816 | 0.887703706882592 |
| 38 | 0.120153589461557 | 0.240307178923115 | 0.879846410538443 |
| 39 | 0.0794411825492406 | 0.158882365098481 | 0.92055881745076 |
| 40 | 0.0711410393520518 | 0.142282078704104 | 0.928858960647948 |
| 41 | 0.0442713876417616 | 0.0885427752835232 | 0.955728612358238 |
| 42 | 0.0419602789408137 | 0.0839205578816274 | 0.958039721059186 |
| 43 | 0.0209482967890896 | 0.0418965935781792 | 0.97905170321091 |
| 44 | 0.0595778488822126 | 0.119155697764425 | 0.940422151117787 |
| Meta Analysis of Goldfeld-Quandt test for Heteroskedasticity | |||
| Description | # significant tests | % significant tests | OK/NOK |
| 1% type I error level | 0 | 0 | OK |
| 5% type I error level | 1 | 0.0344827586206897 | OK |
| 10% type I error level | 3 | 0.103448275862069 | NOK |