| Multiple Linear Regression - Estimated Regression Equation |
| Y[t] = + 23033.5348837209 -945.299589603282X[t] + e[t] |
| Multiple Linear Regression - Ordinary Least Squares | |||||
| Variable | Parameter | S.D. | T-STAT H0: parameter = 0 | 2-tail p-value | 1-tail p-value |
| (Intercept) | 23033.5348837209 | 882.982336 | 26.0861 | 0 | 0 |
| X | -945.299589603282 | 1658.834962 | -0.5699 | 0.570975 | 0.285488 |
| Multiple Linear Regression - Regression Statistics | |
| Multiple R | 0.0746173622243007 |
| R-squared | 0.00556775074531249 |
| Adjusted R-squared | -0.011577632862527 |
| F-TEST (value) | 0.324737601249512 |
| F-TEST (DF numerator) | 1 |
| F-TEST (DF denominator) | 58 |
| p-value | 0.570975115043695 |
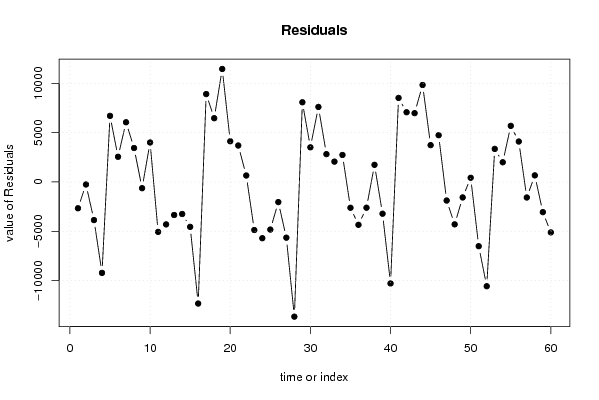
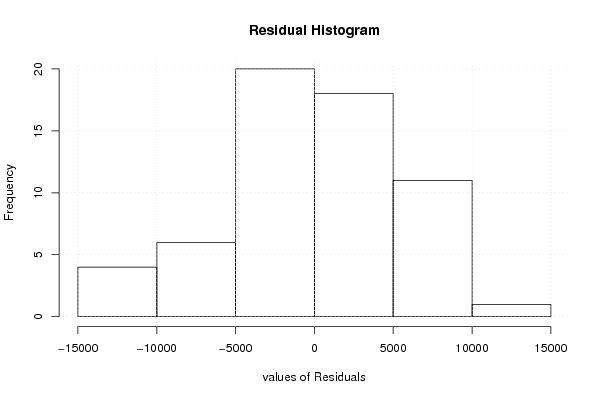
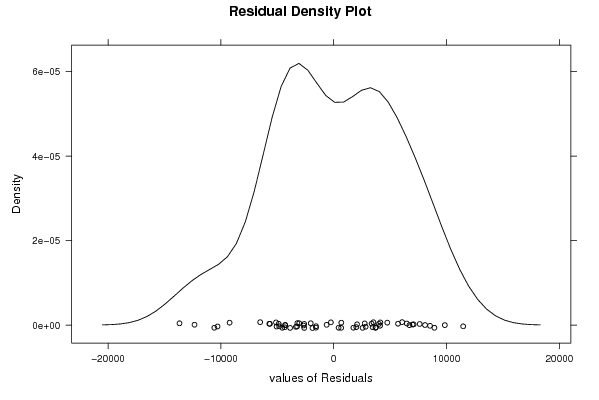
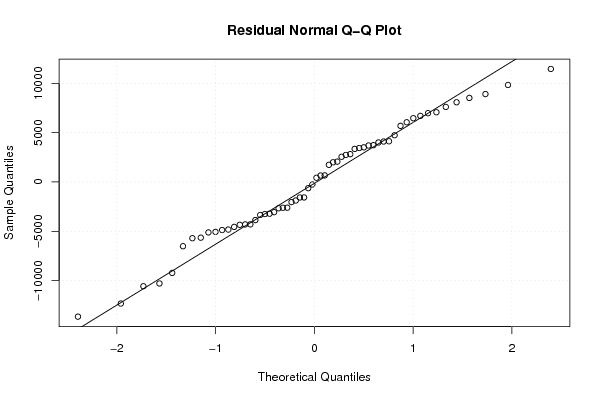
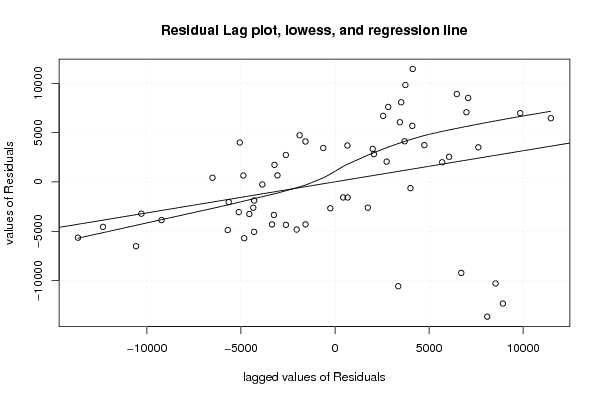
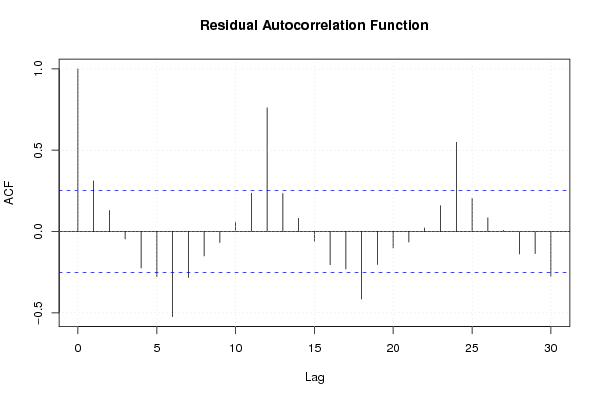
| Multiple Linear Regression - Residual Statistics | |
| Residual Standard Deviation | 5790.10238691632 |
| Sum Squared Residuals | 1944466567.7565 |
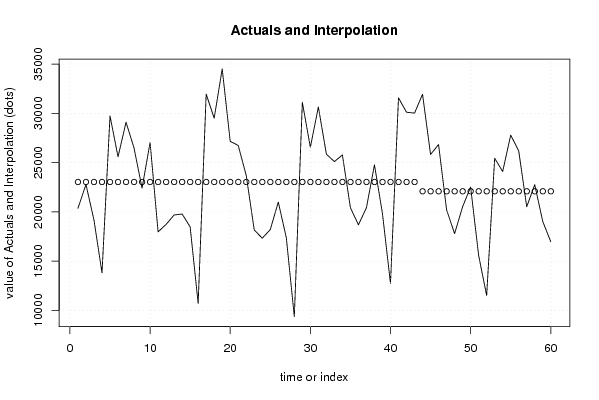
| Multiple Linear Regression - Actuals, Interpolation, and Residuals | |||
| Time or Index | Actuals | Interpolation Forecast | Residuals Prediction Error |
| 1 | 20366 | 23033.534883721 | -2667.53488372098 |
| 2 | 22782 | 23033.5348837209 | -251.534883720928 |
| 3 | 19169 | 23033.5348837209 | -3864.53488372093 |
| 4 | 13807 | 23033.5348837209 | -9226.53488372093 |
| 5 | 29743 | 23033.5348837209 | 6709.46511627907 |
| 6 | 25591 | 23033.5348837209 | 2557.46511627907 |
| 7 | 29096 | 23033.5348837209 | 6062.46511627907 |
| 8 | 26482 | 23033.5348837209 | 3448.46511627907 |
| 9 | 22405 | 23033.5348837209 | -628.534883720929 |
| 10 | 27044 | 23033.5348837209 | 4010.46511627907 |
| 11 | 17970 | 23033.5348837209 | -5063.53488372093 |
| 12 | 18730 | 23033.5348837209 | -4303.53488372093 |
| 13 | 19684 | 23033.5348837209 | -3349.53488372093 |
| 14 | 19785 | 23033.5348837209 | -3248.53488372093 |
| 15 | 18479 | 23033.5348837209 | -4554.53488372093 |
| 16 | 10698 | 23033.5348837209 | -12335.5348837209 |
| 17 | 31956 | 23033.5348837209 | 8922.46511627907 |
| 18 | 29506 | 23033.5348837209 | 6472.46511627907 |
| 19 | 34506 | 23033.5348837209 | 11472.4651162791 |
| 20 | 27165 | 23033.5348837209 | 4131.46511627907 |
| 21 | 26736 | 23033.5348837209 | 3702.46511627907 |
| 22 | 23691 | 23033.5348837209 | 657.465116279071 |
| 23 | 18157 | 23033.5348837209 | -4876.53488372093 |
| 24 | 17328 | 23033.5348837209 | -5705.53488372093 |
| 25 | 18205 | 23033.5348837209 | -4828.53488372093 |
| 26 | 20995 | 23033.5348837209 | -2038.53488372093 |
| 27 | 17382 | 23033.5348837209 | -5651.53488372093 |
| 28 | 9367 | 23033.5348837209 | -13666.5348837209 |
| 29 | 31124 | 23033.5348837209 | 8090.46511627907 |
| 30 | 26551 | 23033.5348837209 | 3517.46511627907 |
| 31 | 30651 | 23033.5348837209 | 7617.46511627907 |
| 32 | 25859 | 23033.5348837209 | 2825.46511627907 |
| 33 | 25100 | 23033.5348837209 | 2066.46511627907 |
| 34 | 25778 | 23033.5348837209 | 2744.46511627907 |
| 35 | 20418 | 23033.5348837209 | -2615.53488372093 |
| 36 | 18688 | 23033.5348837209 | -4345.53488372093 |
| 37 | 20424 | 23033.5348837209 | -2609.53488372093 |
| 38 | 24776 | 23033.5348837209 | 1742.46511627907 |
| 39 | 19814 | 23033.5348837209 | -3219.53488372093 |
| 40 | 12738 | 23033.5348837209 | -10295.5348837209 |
| 41 | 31566 | 23033.5348837209 | 8532.46511627907 |
| 42 | 30111 | 23033.5348837209 | 7077.46511627907 |
| 43 | 30019 | 23033.5348837209 | 6985.46511627907 |
| 44 | 31934 | 22088.2352941177 | 9845.76470588235 |
| 45 | 25826 | 22088.2352941176 | 3737.76470588235 |
| 46 | 26835 | 22088.2352941176 | 4746.76470588235 |
| 47 | 20205 | 22088.2352941176 | -1883.23529411765 |
| 48 | 17789 | 22088.2352941176 | -4299.23529411765 |
| 49 | 20520 | 22088.2352941176 | -1568.23529411765 |
| 50 | 22518 | 22088.2352941176 | 429.764705882353 |
| 51 | 15572 | 22088.2352941176 | -6516.23529411765 |
| 52 | 11509 | 22088.2352941177 | -10579.2352941176 |
| 53 | 25447 | 22088.2352941176 | 3358.76470588235 |
| 54 | 24090 | 22088.2352941176 | 2001.76470588235 |
| 55 | 27786 | 22088.2352941176 | 5697.76470588235 |
| 56 | 26195 | 22088.2352941176 | 4106.76470588235 |
| 57 | 20516 | 22088.2352941176 | -1572.23529411765 |
| 58 | 22759 | 22088.2352941176 | 670.764705882353 |
| 59 | 19028 | 22088.2352941176 | -3060.23529411765 |
| 60 | 16971 | 22088.2352941176 | -5117.23529411765 |
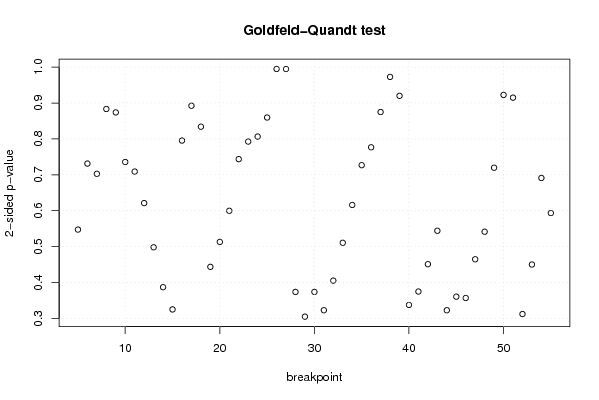
| Goldfeld-Quandt test for Heteroskedasticity | |||
| p-values | Alternative Hypothesis | ||
| breakpoint index | greater | 2-sided | less |
| 5 | 0.726242148833782 | 0.547515702332435 | 0.273757851166218 |
| 6 | 0.634319104782365 | 0.731361790435271 | 0.365680895217635 |
| 7 | 0.648559077414263 | 0.702881845171474 | 0.351440922585737 |
| 8 | 0.558251376069224 | 0.883497247861553 | 0.441748623930776 |
| 9 | 0.436943093954723 | 0.873886187909447 | 0.563056906045277 |
| 10 | 0.367863501424219 | 0.735727002848439 | 0.63213649857578 |
| 11 | 0.354543144489719 | 0.709086288979438 | 0.645456855510281 |
| 12 | 0.310610689061690 | 0.621221378123379 | 0.68938931093831 |
| 13 | 0.249058164531157 | 0.498116329062314 | 0.750941835468843 |
| 14 | 0.193468666028128 | 0.386937332056257 | 0.806531333971872 |
| 15 | 0.16253398866694 | 0.32506797733388 | 0.83746601133306 |
| 16 | 0.397739870157622 | 0.795479740315244 | 0.602260129842378 |
| 17 | 0.553775359894461 | 0.892449280211078 | 0.446224640105539 |
| 18 | 0.582937561641072 | 0.834124876717856 | 0.417062438358928 |
| 19 | 0.778147254667975 | 0.44370549066405 | 0.221852745332025 |
| 20 | 0.743451870961994 | 0.513096258076013 | 0.256548129038006 |
| 21 | 0.700077281861626 | 0.599845436276749 | 0.299922718138374 |
| 22 | 0.628138586117717 | 0.743722827764567 | 0.371861413882283 |
| 23 | 0.603657615026532 | 0.792684769946935 | 0.396342384973468 |
| 24 | 0.596687432442134 | 0.806625135115731 | 0.403312567557866 |
| 25 | 0.570165692272063 | 0.859668615455874 | 0.429834307727937 |
| 26 | 0.50250542758409 | 0.99498914483182 | 0.49749457241591 |
| 27 | 0.497388708562998 | 0.994777417125997 | 0.502611291437002 |
| 28 | 0.813120849604366 | 0.373758300791269 | 0.186879150395634 |
| 29 | 0.847543319031472 | 0.304913361937055 | 0.152456680968528 |
| 30 | 0.813073986990404 | 0.373852026019191 | 0.186926013009596 |
| 31 | 0.838595254976473 | 0.322809490047055 | 0.161404745023527 |
| 32 | 0.797357321126985 | 0.40528535774603 | 0.202642678873015 |
| 33 | 0.744658048995803 | 0.510683902008394 | 0.255341951004197 |
| 34 | 0.69195916247008 | 0.616081675059841 | 0.308040837529921 |
| 35 | 0.636584445201829 | 0.726831109596342 | 0.363415554798171 |
| 36 | 0.611639160939518 | 0.776721678120963 | 0.388360839060482 |
| 37 | 0.562533008672585 | 0.874933982654831 | 0.437466991327415 |
| 38 | 0.486378691255829 | 0.972757382511658 | 0.513621308744171 |
| 39 | 0.46004761336335 | 0.9200952267267 | 0.53995238663665 |
| 40 | 0.831256393324574 | 0.337487213350852 | 0.168743606675426 |
| 41 | 0.812557610740076 | 0.374884778519847 | 0.187442389259924 |
| 42 | 0.774464627478027 | 0.451070745043947 | 0.225535372521973 |
| 43 | 0.727894351687028 | 0.544211296625943 | 0.272105648312972 |
| 44 | 0.838599055985899 | 0.322801888028203 | 0.161400944014101 |
| 45 | 0.819739904154895 | 0.36052019169021 | 0.180260095845105 |
| 46 | 0.82152780025067 | 0.356944399498659 | 0.178472199749330 |
| 47 | 0.767614787313692 | 0.464770425372617 | 0.232385212686308 |
| 48 | 0.729238488195704 | 0.541523023608591 | 0.270761511804296 |
| 49 | 0.640097568198859 | 0.719804863602282 | 0.359902431801141 |
| 50 | 0.538704694991676 | 0.922590610016648 | 0.461295305008324 |
| 51 | 0.542484891089885 | 0.915030217820231 | 0.457515108910115 |
| 52 | 0.84392707831757 | 0.312145843364858 | 0.156072921682429 |
| 53 | 0.774916382221755 | 0.450167235556490 | 0.225083617778245 |
| 54 | 0.654329545313974 | 0.691340909372051 | 0.345670454686026 |
| 55 | 0.703230334175468 | 0.593539331649063 | 0.296769665824532 |
| Meta Analysis of Goldfeld-Quandt test for Heteroskedasticity | |||
| Description | # significant tests | % significant tests | OK/NOK |
| 1% type I error level | 0 | 0 | OK |
| 5% type I error level | 0 | 0 | OK |
| 10% type I error level | 0 | 0 | OK |