| Multiple Linear Regression - Estimated Regression Equation |
| BESTC[t] = -0.75448327137553 + 0.307049523018442INDUSTR[t] + 0.694996652147111Y3[t] + 1.72757373099391M1[t] -0.579545947732459M2[t] + 2.03034588826871M3[t] -0.75591220373799M4[t] -3.99789829388022M5[t] -1.18967180175891M6[t] + 0.298094479651019M7[t] + 6.44444054242996M8[t] + 1.32753134816382M9[t] + 3.57349423814607M10[t] + 3.23498817808467M11[t] + 0.0472542409650887t + e[t] |
| Multiple Linear Regression - Ordinary Least Squares | |||||
| Variable | Parameter | S.D. | T-STAT H0: parameter = 0 | 2-tail p-value | 1-tail p-value |
| (Intercept) | -0.75448327137553 | 8.666941 | -0.0871 | 0.931043 | 0.465522 |
| INDUSTR | 0.307049523018442 | 0.038377 | 8.0008 | 0 | 0 |
| Y3 | 0.694996652147111 | 0.096251 | 7.2207 | 0 | 0 |
| M1 | 1.72757373099391 | 0.863791 | 2 | 0.051996 | 0.025998 |
| M2 | -0.579545947732459 | 1.040881 | -0.5568 | 0.58063 | 0.290315 |
| M3 | 2.03034588826871 | 1.010433 | 2.0094 | 0.050951 | 0.025476 |
| M4 | -0.75591220373799 | 0.893009 | -0.8465 | 0.402084 | 0.201042 |
| M5 | -3.99789829388022 | 0.855833 | -4.6714 | 3.1e-05 | 1.5e-05 |
| M6 | -1.18967180175891 | 0.871828 | -1.3646 | 0.179655 | 0.089827 |
| M7 | 0.298094479651019 | 0.734704 | 0.4057 | 0.686997 | 0.343499 |
| M8 | 6.44444054242996 | 0.923344 | 6.9795 | 0 | 0 |
| M9 | 1.32753134816382 | 0.731309 | 1.8153 | 0.076625 | 0.038313 |
| M10 | 3.57349423814607 | 0.820174 | 4.357 | 8.3e-05 | 4.2e-05 |
| M11 | 3.23498817808467 | 0.8578 | 3.7713 | 0.000502 | 0.000251 |
| t | 0.0472542409650887 | 0.031433 | 1.5033 | 0.140235 | 0.070117 |
| Multiple Linear Regression - Regression Statistics | |
| Multiple R | 0.98466733380303 |
| R-squared | 0.969569758258765 |
| Adjusted R-squared | 0.95942634434502 |
| F-TEST (value) | 95.586137616345 |
| F-TEST (DF numerator) | 14 |
| F-TEST (DF denominator) | 42 |
| p-value | 0 |
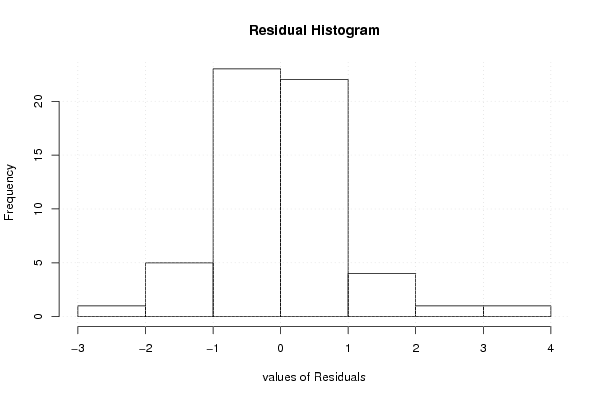
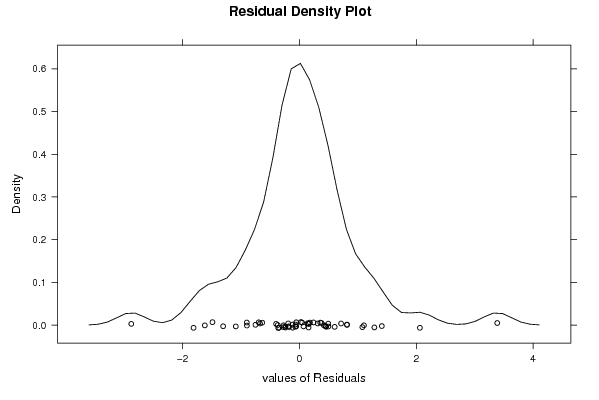
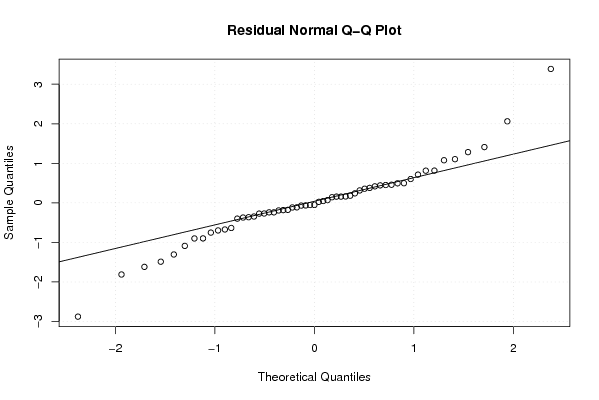
| Multiple Linear Regression - Residual Statistics | |
| Residual Standard Deviation | 1.0859361766499 |
| Sum Squared Residuals | 49.5288099497942 |
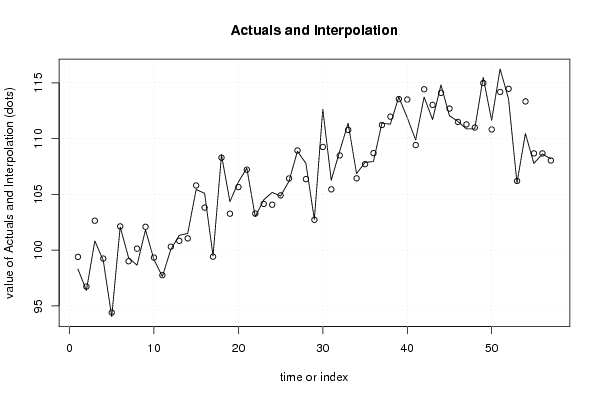
| Multiple Linear Regression - Actuals, Interpolation, and Residuals | |||
| Time or Index | Actuals | Interpolation Forecast | Residuals Prediction Error |
| 1 | 98.3 | 99.3885169653282 | -1.08851696532819 |
| 2 | 96.38 | 96.725080887137 | -0.345080887136932 |
| 3 | 100.82 | 102.631211223783 | -1.81121122378281 |
| 4 | 99.06 | 99.2369923117442 | -0.176992311744223 |
| 5 | 94.03 | 94.4008173674262 | -0.370817367426193 |
| 6 | 102.07 | 102.122970469553 | -0.0529704695527258 |
| 7 | 99.31 | 98.9958422263423 | 0.314157773657726 |
| 8 | 98.64 | 100.127656802392 | -1.48765680239229 |
| 9 | 101.82 | 102.088907690541 | -0.268907690540689 |
| 10 | 99.14 | 99.332028926774 | -0.192028926773886 |
| 11 | 97.63 | 97.7460956385892 | -0.116095638589223 |
| 12 | 100.06 | 100.299520570010 | -0.239520570009528 |
| 13 | 101.32 | 100.825856560251 | 0.494143439748832 |
| 14 | 101.49 | 101.047615692460 | 0.442384307540174 |
| 15 | 105.43 | 105.792768014068 | -0.362768014067527 |
| 16 | 105.09 | 103.806640135524 | 1.2833598644761 |
| 17 | 99.48 | 99.4097447682325 | 0.0702552317675301 |
| 18 | 108.53 | 108.288942207076 | 0.241057792924179 |
| 19 | 104.34 | 103.262443693541 | 1.07755630645909 |
| 20 | 106.1 | 105.649227635645 | 0.450772364354807 |
| 21 | 107.35 | 107.207046859596 | 0.142953140404218 |
| 22 | 103 | 103.272093169448 | -0.272093169447541 |
| 23 | 104.5 | 104.142625553526 | 0.357374446473547 |
| 24 | 105.17 | 104.065098949625 | 1.10490105037461 |
| 25 | 104.84 | 104.904628241270 | -0.0646282412698626 |
| 26 | 106.18 | 106.419998536593 | -0.239998536593377 |
| 27 | 108.86 | 108.928693324461 | -0.068693324461323 |
| 28 | 107.77 | 106.359504958135 | 1.41049504186485 |
| 29 | 102.74 | 102.714345769252 | 0.0256542307478491 |
| 30 | 112.63 | 109.244009715902 | 3.3859902840984 |
| 31 | 106.26 | 105.446445994461 | 0.813554005538527 |
| 32 | 108.86 | 108.481967613226 | 0.378032386774175 |
| 33 | 111.38 | 110.777108786489 | 0.602891213510783 |
| 34 | 106.85 | 106.432440677527 | 0.417559322473321 |
| 35 | 107.86 | 107.702540535598 | 0.157459464401905 |
| 36 | 107.94 | 108.691889393735 | -0.751889393734923 |
| 37 | 111.38 | 111.217911473802 | 0.162088526198271 |
| 38 | 111.29 | 111.962864077347 | -0.672864077347334 |
| 39 | 113.72 | 113.539526651317 | 0.180473348682869 |
| 40 | 111.88 | 113.49836080668 | -1.61836080668003 |
| 41 | 109.87 | 109.412045546660 | 0.457954453340149 |
| 42 | 113.72 | 114.416942428991 | -0.696942428991389 |
| 43 | 111.71 | 113.015101687116 | -1.30510168711614 |
| 44 | 114.81 | 114.096459491521 | 0.713540508478675 |
| 45 | 112.05 | 112.685100122646 | -0.635100122645671 |
| 46 | 111.54 | 111.493437226252 | 0.0465627737481058 |
| 47 | 110.87 | 111.268738272286 | -0.398738272286228 |
| 48 | 110.87 | 110.983491086630 | -0.113491086630163 |
| 49 | 115.48 | 114.983086759349 | 0.496913240650947 |
| 50 | 111.63 | 110.814440806463 | 0.815559193537468 |
| 51 | 116.24 | 114.177800786371 | 2.06219921362879 |
| 52 | 113.56 | 114.458501787917 | -0.898501787916705 |
| 53 | 106.01 | 106.193046548429 | -0.183046548429334 |
| 54 | 110.45 | 113.327135178478 | -2.87713517847846 |
| 55 | 107.77 | 108.670166398539 | -0.9001663985392 |
| 56 | 108.61 | 108.664688457215 | -0.0546884572153699 |
| 57 | 108.19 | 108.031836540729 | 0.158163459271359 |
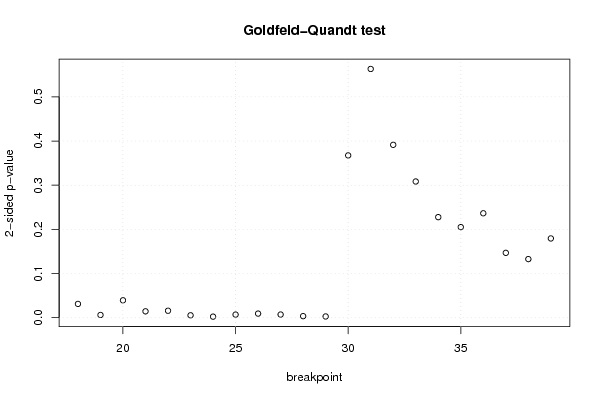
| Goldfeld-Quandt test for Heteroskedasticity | |||
| p-values | Alternative Hypothesis | ||
| breakpoint index | greater | 2-sided | less |
| 18 | 0.0156320235133899 | 0.0312640470267798 | 0.98436797648661 |
| 19 | 0.00312730066804834 | 0.00625460133609669 | 0.996872699331952 |
| 20 | 0.0197379294690186 | 0.0394758589380372 | 0.980262070530981 |
| 21 | 0.00726961134014399 | 0.0145392226802880 | 0.992730388659856 |
| 22 | 0.00792279400655488 | 0.0158455880131098 | 0.992077205993445 |
| 23 | 0.00275747901082016 | 0.00551495802164032 | 0.99724252098918 |
| 24 | 0.00122855038029354 | 0.00245710076058709 | 0.998771449619706 |
| 25 | 0.00355053968126461 | 0.00710107936252923 | 0.996449460318735 |
| 26 | 0.00468918375973849 | 0.00937836751947698 | 0.995310816240262 |
| 27 | 0.00361316363691891 | 0.00722632727383783 | 0.996386836363081 |
| 28 | 0.00181204479657147 | 0.00362408959314294 | 0.998187955203429 |
| 29 | 0.00144693230535361 | 0.00289386461070723 | 0.998553067694646 |
| 30 | 0.183709231137181 | 0.367418462274362 | 0.81629076886282 |
| 31 | 0.281565745793818 | 0.563131491587636 | 0.718434254206182 |
| 32 | 0.195694440567751 | 0.391388881135502 | 0.80430555943225 |
| 33 | 0.154180432058697 | 0.308360864117394 | 0.845819567941303 |
| 34 | 0.113840621212836 | 0.227681242425672 | 0.886159378787164 |
| 35 | 0.102572273979482 | 0.205144547958965 | 0.897427726020518 |
| 36 | 0.118235944853522 | 0.236471889707044 | 0.881764055146478 |
| 37 | 0.0734427033309255 | 0.146885406661851 | 0.926557296669074 |
| 38 | 0.066356891729443 | 0.132713783458886 | 0.933643108270557 |
| 39 | 0.089739527930211 | 0.179479055860422 | 0.910260472069789 |
| Meta Analysis of Goldfeld-Quandt test for Heteroskedasticity | |||
| Description | # significant tests | % significant tests | OK/NOK |
| 1% type I error level | 8 | 0.363636363636364 | NOK |
| 5% type I error level | 12 | 0.545454545454545 | NOK |
| 10% type I error level | 12 | 0.545454545454545 | NOK |