Free Statistics

of Irreproducible Research!

Author's title

Author*The author of this computation has been verified*
R Software Modulerwasp_smp.wasp
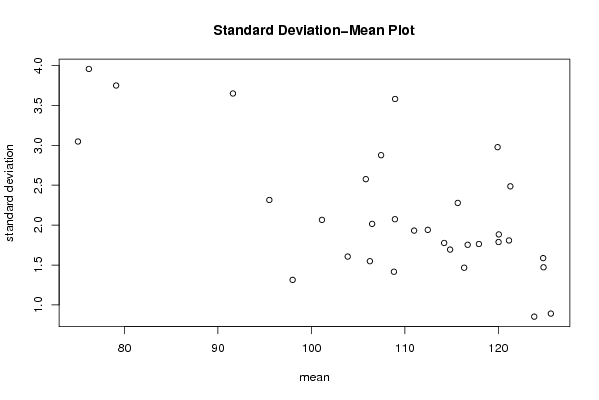
Title produced by softwareStandard Deviation-Mean Plot
Date of computationWed, 16 Dec 2009 05:39:03 -0700
Cite this page as followsStatistical Computations at FreeStatistics.org, Office for Research Development and Education, URL https://freestatistics.org/blog/index.php?v=date/2009/Dec/16/t1260967177569qfpsjs818ep8.htm/, Retrieved Tue, 30 Apr 2024 13:04:01 +0000
Statistical Computations at FreeStatistics.org, Office for Research Development and Education, URL https://freestatistics.org/blog/index.php?pk=68277, Retrieved Tue, 30 Apr 2024 13:04:01 +0000
QR Codes:

Original text written by user:
IsPrivate?No (this computation is public)
User-defined keywords
Estimated Impact152
Family? (F = Feedback message, R = changed R code, M = changed R Module, P = changed Parameters, D = changed Data)
F     [Law of Averages] [Random Walk Simul...] [2008-11-25 18:40:39] [b98453cac15ba1066b407e146608df68]
F       [Law of Averages] [WS7 Task 4] [2008-11-30 15:52:14] [11ac052cc87d77b9933b02bea117068e]
- RMPD    [Standard Deviation-Mean Plot] [WS7 Task 5 Correc...] [2008-12-02 17:34:41] [11ac052cc87d77b9933b02bea117068e]
-    D      [Standard Deviation-Mean Plot] [VS STDPLOT] [2008-12-13 22:46:20] [c4e82a203a5642d47e013a6c97b9cd86]
-    D        [Standard Deviation-Mean Plot] [Daw Jones in de VS] [2008-12-13 23:26:13] [c4e82a203a5642d47e013a6c97b9cd86]
-               [Standard Deviation-Mean Plot] [Standard Deviatio...] [2008-12-14 17:33:21] [74be16979710d4c4e7c6647856088456]
-  M                [Standard Deviation-Mean Plot] [] [2009-12-16 12:39:03] [d41d8cd98f00b204e9800998ecf8427e] [Current]
Feedback Forum

Post a new message
Dataseries X:
122.36
123.33
123.04
124.53
125.13
125.85
126.50
126.53
127.07
124.55
124.90
124.32
122.84
123.31
123.31
124.87
124.64
124.73
124.90
124.04
123.28
123.86
122.29
124.09
124.54
125.65
125.70
125.53
125.61
125.55
125.41
127.60
124.68
124.41
126.43
126.38
125.78
124.70
125.07
125.25
126.58
127.13
125.82
123.70
124.39
123.70
124.42
121.05
121.02
123.23
121.32
120.91
120.72
123.31
119.58
119.53
120.59
118.63
118.47
111.81
114.71
117.34
115.77
118.38
117.84
118.83
120.02
116.21
117.08
120.20
119.83
118.92
118.03
117.71
119.55
116.13
115.97
115.99
114.96
116.46
116.55
113.05
117.44
118.84
117.06
117.54
119.31
118.72
121.55
122.61
121.53
123.31
124.07
123.59
122.97
123.22
123.04
122.96
122.81
122.81
122.62
120.82
119.41
121.56
121.59
118.50
118.77
118.86
117.60
119.90
121.83
121.84
122.12
122.12
121.36
119.66
119.32
120.36
117.06
117.48
115.60
113.86
116.92
117.75
117.75
115.31
116.28
115.22
115.65
115.11
118.67
118.04
116.50
119.78
119.95
120.37
119.79
119.43
121.06
121.74
121.09
122.97
120.50
117.18
115.03
113.36
112.59
111.65
111.98
114.87
114.67
114.09
114.77
117.05
117.22
113.18
110.95
112.14
112.72
110.01
110.29
110.74
110.32
105.89
108.97
109.34
106.57
99.49
101.81
104.29
109.73
105.06
107.97
108.13
109.86
108.95
111.20
110.69
106.10
105.68
104.12
104.71
104.30
103.52
107.76
107.80
107.30
108.64
105.03
108.30
107.21
109.27
109.50
111.68
111.80
111.75
106.68
106.37
105.76
109.01
109.01
109.01
109.01
107.69
105.19
105.48
102.22
100.54
105.00
105.44
107.89
108.64
106.70
109.10
105.23
108.41
108.80
110.39
110.22
110.86
108.58
107.70
106.62
109.84
107.16
107.26
108.70
109.85
109.41
112.36
111.03
110.67
109.21
113.58
113.88
114.08
112.33
113.92
114.41
114.57
115.35
113.13
113.29
112.56
113.06
113.46
115.39
116.62
117.04
117.42
115.62
115.16
115.69
112.85
114.05
112.00
113.74
116.26
118.63
116.49
118.23
116.83
118.82
114.36
112.02
113.24
109.75
110.33
112.86
113.04
113.80
110.90
109.96
108.69
108.84
108.47
108.07
107.94
108.11
108.11
106.81
105.58
105.61
106.52
103.86
104.60
104.73
105.12
104.76
103.85
103.83
103.22
101.64
102.13
104.33
104.92
107.78
104.49
102.80
102.86
104.51
104.73
102.58
99.93
101.41
101.05
99.86
101.11
100.89
101.09
98.31
98.08
99.55
99.62
97.37
98.16
97.98
98.15
97.10
97.24
96.70
96.64
100.65
96.75
97.74
97.92
98.34
93.84
97.80
96.20
95.99
95.18
95.95
92.23
91.78
92.97
89.76
92.88
96.23
95.79
93.97
93.90
93.60
93.96
88.69
88.57
85.62
86.25
85.33
83.33
77.78
78.70
72.05
80.75
81.41
82.65
75.85
75.70
78.25
77.41
76.84
74.25
74.95
68.78
73.21
73.26
78.67
75.63
74.99
83.87
79.62
80.13
79.76
78.20
78.05
79.05
73.32
75.17
73.26
73.72
73.57
70.60
71.25
74.22
73.32
73.01
74.21
75.32
71.73
71.94
72.94
72.47
71.94
74.30
74.30


Summary of computational transaction
Raw Inputview raw input (R code)
Raw Outputview raw output of R engine
Computing time2 seconds
R Server'Gwilym Jenkins' @ 72.249.127.135

\begin{tabular}{lllllllll}
\hline
Summary of computational transaction \tabularnewline
Raw Input & view raw input (R code)  \tabularnewline
Raw Output & view raw output of R engine  \tabularnewline
Computing time & 2 seconds \tabularnewline
R Server & 'Gwilym Jenkins' @ 72.249.127.135 \tabularnewline
\hline
\end{tabular}
%Source: https://freestatistics.org/blog/index.php?pk=68277&T=0

[TABLE]
[ROW][C]Summary of computational transaction[/C][/ROW]
[ROW][C]Raw Input[/C][C]view raw input (R code) [/C][/ROW]
[ROW][C]Raw Output[/C][C]view raw output of R engine [/C][/ROW]
[ROW][C]Computing time[/C][C]2 seconds[/C][/ROW]
[ROW][C]R Server[/C][C]'Gwilym Jenkins' @ 72.249.127.135[/C][/ROW]
[/TABLE]
Source: https://freestatistics.org/blog/index.php?pk=68277&T=0

Globally Unique Identifier (entire table): ba.freestatistics.org/blog/index.php?pk=68277&T=0

As an alternative you can also use a QR Code:  

The GUIDs for individual cells are displayed in the table below:

Summary of computational transaction
Raw Inputview raw input (R code)
Raw Outputview raw output of R engine
Computing time2 seconds
R Server'Gwilym Jenkins' @ 72.249.127.135


Standard Deviation-Mean Plot
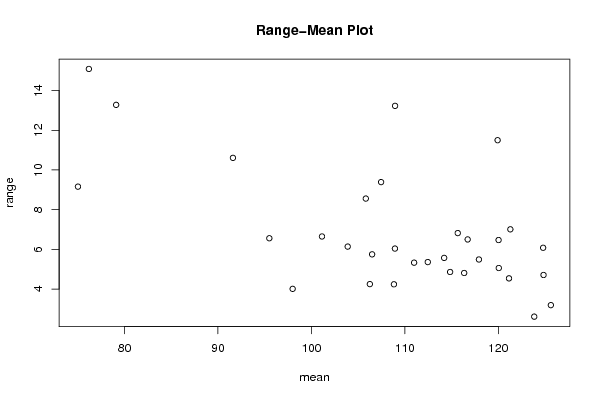
SectionMeanStandard DeviationRange
1124.84251.471345240989284.70999999999999
2123.8466666666670.8526358418386362.61
3125.6241666666670.8909898309115973.19
4124.7991666666671.586261805362386.08
5119.9266666666672.9770801233097611.5
6117.92751.763122875107485.49000000000001
7116.7233333333331.753548782707046.5
8121.292.486223861784997.00999999999999
9121.1458333333331.807793523675324.54000000000001
10120.0541666666671.883162032971215.06
11116.3466666666671.465880643369734.81
12120.031.787802104159286.47
13114.2051.776290823854335.56999999999999
14108.95253.5810260718504613.23
15107.4558333333332.876419675832299.39
16106.4966666666672.015031393093305.75
17108.9391666666672.073729439410746.03999999999999
18105.822.576008187451708.55999999999999
19108.8316666666671.415568201583144.23999999999999
20112.4541666666671.940522227430425.36
21114.8416666666671.693194041037844.86
22115.66252.278161639248956.81999999999999
23110.9916666666671.931178789017615.33
24106.2551.547851883917014.25
25103.8841666666671.605849864675656.14
26101.1291666666672.065717829597056.65
2797.99251.313697938160554.01000000000001
2895.4952.315012271713016.56
2991.60166666666673.6497243565491210.61
3079.10083333333333.7498229251121913.28
3176.18333333333333.9574034952532215.09
3275.01416666666673.047999219557689.16000000000001

\begin{tabular}{lllllllll}
\hline
Standard Deviation-Mean Plot \tabularnewline
Section & Mean & Standard Deviation & Range \tabularnewline
1 & 124.8425 & 1.47134524098928 & 4.70999999999999 \tabularnewline
2 & 123.846666666667 & 0.852635841838636 & 2.61 \tabularnewline
3 & 125.624166666667 & 0.890989830911597 & 3.19 \tabularnewline
4 & 124.799166666667 & 1.58626180536238 & 6.08 \tabularnewline
5 & 119.926666666667 & 2.97708012330976 & 11.5 \tabularnewline
6 & 117.9275 & 1.76312287510748 & 5.49000000000001 \tabularnewline
7 & 116.723333333333 & 1.75354878270704 & 6.5 \tabularnewline
8 & 121.29 & 2.48622386178499 & 7.00999999999999 \tabularnewline
9 & 121.145833333333 & 1.80779352367532 & 4.54000000000001 \tabularnewline
10 & 120.054166666667 & 1.88316203297121 & 5.06 \tabularnewline
11 & 116.346666666667 & 1.46588064336973 & 4.81 \tabularnewline
12 & 120.03 & 1.78780210415928 & 6.47 \tabularnewline
13 & 114.205 & 1.77629082385433 & 5.56999999999999 \tabularnewline
14 & 108.9525 & 3.58102607185046 & 13.23 \tabularnewline
15 & 107.455833333333 & 2.87641967583229 & 9.39 \tabularnewline
16 & 106.496666666667 & 2.01503139309330 & 5.75 \tabularnewline
17 & 108.939166666667 & 2.07372943941074 & 6.03999999999999 \tabularnewline
18 & 105.82 & 2.57600818745170 & 8.55999999999999 \tabularnewline
19 & 108.831666666667 & 1.41556820158314 & 4.23999999999999 \tabularnewline
20 & 112.454166666667 & 1.94052222743042 & 5.36 \tabularnewline
21 & 114.841666666667 & 1.69319404103784 & 4.86 \tabularnewline
22 & 115.6625 & 2.27816163924895 & 6.81999999999999 \tabularnewline
23 & 110.991666666667 & 1.93117878901761 & 5.33 \tabularnewline
24 & 106.255 & 1.54785188391701 & 4.25 \tabularnewline
25 & 103.884166666667 & 1.60584986467565 & 6.14 \tabularnewline
26 & 101.129166666667 & 2.06571782959705 & 6.65 \tabularnewline
27 & 97.9925 & 1.31369793816055 & 4.01000000000001 \tabularnewline
28 & 95.495 & 2.31501227171301 & 6.56 \tabularnewline
29 & 91.6016666666667 & 3.64972435654912 & 10.61 \tabularnewline
30 & 79.1008333333333 & 3.74982292511219 & 13.28 \tabularnewline
31 & 76.1833333333333 & 3.95740349525322 & 15.09 \tabularnewline
32 & 75.0141666666667 & 3.04799921955768 & 9.16000000000001 \tabularnewline
\hline
\end{tabular}
%Source: https://freestatistics.org/blog/index.php?pk=68277&T=1

[TABLE]
[ROW][C]Standard Deviation-Mean Plot[/C][/ROW]
[ROW][C]Section[/C][C]Mean[/C][C]Standard Deviation[/C][C]Range[/C][/ROW]
[ROW][C]1[/C][C]124.8425[/C][C]1.47134524098928[/C][C]4.70999999999999[/C][/ROW]
[ROW][C]2[/C][C]123.846666666667[/C][C]0.852635841838636[/C][C]2.61[/C][/ROW]
[ROW][C]3[/C][C]125.624166666667[/C][C]0.890989830911597[/C][C]3.19[/C][/ROW]
[ROW][C]4[/C][C]124.799166666667[/C][C]1.58626180536238[/C][C]6.08[/C][/ROW]
[ROW][C]5[/C][C]119.926666666667[/C][C]2.97708012330976[/C][C]11.5[/C][/ROW]
[ROW][C]6[/C][C]117.9275[/C][C]1.76312287510748[/C][C]5.49000000000001[/C][/ROW]
[ROW][C]7[/C][C]116.723333333333[/C][C]1.75354878270704[/C][C]6.5[/C][/ROW]
[ROW][C]8[/C][C]121.29[/C][C]2.48622386178499[/C][C]7.00999999999999[/C][/ROW]
[ROW][C]9[/C][C]121.145833333333[/C][C]1.80779352367532[/C][C]4.54000000000001[/C][/ROW]
[ROW][C]10[/C][C]120.054166666667[/C][C]1.88316203297121[/C][C]5.06[/C][/ROW]
[ROW][C]11[/C][C]116.346666666667[/C][C]1.46588064336973[/C][C]4.81[/C][/ROW]
[ROW][C]12[/C][C]120.03[/C][C]1.78780210415928[/C][C]6.47[/C][/ROW]
[ROW][C]13[/C][C]114.205[/C][C]1.77629082385433[/C][C]5.56999999999999[/C][/ROW]
[ROW][C]14[/C][C]108.9525[/C][C]3.58102607185046[/C][C]13.23[/C][/ROW]
[ROW][C]15[/C][C]107.455833333333[/C][C]2.87641967583229[/C][C]9.39[/C][/ROW]
[ROW][C]16[/C][C]106.496666666667[/C][C]2.01503139309330[/C][C]5.75[/C][/ROW]
[ROW][C]17[/C][C]108.939166666667[/C][C]2.07372943941074[/C][C]6.03999999999999[/C][/ROW]
[ROW][C]18[/C][C]105.82[/C][C]2.57600818745170[/C][C]8.55999999999999[/C][/ROW]
[ROW][C]19[/C][C]108.831666666667[/C][C]1.41556820158314[/C][C]4.23999999999999[/C][/ROW]
[ROW][C]20[/C][C]112.454166666667[/C][C]1.94052222743042[/C][C]5.36[/C][/ROW]
[ROW][C]21[/C][C]114.841666666667[/C][C]1.69319404103784[/C][C]4.86[/C][/ROW]
[ROW][C]22[/C][C]115.6625[/C][C]2.27816163924895[/C][C]6.81999999999999[/C][/ROW]
[ROW][C]23[/C][C]110.991666666667[/C][C]1.93117878901761[/C][C]5.33[/C][/ROW]
[ROW][C]24[/C][C]106.255[/C][C]1.54785188391701[/C][C]4.25[/C][/ROW]
[ROW][C]25[/C][C]103.884166666667[/C][C]1.60584986467565[/C][C]6.14[/C][/ROW]
[ROW][C]26[/C][C]101.129166666667[/C][C]2.06571782959705[/C][C]6.65[/C][/ROW]
[ROW][C]27[/C][C]97.9925[/C][C]1.31369793816055[/C][C]4.01000000000001[/C][/ROW]
[ROW][C]28[/C][C]95.495[/C][C]2.31501227171301[/C][C]6.56[/C][/ROW]
[ROW][C]29[/C][C]91.6016666666667[/C][C]3.64972435654912[/C][C]10.61[/C][/ROW]
[ROW][C]30[/C][C]79.1008333333333[/C][C]3.74982292511219[/C][C]13.28[/C][/ROW]
[ROW][C]31[/C][C]76.1833333333333[/C][C]3.95740349525322[/C][C]15.09[/C][/ROW]
[ROW][C]32[/C][C]75.0141666666667[/C][C]3.04799921955768[/C][C]9.16000000000001[/C][/ROW]
[/TABLE]
Source: https://freestatistics.org/blog/index.php?pk=68277&T=1

Globally Unique Identifier (entire table): ba.freestatistics.org/blog/index.php?pk=68277&T=1

As an alternative you can also use a QR Code:  

The GUIDs for individual cells are displayed in the table below:

Standard Deviation-Mean Plot
SectionMeanStandard DeviationRange
1124.84251.471345240989284.70999999999999
2123.8466666666670.8526358418386362.61
3125.6241666666670.8909898309115973.19
4124.7991666666671.586261805362386.08
5119.9266666666672.9770801233097611.5
6117.92751.763122875107485.49000000000001
7116.7233333333331.753548782707046.5
8121.292.486223861784997.00999999999999
9121.1458333333331.807793523675324.54000000000001
10120.0541666666671.883162032971215.06
11116.3466666666671.465880643369734.81
12120.031.787802104159286.47
13114.2051.776290823854335.56999999999999
14108.95253.5810260718504613.23
15107.4558333333332.876419675832299.39
16106.4966666666672.015031393093305.75
17108.9391666666672.073729439410746.03999999999999
18105.822.576008187451708.55999999999999
19108.8316666666671.415568201583144.23999999999999
20112.4541666666671.940522227430425.36
21114.8416666666671.693194041037844.86
22115.66252.278161639248956.81999999999999
23110.9916666666671.931178789017615.33
24106.2551.547851883917014.25
25103.8841666666671.605849864675656.14
26101.1291666666672.065717829597056.65
2797.99251.313697938160554.01000000000001
2895.4952.315012271713016.56
2991.60166666666673.6497243565491210.61
3079.10083333333333.7498229251121913.28
3176.18333333333333.9574034952532215.09
3275.01416666666673.047999219557689.16000000000001


Regression: S.E.(k) = alpha + beta * Mean(k)
alpha6.40458521366248
beta-0.0391574188353102
S.D.0.00795642242423957
T-STAT-4.92148565616823
p-value2.9076798859406e-05

\begin{tabular}{lllllllll}
\hline
Regression: S.E.(k) = alpha + beta * Mean(k) \tabularnewline
alpha & 6.40458521366248 \tabularnewline
beta & -0.0391574188353102 \tabularnewline
S.D. & 0.00795642242423957 \tabularnewline
T-STAT & -4.92148565616823 \tabularnewline
p-value & 2.9076798859406e-05 \tabularnewline
\hline
\end{tabular}
%Source: https://freestatistics.org/blog/index.php?pk=68277&T=2

[TABLE]
[ROW][C]Regression: S.E.(k) = alpha + beta * Mean(k)[/C][/ROW]
[ROW][C]alpha[/C][C]6.40458521366248[/C][/ROW]
[ROW][C]beta[/C][C]-0.0391574188353102[/C][/ROW]
[ROW][C]S.D.[/C][C]0.00795642242423957[/C][/ROW]
[ROW][C]T-STAT[/C][C]-4.92148565616823[/C][/ROW]
[ROW][C]p-value[/C][C]2.9076798859406e-05[/C][/ROW]
[/TABLE]
Source: https://freestatistics.org/blog/index.php?pk=68277&T=2

Globally Unique Identifier (entire table): ba.freestatistics.org/blog/index.php?pk=68277&T=2

As an alternative you can also use a QR Code:  

The GUIDs for individual cells are displayed in the table below:

Regression: S.E.(k) = alpha + beta * Mean(k)
alpha6.40458521366248
beta-0.0391574188353102
S.D.0.00795642242423957
T-STAT-4.92148565616823
p-value2.9076798859406e-05


Regression: ln S.E.(k) = alpha + beta * ln Mean(k)
alpha8.6031583326768
beta-1.68946465718465
S.D.0.387600182656866
T-STAT-4.35878189118475
p-value0.000141292579643780
Lambda2.68946465718465

\begin{tabular}{lllllllll}
\hline
Regression: ln S.E.(k) = alpha + beta * ln Mean(k) \tabularnewline
alpha & 8.6031583326768 \tabularnewline
beta & -1.68946465718465 \tabularnewline
S.D. & 0.387600182656866 \tabularnewline
T-STAT & -4.35878189118475 \tabularnewline
p-value & 0.000141292579643780 \tabularnewline
Lambda & 2.68946465718465 \tabularnewline
\hline
\end{tabular}
%Source: https://freestatistics.org/blog/index.php?pk=68277&T=3

[TABLE]
[ROW][C]Regression: ln S.E.(k) = alpha + beta * ln Mean(k)[/C][/ROW]
[ROW][C]alpha[/C][C]8.6031583326768[/C][/ROW]
[ROW][C]beta[/C][C]-1.68946465718465[/C][/ROW]
[ROW][C]S.D.[/C][C]0.387600182656866[/C][/ROW]
[ROW][C]T-STAT[/C][C]-4.35878189118475[/C][/ROW]
[ROW][C]p-value[/C][C]0.000141292579643780[/C][/ROW]
[ROW][C]Lambda[/C][C]2.68946465718465[/C][/ROW]
[/TABLE]
Source: https://freestatistics.org/blog/index.php?pk=68277&T=3

Globally Unique Identifier (entire table): ba.freestatistics.org/blog/index.php?pk=68277&T=3

As an alternative you can also use a QR Code:  

The GUIDs for individual cells are displayed in the table below:

Regression: ln S.E.(k) = alpha + beta * ln Mean(k)
alpha8.6031583326768
beta-1.68946465718465
S.D.0.387600182656866
T-STAT-4.35878189118475
p-value0.000141292579643780
Lambda2.68946465718465


Parameters (Session):
par1 = 12 ;
Parameters (R input):
par1 = 12 ; par2 = ; par3 = ; par4 = ; par5 = ; par6 = ; par7 = ; par8 = ; par9 = ; par10 = ; par11 = ; par12 = ; par13 = ; par14 = ; par15 = ; par16 = ; par17 = ; par18 = ; par19 = ; par20 = ;
R code (references can be found in the software module):
par1 <- as.numeric(par1)
(n <- length(x))
(np <- floor(n / par1))
arr <- array(NA,dim=c(par1,np))
j <- 0
k <- 1
for (i in 1:(np*par1))
{
j = j + 1
arr[j,k] <- x[i]
if (j == par1) {
j = 0
k=k+1
}
}
arr
arr.mean <- array(NA,dim=np)
arr.sd <- array(NA,dim=np)
arr.range <- array(NA,dim=np)
for (j in 1:np)
{
arr.mean[j] <- mean(arr[,j],na.rm=TRUE)
arr.sd[j] <- sd(arr[,j],na.rm=TRUE)
arr.range[j] <- max(arr[,j],na.rm=TRUE) - min(arr[,j],na.rm=TRUE)
}
arr.mean
arr.sd
arr.range
(lm1 <- lm(arr.sd~arr.mean))
(lnlm1 <- lm(log(arr.sd)~log(arr.mean)))
(lm2 <- lm(arr.range~arr.mean))
bitmap(file='test1.png')
plot(arr.mean,arr.sd,main='Standard Deviation-Mean Plot',xlab='mean',ylab='standard deviation')
dev.off()
bitmap(file='test2.png')
plot(arr.mean,arr.range,main='Range-Mean Plot',xlab='mean',ylab='range')
dev.off()
load(file='createtable')
a<-table.start()
a<-table.row.start(a)
a<-table.element(a,'Standard Deviation-Mean Plot',4,TRUE)
a<-table.row.end(a)
a<-table.row.start(a)
a<-table.element(a,'Section',header=TRUE)
a<-table.element(a,'Mean',header=TRUE)
a<-table.element(a,'Standard Deviation',header=TRUE)
a<-table.element(a,'Range',header=TRUE)
a<-table.row.end(a)
for (j in 1:np) {
a<-table.row.start(a)
a<-table.element(a,j,header=TRUE)
a<-table.element(a,arr.mean[j])
a<-table.element(a,arr.sd[j] )
a<-table.element(a,arr.range[j] )
a<-table.row.end(a)
}
a<-table.end(a)
table.save(a,file='mytable.tab')
a<-table.start()
a<-table.row.start(a)
a<-table.element(a,'Regression: S.E.(k) = alpha + beta * Mean(k)',2,TRUE)
a<-table.row.end(a)
a<-table.row.start(a)
a<-table.element(a,'alpha',header=TRUE)
a<-table.element(a,lm1$coefficients[[1]])
a<-table.row.end(a)
a<-table.row.start(a)
a<-table.element(a,'beta',header=TRUE)
a<-table.element(a,lm1$coefficients[[2]])
a<-table.row.end(a)
a<-table.row.start(a)
a<-table.element(a,'S.D.',header=TRUE)
a<-table.element(a,summary(lm1)$coefficients[2,2])
a<-table.row.end(a)
a<-table.row.start(a)
a<-table.element(a,'T-STAT',header=TRUE)
a<-table.element(a,summary(lm1)$coefficients[2,3])
a<-table.row.end(a)
a<-table.row.start(a)
a<-table.element(a,'p-value',header=TRUE)
a<-table.element(a,summary(lm1)$coefficients[2,4])
a<-table.row.end(a)
a<-table.end(a)
table.save(a,file='mytable1.tab')
a<-table.start()
a<-table.row.start(a)
a<-table.element(a,'Regression: ln S.E.(k) = alpha + beta * ln Mean(k)',2,TRUE)
a<-table.row.end(a)
a<-table.row.start(a)
a<-table.element(a,'alpha',header=TRUE)
a<-table.element(a,lnlm1$coefficients[[1]])
a<-table.row.end(a)
a<-table.row.start(a)
a<-table.element(a,'beta',header=TRUE)
a<-table.element(a,lnlm1$coefficients[[2]])
a<-table.row.end(a)
a<-table.row.start(a)
a<-table.element(a,'S.D.',header=TRUE)
a<-table.element(a,summary(lnlm1)$coefficients[2,2])
a<-table.row.end(a)
a<-table.row.start(a)
a<-table.element(a,'T-STAT',header=TRUE)
a<-table.element(a,summary(lnlm1)$coefficients[2,3])
a<-table.row.end(a)
a<-table.row.start(a)
a<-table.element(a,'p-value',header=TRUE)
a<-table.element(a,summary(lnlm1)$coefficients[2,4])
a<-table.row.end(a)
a<-table.row.start(a)
a<-table.element(a,'Lambda',header=TRUE)
a<-table.element(a,1-lnlm1$coefficients[[2]])
a<-table.row.end(a)
a<-table.end(a)
table.save(a,file='mytable2.tab')