Free Statistics

of Irreproducible Research!

Author's title

Author*Unverified author*
R Software Modulerwasp_autocorrelation.wasp
Title produced by software(Partial) Autocorrelation Function
Date of computationWed, 16 Dec 2009 05:20:01 -0700
Cite this page as followsStatistical Computations at FreeStatistics.org, Office for Research Development and Education, URL https://freestatistics.org/blog/index.php?v=date/2009/Dec/16/t1260966087s7gg5tywm7twa7i.htm/, Retrieved Tue, 30 Apr 2024 11:50:08 +0000
Statistical Computations at FreeStatistics.org, Office for Research Development and Education, URL https://freestatistics.org/blog/index.php?pk=68265, Retrieved Tue, 30 Apr 2024 11:50:08 +0000
QR Codes:

Original text written by user:
IsPrivate?No (this computation is public)
User-defined keywordsKDGP2W21
Estimated Impact94
Family? (F = Feedback message, R = changed R code, M = changed R Module, P = changed Parameters, D = changed Data)
-       [(Partial) Autocorrelation Function] [niet werkende wer...] [2009-12-16 12:20:01] [8aa2720a1fbf81ca84b2e99ab4a134db] [Current]
Feedback Forum

Post a new message
Dataseries X:
89507
87562
85209
82360
79054
79069
107551
115759
115585
110260
103444
102303
101397
97994
94044
91159
87239
89235
118647
125620
125154
117529
109459
108483
107137
104699
100804
96066
91971
93228
120144
127233
127166
118194
109940
106683
102834
99882
96666
92540
88744
89321
115870
122401
122030
113802
105791
103076
98658
96945
92497
90687
88796
90015
113228
118711
117460
106556
97347
92657
93118
89037
83570
81693
75956
73993
97088
102394
96549
89727
82336
82653
82303
79596
74472
73562
66618
69029
89899
93774
90305
83799
80320
82497


Summary of computational transaction
Raw Inputview raw input (R code)
Raw Outputview raw output of R engine
Computing time2 seconds
R Server'Gwilym Jenkins' @ 72.249.127.135

\begin{tabular}{lllllllll}
\hline
Summary of computational transaction \tabularnewline
Raw Input & view raw input (R code)  \tabularnewline
Raw Output & view raw output of R engine  \tabularnewline
Computing time & 2 seconds \tabularnewline
R Server & 'Gwilym Jenkins' @ 72.249.127.135 \tabularnewline
\hline
\end{tabular}
%Source: https://freestatistics.org/blog/index.php?pk=68265&T=0

[TABLE]
[ROW][C]Summary of computational transaction[/C][/ROW]
[ROW][C]Raw Input[/C][C]view raw input (R code) [/C][/ROW]
[ROW][C]Raw Output[/C][C]view raw output of R engine [/C][/ROW]
[ROW][C]Computing time[/C][C]2 seconds[/C][/ROW]
[ROW][C]R Server[/C][C]'Gwilym Jenkins' @ 72.249.127.135[/C][/ROW]
[/TABLE]
Source: https://freestatistics.org/blog/index.php?pk=68265&T=0

Globally Unique Identifier (entire table): ba.freestatistics.org/blog/index.php?pk=68265&T=0

As an alternative you can also use a QR Code:  

The GUIDs for individual cells are displayed in the table below:

Summary of computational transaction
Raw Inputview raw input (R code)
Raw Outputview raw output of R engine
Computing time2 seconds
R Server'Gwilym Jenkins' @ 72.249.127.135


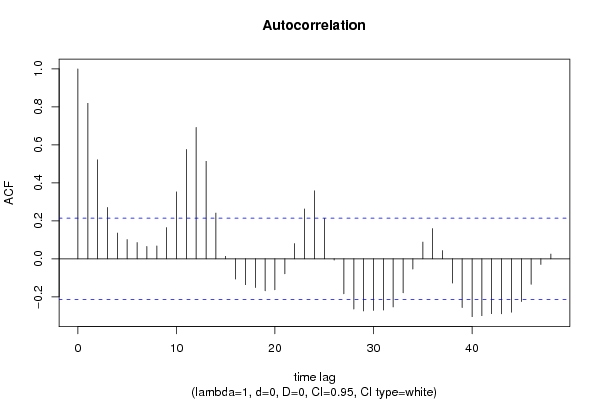
Autocorrelation Function
Time lag kACF(k)T-STATP-value
10.8191047.50720
20.5216464.7814e-06
30.2707382.48140.007541
40.135331.24030.109156
50.1010590.92620.178492
60.0857020.78550.217195
70.0652230.59780.275798
80.0676230.61980.268543
90.1641971.50490.068051
100.3524683.23040.000883
110.5760465.27950
120.6921976.34410
130.5137824.70895e-06
140.2410492.20930.01494
150.0130760.11980.452448
16-0.106962-0.98030.16487
17-0.136528-1.25130.10715
18-0.151368-1.38730.084509
19-0.168807-1.54710.062794
20-0.163247-1.49620.069176
21-0.078961-0.72370.235634
220.0803380.73630.231796
230.2625782.40660.009148
240.3579733.28090.000754
250.212381.94650.027469
26-0.006871-0.0630.474968
27-0.184709-1.69290.047091
28-0.264825-2.42720.008677
29-0.27492-2.51970.00682
30-0.27205-2.49340.007308
31-0.270102-2.47550.007656
32-0.253621-2.32450.011257
33-0.179058-1.64110.052259
34-0.053848-0.49350.311466
350.0879720.80630.211181
360.1592431.45950.074081
370.0433540.39730.346059
38-0.12799-1.1730.122046
39-0.25688-2.35430.010444
40-0.304819-2.79370.003226
41-0.299588-2.74580.003691
42-0.288929-2.64810.004833
43-0.289937-2.65730.004713
44-0.281054-2.57590.005874
45-0.225592-2.06760.020878
46-0.134416-1.23190.110704
47-0.030088-0.27580.391703
480.024990.2290.409698

\begin{tabular}{lllllllll}
\hline
Autocorrelation Function \tabularnewline
Time lag k & ACF(k) & T-STAT & P-value \tabularnewline
1 & 0.819104 & 7.5072 & 0 \tabularnewline
2 & 0.521646 & 4.781 & 4e-06 \tabularnewline
3 & 0.270738 & 2.4814 & 0.007541 \tabularnewline
4 & 0.13533 & 1.2403 & 0.109156 \tabularnewline
5 & 0.101059 & 0.9262 & 0.178492 \tabularnewline
6 & 0.085702 & 0.7855 & 0.217195 \tabularnewline
7 & 0.065223 & 0.5978 & 0.275798 \tabularnewline
8 & 0.067623 & 0.6198 & 0.268543 \tabularnewline
9 & 0.164197 & 1.5049 & 0.068051 \tabularnewline
10 & 0.352468 & 3.2304 & 0.000883 \tabularnewline
11 & 0.576046 & 5.2795 & 0 \tabularnewline
12 & 0.692197 & 6.3441 & 0 \tabularnewline
13 & 0.513782 & 4.7089 & 5e-06 \tabularnewline
14 & 0.241049 & 2.2093 & 0.01494 \tabularnewline
15 & 0.013076 & 0.1198 & 0.452448 \tabularnewline
16 & -0.106962 & -0.9803 & 0.16487 \tabularnewline
17 & -0.136528 & -1.2513 & 0.10715 \tabularnewline
18 & -0.151368 & -1.3873 & 0.084509 \tabularnewline
19 & -0.168807 & -1.5471 & 0.062794 \tabularnewline
20 & -0.163247 & -1.4962 & 0.069176 \tabularnewline
21 & -0.078961 & -0.7237 & 0.235634 \tabularnewline
22 & 0.080338 & 0.7363 & 0.231796 \tabularnewline
23 & 0.262578 & 2.4066 & 0.009148 \tabularnewline
24 & 0.357973 & 3.2809 & 0.000754 \tabularnewline
25 & 0.21238 & 1.9465 & 0.027469 \tabularnewline
26 & -0.006871 & -0.063 & 0.474968 \tabularnewline
27 & -0.184709 & -1.6929 & 0.047091 \tabularnewline
28 & -0.264825 & -2.4272 & 0.008677 \tabularnewline
29 & -0.27492 & -2.5197 & 0.00682 \tabularnewline
30 & -0.27205 & -2.4934 & 0.007308 \tabularnewline
31 & -0.270102 & -2.4755 & 0.007656 \tabularnewline
32 & -0.253621 & -2.3245 & 0.011257 \tabularnewline
33 & -0.179058 & -1.6411 & 0.052259 \tabularnewline
34 & -0.053848 & -0.4935 & 0.311466 \tabularnewline
35 & 0.087972 & 0.8063 & 0.211181 \tabularnewline
36 & 0.159243 & 1.4595 & 0.074081 \tabularnewline
37 & 0.043354 & 0.3973 & 0.346059 \tabularnewline
38 & -0.12799 & -1.173 & 0.122046 \tabularnewline
39 & -0.25688 & -2.3543 & 0.010444 \tabularnewline
40 & -0.304819 & -2.7937 & 0.003226 \tabularnewline
41 & -0.299588 & -2.7458 & 0.003691 \tabularnewline
42 & -0.288929 & -2.6481 & 0.004833 \tabularnewline
43 & -0.289937 & -2.6573 & 0.004713 \tabularnewline
44 & -0.281054 & -2.5759 & 0.005874 \tabularnewline
45 & -0.225592 & -2.0676 & 0.020878 \tabularnewline
46 & -0.134416 & -1.2319 & 0.110704 \tabularnewline
47 & -0.030088 & -0.2758 & 0.391703 \tabularnewline
48 & 0.02499 & 0.229 & 0.409698 \tabularnewline
\hline
\end{tabular}
%Source: https://freestatistics.org/blog/index.php?pk=68265&T=1

[TABLE]
[ROW][C]Autocorrelation Function[/C][/ROW]
[ROW][C]Time lag k[/C][C]ACF(k)[/C][C]T-STAT[/C][C]P-value[/C][/ROW]
[ROW][C]1[/C][C]0.819104[/C][C]7.5072[/C][C]0[/C][/ROW]
[ROW][C]2[/C][C]0.521646[/C][C]4.781[/C][C]4e-06[/C][/ROW]
[ROW][C]3[/C][C]0.270738[/C][C]2.4814[/C][C]0.007541[/C][/ROW]
[ROW][C]4[/C][C]0.13533[/C][C]1.2403[/C][C]0.109156[/C][/ROW]
[ROW][C]5[/C][C]0.101059[/C][C]0.9262[/C][C]0.178492[/C][/ROW]
[ROW][C]6[/C][C]0.085702[/C][C]0.7855[/C][C]0.217195[/C][/ROW]
[ROW][C]7[/C][C]0.065223[/C][C]0.5978[/C][C]0.275798[/C][/ROW]
[ROW][C]8[/C][C]0.067623[/C][C]0.6198[/C][C]0.268543[/C][/ROW]
[ROW][C]9[/C][C]0.164197[/C][C]1.5049[/C][C]0.068051[/C][/ROW]
[ROW][C]10[/C][C]0.352468[/C][C]3.2304[/C][C]0.000883[/C][/ROW]
[ROW][C]11[/C][C]0.576046[/C][C]5.2795[/C][C]0[/C][/ROW]
[ROW][C]12[/C][C]0.692197[/C][C]6.3441[/C][C]0[/C][/ROW]
[ROW][C]13[/C][C]0.513782[/C][C]4.7089[/C][C]5e-06[/C][/ROW]
[ROW][C]14[/C][C]0.241049[/C][C]2.2093[/C][C]0.01494[/C][/ROW]
[ROW][C]15[/C][C]0.013076[/C][C]0.1198[/C][C]0.452448[/C][/ROW]
[ROW][C]16[/C][C]-0.106962[/C][C]-0.9803[/C][C]0.16487[/C][/ROW]
[ROW][C]17[/C][C]-0.136528[/C][C]-1.2513[/C][C]0.10715[/C][/ROW]
[ROW][C]18[/C][C]-0.151368[/C][C]-1.3873[/C][C]0.084509[/C][/ROW]
[ROW][C]19[/C][C]-0.168807[/C][C]-1.5471[/C][C]0.062794[/C][/ROW]
[ROW][C]20[/C][C]-0.163247[/C][C]-1.4962[/C][C]0.069176[/C][/ROW]
[ROW][C]21[/C][C]-0.078961[/C][C]-0.7237[/C][C]0.235634[/C][/ROW]
[ROW][C]22[/C][C]0.080338[/C][C]0.7363[/C][C]0.231796[/C][/ROW]
[ROW][C]23[/C][C]0.262578[/C][C]2.4066[/C][C]0.009148[/C][/ROW]
[ROW][C]24[/C][C]0.357973[/C][C]3.2809[/C][C]0.000754[/C][/ROW]
[ROW][C]25[/C][C]0.21238[/C][C]1.9465[/C][C]0.027469[/C][/ROW]
[ROW][C]26[/C][C]-0.006871[/C][C]-0.063[/C][C]0.474968[/C][/ROW]
[ROW][C]27[/C][C]-0.184709[/C][C]-1.6929[/C][C]0.047091[/C][/ROW]
[ROW][C]28[/C][C]-0.264825[/C][C]-2.4272[/C][C]0.008677[/C][/ROW]
[ROW][C]29[/C][C]-0.27492[/C][C]-2.5197[/C][C]0.00682[/C][/ROW]
[ROW][C]30[/C][C]-0.27205[/C][C]-2.4934[/C][C]0.007308[/C][/ROW]
[ROW][C]31[/C][C]-0.270102[/C][C]-2.4755[/C][C]0.007656[/C][/ROW]
[ROW][C]32[/C][C]-0.253621[/C][C]-2.3245[/C][C]0.011257[/C][/ROW]
[ROW][C]33[/C][C]-0.179058[/C][C]-1.6411[/C][C]0.052259[/C][/ROW]
[ROW][C]34[/C][C]-0.053848[/C][C]-0.4935[/C][C]0.311466[/C][/ROW]
[ROW][C]35[/C][C]0.087972[/C][C]0.8063[/C][C]0.211181[/C][/ROW]
[ROW][C]36[/C][C]0.159243[/C][C]1.4595[/C][C]0.074081[/C][/ROW]
[ROW][C]37[/C][C]0.043354[/C][C]0.3973[/C][C]0.346059[/C][/ROW]
[ROW][C]38[/C][C]-0.12799[/C][C]-1.173[/C][C]0.122046[/C][/ROW]
[ROW][C]39[/C][C]-0.25688[/C][C]-2.3543[/C][C]0.010444[/C][/ROW]
[ROW][C]40[/C][C]-0.304819[/C][C]-2.7937[/C][C]0.003226[/C][/ROW]
[ROW][C]41[/C][C]-0.299588[/C][C]-2.7458[/C][C]0.003691[/C][/ROW]
[ROW][C]42[/C][C]-0.288929[/C][C]-2.6481[/C][C]0.004833[/C][/ROW]
[ROW][C]43[/C][C]-0.289937[/C][C]-2.6573[/C][C]0.004713[/C][/ROW]
[ROW][C]44[/C][C]-0.281054[/C][C]-2.5759[/C][C]0.005874[/C][/ROW]
[ROW][C]45[/C][C]-0.225592[/C][C]-2.0676[/C][C]0.020878[/C][/ROW]
[ROW][C]46[/C][C]-0.134416[/C][C]-1.2319[/C][C]0.110704[/C][/ROW]
[ROW][C]47[/C][C]-0.030088[/C][C]-0.2758[/C][C]0.391703[/C][/ROW]
[ROW][C]48[/C][C]0.02499[/C][C]0.229[/C][C]0.409698[/C][/ROW]
[/TABLE]
Source: https://freestatistics.org/blog/index.php?pk=68265&T=1

Globally Unique Identifier (entire table): ba.freestatistics.org/blog/index.php?pk=68265&T=1

As an alternative you can also use a QR Code:  

The GUIDs for individual cells are displayed in the table below:

Autocorrelation Function
Time lag kACF(k)T-STATP-value
10.8191047.50720
20.5216464.7814e-06
30.2707382.48140.007541
40.135331.24030.109156
50.1010590.92620.178492
60.0857020.78550.217195
70.0652230.59780.275798
80.0676230.61980.268543
90.1641971.50490.068051
100.3524683.23040.000883
110.5760465.27950
120.6921976.34410
130.5137824.70895e-06
140.2410492.20930.01494
150.0130760.11980.452448
16-0.106962-0.98030.16487
17-0.136528-1.25130.10715
18-0.151368-1.38730.084509
19-0.168807-1.54710.062794
20-0.163247-1.49620.069176
21-0.078961-0.72370.235634
220.0803380.73630.231796
230.2625782.40660.009148
240.3579733.28090.000754
250.212381.94650.027469
26-0.006871-0.0630.474968
27-0.184709-1.69290.047091
28-0.264825-2.42720.008677
29-0.27492-2.51970.00682
30-0.27205-2.49340.007308
31-0.270102-2.47550.007656
32-0.253621-2.32450.011257
33-0.179058-1.64110.052259
34-0.053848-0.49350.311466
350.0879720.80630.211181
360.1592431.45950.074081
370.0433540.39730.346059
38-0.12799-1.1730.122046
39-0.25688-2.35430.010444
40-0.304819-2.79370.003226
41-0.299588-2.74580.003691
42-0.288929-2.64810.004833
43-0.289937-2.65730.004713
44-0.281054-2.57590.005874
45-0.225592-2.06760.020878
46-0.134416-1.23190.110704
47-0.030088-0.27580.391703
480.024990.2290.409698


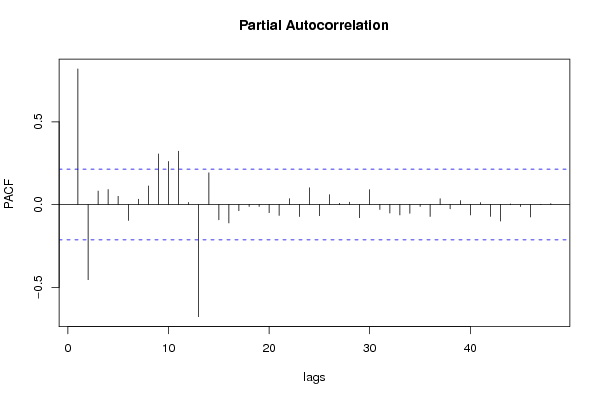
Partial Autocorrelation Function
Time lag kPACF(k)T-STATP-value
10.8191047.50720
2-0.453658-4.15783.9e-05
30.0811530.74380.229544
40.0908170.83230.203787
50.0497980.45640.324638
6-0.095967-0.87960.190805
70.0320270.29350.384919
80.1123381.02960.153078
90.3057252.8020.003152
100.2601372.38420.009685
110.3220722.95180.002047
120.0124460.11410.454727
13-0.677333-6.20790
140.1919131.75890.041117
15-0.092164-0.84470.20034
16-0.111463-1.02160.154957
17-0.037201-0.3410.366994
18-0.011663-0.10690.457565
19-0.01145-0.10490.458336
20-0.049066-0.44970.327043
21-0.065524-0.60050.274883
220.035510.32550.372824
23-0.073043-0.66950.252521
240.1010820.92640.178437
25-0.067541-0.6190.268788
260.059160.54220.294553
270.0076370.070.472184
280.0138980.12740.449472
29-0.079449-0.72820.234271
300.0894820.82010.207235
31-0.029411-0.26960.39408
32-0.051637-0.47330.318627
33-0.062909-0.57660.282887
34-0.053382-0.48930.312967
35-0.011286-0.10340.458929
36-0.072011-0.660.255532
370.0353740.32420.373292
38-0.025746-0.2360.407018
390.0236750.2170.414374
40-0.062516-0.5730.284098
410.0122080.11190.455588
42-0.071736-0.65750.256338
43-0.099508-0.9120.182187
440.0034080.03120.487579
45-0.012442-0.1140.454743
46-0.074851-0.6860.247293
470.0011180.01020.495925
480.0054960.05040.479974

\begin{tabular}{lllllllll}
\hline
Partial Autocorrelation Function \tabularnewline
Time lag k & PACF(k) & T-STAT & P-value \tabularnewline
1 & 0.819104 & 7.5072 & 0 \tabularnewline
2 & -0.453658 & -4.1578 & 3.9e-05 \tabularnewline
3 & 0.081153 & 0.7438 & 0.229544 \tabularnewline
4 & 0.090817 & 0.8323 & 0.203787 \tabularnewline
5 & 0.049798 & 0.4564 & 0.324638 \tabularnewline
6 & -0.095967 & -0.8796 & 0.190805 \tabularnewline
7 & 0.032027 & 0.2935 & 0.384919 \tabularnewline
8 & 0.112338 & 1.0296 & 0.153078 \tabularnewline
9 & 0.305725 & 2.802 & 0.003152 \tabularnewline
10 & 0.260137 & 2.3842 & 0.009685 \tabularnewline
11 & 0.322072 & 2.9518 & 0.002047 \tabularnewline
12 & 0.012446 & 0.1141 & 0.454727 \tabularnewline
13 & -0.677333 & -6.2079 & 0 \tabularnewline
14 & 0.191913 & 1.7589 & 0.041117 \tabularnewline
15 & -0.092164 & -0.8447 & 0.20034 \tabularnewline
16 & -0.111463 & -1.0216 & 0.154957 \tabularnewline
17 & -0.037201 & -0.341 & 0.366994 \tabularnewline
18 & -0.011663 & -0.1069 & 0.457565 \tabularnewline
19 & -0.01145 & -0.1049 & 0.458336 \tabularnewline
20 & -0.049066 & -0.4497 & 0.327043 \tabularnewline
21 & -0.065524 & -0.6005 & 0.274883 \tabularnewline
22 & 0.03551 & 0.3255 & 0.372824 \tabularnewline
23 & -0.073043 & -0.6695 & 0.252521 \tabularnewline
24 & 0.101082 & 0.9264 & 0.178437 \tabularnewline
25 & -0.067541 & -0.619 & 0.268788 \tabularnewline
26 & 0.05916 & 0.5422 & 0.294553 \tabularnewline
27 & 0.007637 & 0.07 & 0.472184 \tabularnewline
28 & 0.013898 & 0.1274 & 0.449472 \tabularnewline
29 & -0.079449 & -0.7282 & 0.234271 \tabularnewline
30 & 0.089482 & 0.8201 & 0.207235 \tabularnewline
31 & -0.029411 & -0.2696 & 0.39408 \tabularnewline
32 & -0.051637 & -0.4733 & 0.318627 \tabularnewline
33 & -0.062909 & -0.5766 & 0.282887 \tabularnewline
34 & -0.053382 & -0.4893 & 0.312967 \tabularnewline
35 & -0.011286 & -0.1034 & 0.458929 \tabularnewline
36 & -0.072011 & -0.66 & 0.255532 \tabularnewline
37 & 0.035374 & 0.3242 & 0.373292 \tabularnewline
38 & -0.025746 & -0.236 & 0.407018 \tabularnewline
39 & 0.023675 & 0.217 & 0.414374 \tabularnewline
40 & -0.062516 & -0.573 & 0.284098 \tabularnewline
41 & 0.012208 & 0.1119 & 0.455588 \tabularnewline
42 & -0.071736 & -0.6575 & 0.256338 \tabularnewline
43 & -0.099508 & -0.912 & 0.182187 \tabularnewline
44 & 0.003408 & 0.0312 & 0.487579 \tabularnewline
45 & -0.012442 & -0.114 & 0.454743 \tabularnewline
46 & -0.074851 & -0.686 & 0.247293 \tabularnewline
47 & 0.001118 & 0.0102 & 0.495925 \tabularnewline
48 & 0.005496 & 0.0504 & 0.479974 \tabularnewline
\hline
\end{tabular}
%Source: https://freestatistics.org/blog/index.php?pk=68265&T=2

[TABLE]
[ROW][C]Partial Autocorrelation Function[/C][/ROW]
[ROW][C]Time lag k[/C][C]PACF(k)[/C][C]T-STAT[/C][C]P-value[/C][/ROW]
[ROW][C]1[/C][C]0.819104[/C][C]7.5072[/C][C]0[/C][/ROW]
[ROW][C]2[/C][C]-0.453658[/C][C]-4.1578[/C][C]3.9e-05[/C][/ROW]
[ROW][C]3[/C][C]0.081153[/C][C]0.7438[/C][C]0.229544[/C][/ROW]
[ROW][C]4[/C][C]0.090817[/C][C]0.8323[/C][C]0.203787[/C][/ROW]
[ROW][C]5[/C][C]0.049798[/C][C]0.4564[/C][C]0.324638[/C][/ROW]
[ROW][C]6[/C][C]-0.095967[/C][C]-0.8796[/C][C]0.190805[/C][/ROW]
[ROW][C]7[/C][C]0.032027[/C][C]0.2935[/C][C]0.384919[/C][/ROW]
[ROW][C]8[/C][C]0.112338[/C][C]1.0296[/C][C]0.153078[/C][/ROW]
[ROW][C]9[/C][C]0.305725[/C][C]2.802[/C][C]0.003152[/C][/ROW]
[ROW][C]10[/C][C]0.260137[/C][C]2.3842[/C][C]0.009685[/C][/ROW]
[ROW][C]11[/C][C]0.322072[/C][C]2.9518[/C][C]0.002047[/C][/ROW]
[ROW][C]12[/C][C]0.012446[/C][C]0.1141[/C][C]0.454727[/C][/ROW]
[ROW][C]13[/C][C]-0.677333[/C][C]-6.2079[/C][C]0[/C][/ROW]
[ROW][C]14[/C][C]0.191913[/C][C]1.7589[/C][C]0.041117[/C][/ROW]
[ROW][C]15[/C][C]-0.092164[/C][C]-0.8447[/C][C]0.20034[/C][/ROW]
[ROW][C]16[/C][C]-0.111463[/C][C]-1.0216[/C][C]0.154957[/C][/ROW]
[ROW][C]17[/C][C]-0.037201[/C][C]-0.341[/C][C]0.366994[/C][/ROW]
[ROW][C]18[/C][C]-0.011663[/C][C]-0.1069[/C][C]0.457565[/C][/ROW]
[ROW][C]19[/C][C]-0.01145[/C][C]-0.1049[/C][C]0.458336[/C][/ROW]
[ROW][C]20[/C][C]-0.049066[/C][C]-0.4497[/C][C]0.327043[/C][/ROW]
[ROW][C]21[/C][C]-0.065524[/C][C]-0.6005[/C][C]0.274883[/C][/ROW]
[ROW][C]22[/C][C]0.03551[/C][C]0.3255[/C][C]0.372824[/C][/ROW]
[ROW][C]23[/C][C]-0.073043[/C][C]-0.6695[/C][C]0.252521[/C][/ROW]
[ROW][C]24[/C][C]0.101082[/C][C]0.9264[/C][C]0.178437[/C][/ROW]
[ROW][C]25[/C][C]-0.067541[/C][C]-0.619[/C][C]0.268788[/C][/ROW]
[ROW][C]26[/C][C]0.05916[/C][C]0.5422[/C][C]0.294553[/C][/ROW]
[ROW][C]27[/C][C]0.007637[/C][C]0.07[/C][C]0.472184[/C][/ROW]
[ROW][C]28[/C][C]0.013898[/C][C]0.1274[/C][C]0.449472[/C][/ROW]
[ROW][C]29[/C][C]-0.079449[/C][C]-0.7282[/C][C]0.234271[/C][/ROW]
[ROW][C]30[/C][C]0.089482[/C][C]0.8201[/C][C]0.207235[/C][/ROW]
[ROW][C]31[/C][C]-0.029411[/C][C]-0.2696[/C][C]0.39408[/C][/ROW]
[ROW][C]32[/C][C]-0.051637[/C][C]-0.4733[/C][C]0.318627[/C][/ROW]
[ROW][C]33[/C][C]-0.062909[/C][C]-0.5766[/C][C]0.282887[/C][/ROW]
[ROW][C]34[/C][C]-0.053382[/C][C]-0.4893[/C][C]0.312967[/C][/ROW]
[ROW][C]35[/C][C]-0.011286[/C][C]-0.1034[/C][C]0.458929[/C][/ROW]
[ROW][C]36[/C][C]-0.072011[/C][C]-0.66[/C][C]0.255532[/C][/ROW]
[ROW][C]37[/C][C]0.035374[/C][C]0.3242[/C][C]0.373292[/C][/ROW]
[ROW][C]38[/C][C]-0.025746[/C][C]-0.236[/C][C]0.407018[/C][/ROW]
[ROW][C]39[/C][C]0.023675[/C][C]0.217[/C][C]0.414374[/C][/ROW]
[ROW][C]40[/C][C]-0.062516[/C][C]-0.573[/C][C]0.284098[/C][/ROW]
[ROW][C]41[/C][C]0.012208[/C][C]0.1119[/C][C]0.455588[/C][/ROW]
[ROW][C]42[/C][C]-0.071736[/C][C]-0.6575[/C][C]0.256338[/C][/ROW]
[ROW][C]43[/C][C]-0.099508[/C][C]-0.912[/C][C]0.182187[/C][/ROW]
[ROW][C]44[/C][C]0.003408[/C][C]0.0312[/C][C]0.487579[/C][/ROW]
[ROW][C]45[/C][C]-0.012442[/C][C]-0.114[/C][C]0.454743[/C][/ROW]
[ROW][C]46[/C][C]-0.074851[/C][C]-0.686[/C][C]0.247293[/C][/ROW]
[ROW][C]47[/C][C]0.001118[/C][C]0.0102[/C][C]0.495925[/C][/ROW]
[ROW][C]48[/C][C]0.005496[/C][C]0.0504[/C][C]0.479974[/C][/ROW]
[/TABLE]
Source: https://freestatistics.org/blog/index.php?pk=68265&T=2

Globally Unique Identifier (entire table): ba.freestatistics.org/blog/index.php?pk=68265&T=2

As an alternative you can also use a QR Code:  

The GUIDs for individual cells are displayed in the table below:

Partial Autocorrelation Function
Time lag kPACF(k)T-STATP-value
10.8191047.50720
2-0.453658-4.15783.9e-05
30.0811530.74380.229544
40.0908170.83230.203787
50.0497980.45640.324638
6-0.095967-0.87960.190805
70.0320270.29350.384919
80.1123381.02960.153078
90.3057252.8020.003152
100.2601372.38420.009685
110.3220722.95180.002047
120.0124460.11410.454727
13-0.677333-6.20790
140.1919131.75890.041117
15-0.092164-0.84470.20034
16-0.111463-1.02160.154957
17-0.037201-0.3410.366994
18-0.011663-0.10690.457565
19-0.01145-0.10490.458336
20-0.049066-0.44970.327043
21-0.065524-0.60050.274883
220.035510.32550.372824
23-0.073043-0.66950.252521
240.1010820.92640.178437
25-0.067541-0.6190.268788
260.059160.54220.294553
270.0076370.070.472184
280.0138980.12740.449472
29-0.079449-0.72820.234271
300.0894820.82010.207235
31-0.029411-0.26960.39408
32-0.051637-0.47330.318627
33-0.062909-0.57660.282887
34-0.053382-0.48930.312967
35-0.011286-0.10340.458929
36-0.072011-0.660.255532
370.0353740.32420.373292
38-0.025746-0.2360.407018
390.0236750.2170.414374
40-0.062516-0.5730.284098
410.0122080.11190.455588
42-0.071736-0.65750.256338
43-0.099508-0.9120.182187
440.0034080.03120.487579
45-0.012442-0.1140.454743
46-0.074851-0.6860.247293
470.0011180.01020.495925
480.0054960.05040.479974


Parameters (Session):
par1 = 48 ; par2 = 1 ; par3 = 0 ; par4 = 0 ; par5 = 12 ; par6 = White Noise ; par7 = 0.95 ;
Parameters (R input):
par1 = 48 ; par2 = 1 ; par3 = 0 ; par4 = 0 ; par5 = 12 ; par6 = White Noise ; par7 = 0.95 ;
R code (references can be found in the software module):
if (par1 == 'Default') {
par1 = 10*log10(length(x))
} else {
par1 <- as.numeric(par1)
}
par2 <- as.numeric(par2)
par3 <- as.numeric(par3)
par4 <- as.numeric(par4)
par5 <- as.numeric(par5)
if (par6 == 'White Noise') par6 <- 'white' else par6 <- 'ma'
par7 <- as.numeric(par7)
if (par2 == 0) {
x <- log(x)
} else {
x <- (x ^ par2 - 1) / par2
}
if (par3 > 0) x <- diff(x,lag=1,difference=par3)
if (par4 > 0) x <- diff(x,lag=par5,difference=par4)
bitmap(file='pic1.png')
racf <- acf(x, par1, main='Autocorrelation', xlab='time lag', ylab='ACF', ci.type=par6, ci=par7, sub=paste('(lambda=',par2,', d=',par3,', D=',par4,', CI=', par7, ', CI type=',par6,')',sep=''))
dev.off()
bitmap(file='pic2.png')
rpacf <- pacf(x,par1,main='Partial Autocorrelation',xlab='lags',ylab='PACF')
dev.off()
(myacf <- c(racf$acf))
(mypacf <- c(rpacf$acf))
lengthx <- length(x)
sqrtn <- sqrt(lengthx)
load(file='createtable')
a<-table.start()
a<-table.row.start(a)
a<-table.element(a,'Autocorrelation Function',4,TRUE)
a<-table.row.end(a)
a<-table.row.start(a)
a<-table.element(a,'Time lag k',header=TRUE)
a<-table.element(a,hyperlink('basics.htm','ACF(k)','click here for more information about the Autocorrelation Function'),header=TRUE)
a<-table.element(a,'T-STAT',header=TRUE)
a<-table.element(a,'P-value',header=TRUE)
a<-table.row.end(a)
for (i in 2:(par1+1)) {
a<-table.row.start(a)
a<-table.element(a,i-1,header=TRUE)
a<-table.element(a,round(myacf[i],6))
mytstat <- myacf[i]*sqrtn
a<-table.element(a,round(mytstat,4))
a<-table.element(a,round(1-pt(abs(mytstat),lengthx),6))
a<-table.row.end(a)
}
a<-table.end(a)
table.save(a,file='mytable.tab')
a<-table.start()
a<-table.row.start(a)
a<-table.element(a,'Partial Autocorrelation Function',4,TRUE)
a<-table.row.end(a)
a<-table.row.start(a)
a<-table.element(a,'Time lag k',header=TRUE)
a<-table.element(a,hyperlink('basics.htm','PACF(k)','click here for more information about the Partial Autocorrelation Function'),header=TRUE)
a<-table.element(a,'T-STAT',header=TRUE)
a<-table.element(a,'P-value',header=TRUE)
a<-table.row.end(a)
for (i in 1:par1) {
a<-table.row.start(a)
a<-table.element(a,i,header=TRUE)
a<-table.element(a,round(mypacf[i],6))
mytstat <- mypacf[i]*sqrtn
a<-table.element(a,round(mytstat,4))
a<-table.element(a,round(1-pt(abs(mytstat),lengthx),6))
a<-table.row.end(a)
}
a<-table.end(a)
table.save(a,file='mytable1.tab')