Free Statistics

of Irreproducible Research!

Author's title

Author*The author of this computation has been verified*
R Software Modulerwasp_autocorrelation.wasp
Title produced by software(Partial) Autocorrelation Function
Date of computationTue, 15 Dec 2009 19:57:09 -0700
Cite this page as followsStatistical Computations at FreeStatistics.org, Office for Research Development and Education, URL https://freestatistics.org/blog/index.php?v=date/2009/Dec/16/t1260932277ed9mkwm31xu0ipx.htm/, Retrieved Tue, 30 Apr 2024 20:16:09 +0000
Statistical Computations at FreeStatistics.org, Office for Research Development and Education, URL https://freestatistics.org/blog/index.php?pk=68219, Retrieved Tue, 30 Apr 2024 20:16:09 +0000
QR Codes:

Original text written by user:
IsPrivate?No (this computation is public)
User-defined keywords
Estimated Impact151
Family? (F = Feedback message, R = changed R code, M = changed R Module, P = changed Parameters, D = changed Data)
-     [(Partial) Autocorrelation Function] [Shwws9_v1] [2009-12-09 17:40:43] [5f89c040fdf1f8599c99d7f78a662321]
-   PD  [(Partial) Autocorrelation Function] [Shwws9_v1] [2009-12-11 15:41:35] [5f89c040fdf1f8599c99d7f78a662321]
-   PD      [(Partial) Autocorrelation Function] [Paper] [2009-12-16 02:57:09] [93b66894f6318f3da4fcda772f2ffa6f] [Current]
-   PD        [(Partial) Autocorrelation Function] [Paper] [2009-12-16 03:20:14] [5f89c040fdf1f8599c99d7f78a662321]
-   PD        [(Partial) Autocorrelation Function] [Paper] [2009-12-16 03:22:45] [5f89c040fdf1f8599c99d7f78a662321]
Feedback Forum

Post a new message
Dataseries X:
102.1
102.86
102.99
103.73
105.02
104.43
104.63
104.93
105.87
105.66
106.76
106
107.22
107.33
107.11
108.86
107.72
107.88
108.38
107.72
108.41
109.9
111.45
112.18
113.34
113.46
114.06
115.54
116.39
115.94
116.97
115.94
115.91
116.43
116.26
116.35
117.9
117.7
117.53
117.86
117.65
116.51
115.93
115.31
115
115.45
115.83


Summary of computational transaction
Raw Inputview raw input (R code)
Raw Outputview raw output of R engine
Computing time1 seconds
R Server'Gwilym Jenkins' @ 72.249.127.135

\begin{tabular}{lllllllll}
\hline
Summary of computational transaction \tabularnewline
Raw Input & view raw input (R code)  \tabularnewline
Raw Output & view raw output of R engine  \tabularnewline
Computing time & 1 seconds \tabularnewline
R Server & 'Gwilym Jenkins' @ 72.249.127.135 \tabularnewline
\hline
\end{tabular}
%Source: https://freestatistics.org/blog/index.php?pk=68219&T=0

[TABLE]
[ROW][C]Summary of computational transaction[/C][/ROW]
[ROW][C]Raw Input[/C][C]view raw input (R code) [/C][/ROW]
[ROW][C]Raw Output[/C][C]view raw output of R engine [/C][/ROW]
[ROW][C]Computing time[/C][C]1 seconds[/C][/ROW]
[ROW][C]R Server[/C][C]'Gwilym Jenkins' @ 72.249.127.135[/C][/ROW]
[/TABLE]
Source: https://freestatistics.org/blog/index.php?pk=68219&T=0

Globally Unique Identifier (entire table): ba.freestatistics.org/blog/index.php?pk=68219&T=0

As an alternative you can also use a QR Code:  

The GUIDs for individual cells are displayed in the table below:

Summary of computational transaction
Raw Inputview raw input (R code)
Raw Outputview raw output of R engine
Computing time1 seconds
R Server'Gwilym Jenkins' @ 72.249.127.135


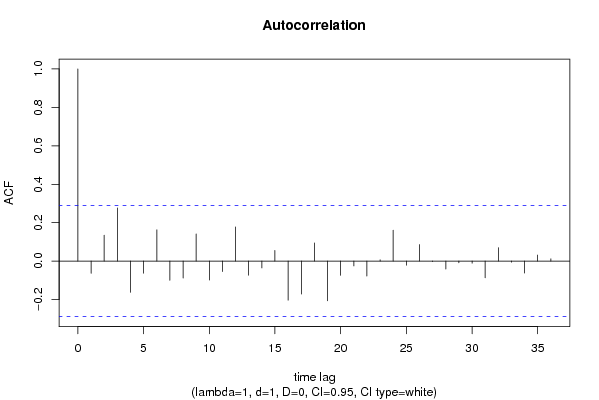
Autocorrelation Function
Time lag kACF(k)T-STATP-value
1-0.063528-0.43090.334289
20.1348390.91450.182605
30.277011.87880.03331
4-0.162285-1.10070.138383
5-0.062827-0.42610.336006
60.1628521.10450.137557
7-0.099902-0.67760.250721
8-0.088287-0.59880.276124
90.1413130.95840.171427
10-0.098645-0.6690.253406
11-0.054259-0.3680.35728
120.1779381.20680.116833
13-0.07355-0.49880.310134
14-0.035776-0.24260.404681
150.0557340.3780.353582
16-0.203257-1.37860.08735
17-0.171607-1.16390.125234
180.094720.64240.261895
19-0.206699-1.40190.083829
20-0.073719-0.50.309734
21-0.024805-0.16820.433567
22-0.077986-0.52890.299701
230.0065320.04430.482428
240.1607891.09050.140581
25-0.021489-0.14570.442379
260.0863640.58570.280454
27-0.002437-0.01650.493441
28-0.041077-0.27860.390902
29-0.009041-0.06130.475686
30-0.010678-0.07240.471291
31-0.086853-0.58910.27935
320.0701980.47610.318126
33-0.005824-0.03950.48433
34-0.061915-0.41990.338245
350.031440.21320.416043
360.0120620.08180.467578

\begin{tabular}{lllllllll}
\hline
Autocorrelation Function \tabularnewline
Time lag k & ACF(k) & T-STAT & P-value \tabularnewline
1 & -0.063528 & -0.4309 & 0.334289 \tabularnewline
2 & 0.134839 & 0.9145 & 0.182605 \tabularnewline
3 & 0.27701 & 1.8788 & 0.03331 \tabularnewline
4 & -0.162285 & -1.1007 & 0.138383 \tabularnewline
5 & -0.062827 & -0.4261 & 0.336006 \tabularnewline
6 & 0.162852 & 1.1045 & 0.137557 \tabularnewline
7 & -0.099902 & -0.6776 & 0.250721 \tabularnewline
8 & -0.088287 & -0.5988 & 0.276124 \tabularnewline
9 & 0.141313 & 0.9584 & 0.171427 \tabularnewline
10 & -0.098645 & -0.669 & 0.253406 \tabularnewline
11 & -0.054259 & -0.368 & 0.35728 \tabularnewline
12 & 0.177938 & 1.2068 & 0.116833 \tabularnewline
13 & -0.07355 & -0.4988 & 0.310134 \tabularnewline
14 & -0.035776 & -0.2426 & 0.404681 \tabularnewline
15 & 0.055734 & 0.378 & 0.353582 \tabularnewline
16 & -0.203257 & -1.3786 & 0.08735 \tabularnewline
17 & -0.171607 & -1.1639 & 0.125234 \tabularnewline
18 & 0.09472 & 0.6424 & 0.261895 \tabularnewline
19 & -0.206699 & -1.4019 & 0.083829 \tabularnewline
20 & -0.073719 & -0.5 & 0.309734 \tabularnewline
21 & -0.024805 & -0.1682 & 0.433567 \tabularnewline
22 & -0.077986 & -0.5289 & 0.299701 \tabularnewline
23 & 0.006532 & 0.0443 & 0.482428 \tabularnewline
24 & 0.160789 & 1.0905 & 0.140581 \tabularnewline
25 & -0.021489 & -0.1457 & 0.442379 \tabularnewline
26 & 0.086364 & 0.5857 & 0.280454 \tabularnewline
27 & -0.002437 & -0.0165 & 0.493441 \tabularnewline
28 & -0.041077 & -0.2786 & 0.390902 \tabularnewline
29 & -0.009041 & -0.0613 & 0.475686 \tabularnewline
30 & -0.010678 & -0.0724 & 0.471291 \tabularnewline
31 & -0.086853 & -0.5891 & 0.27935 \tabularnewline
32 & 0.070198 & 0.4761 & 0.318126 \tabularnewline
33 & -0.005824 & -0.0395 & 0.48433 \tabularnewline
34 & -0.061915 & -0.4199 & 0.338245 \tabularnewline
35 & 0.03144 & 0.2132 & 0.416043 \tabularnewline
36 & 0.012062 & 0.0818 & 0.467578 \tabularnewline
\hline
\end{tabular}
%Source: https://freestatistics.org/blog/index.php?pk=68219&T=1

[TABLE]
[ROW][C]Autocorrelation Function[/C][/ROW]
[ROW][C]Time lag k[/C][C]ACF(k)[/C][C]T-STAT[/C][C]P-value[/C][/ROW]
[ROW][C]1[/C][C]-0.063528[/C][C]-0.4309[/C][C]0.334289[/C][/ROW]
[ROW][C]2[/C][C]0.134839[/C][C]0.9145[/C][C]0.182605[/C][/ROW]
[ROW][C]3[/C][C]0.27701[/C][C]1.8788[/C][C]0.03331[/C][/ROW]
[ROW][C]4[/C][C]-0.162285[/C][C]-1.1007[/C][C]0.138383[/C][/ROW]
[ROW][C]5[/C][C]-0.062827[/C][C]-0.4261[/C][C]0.336006[/C][/ROW]
[ROW][C]6[/C][C]0.162852[/C][C]1.1045[/C][C]0.137557[/C][/ROW]
[ROW][C]7[/C][C]-0.099902[/C][C]-0.6776[/C][C]0.250721[/C][/ROW]
[ROW][C]8[/C][C]-0.088287[/C][C]-0.5988[/C][C]0.276124[/C][/ROW]
[ROW][C]9[/C][C]0.141313[/C][C]0.9584[/C][C]0.171427[/C][/ROW]
[ROW][C]10[/C][C]-0.098645[/C][C]-0.669[/C][C]0.253406[/C][/ROW]
[ROW][C]11[/C][C]-0.054259[/C][C]-0.368[/C][C]0.35728[/C][/ROW]
[ROW][C]12[/C][C]0.177938[/C][C]1.2068[/C][C]0.116833[/C][/ROW]
[ROW][C]13[/C][C]-0.07355[/C][C]-0.4988[/C][C]0.310134[/C][/ROW]
[ROW][C]14[/C][C]-0.035776[/C][C]-0.2426[/C][C]0.404681[/C][/ROW]
[ROW][C]15[/C][C]0.055734[/C][C]0.378[/C][C]0.353582[/C][/ROW]
[ROW][C]16[/C][C]-0.203257[/C][C]-1.3786[/C][C]0.08735[/C][/ROW]
[ROW][C]17[/C][C]-0.171607[/C][C]-1.1639[/C][C]0.125234[/C][/ROW]
[ROW][C]18[/C][C]0.09472[/C][C]0.6424[/C][C]0.261895[/C][/ROW]
[ROW][C]19[/C][C]-0.206699[/C][C]-1.4019[/C][C]0.083829[/C][/ROW]
[ROW][C]20[/C][C]-0.073719[/C][C]-0.5[/C][C]0.309734[/C][/ROW]
[ROW][C]21[/C][C]-0.024805[/C][C]-0.1682[/C][C]0.433567[/C][/ROW]
[ROW][C]22[/C][C]-0.077986[/C][C]-0.5289[/C][C]0.299701[/C][/ROW]
[ROW][C]23[/C][C]0.006532[/C][C]0.0443[/C][C]0.482428[/C][/ROW]
[ROW][C]24[/C][C]0.160789[/C][C]1.0905[/C][C]0.140581[/C][/ROW]
[ROW][C]25[/C][C]-0.021489[/C][C]-0.1457[/C][C]0.442379[/C][/ROW]
[ROW][C]26[/C][C]0.086364[/C][C]0.5857[/C][C]0.280454[/C][/ROW]
[ROW][C]27[/C][C]-0.002437[/C][C]-0.0165[/C][C]0.493441[/C][/ROW]
[ROW][C]28[/C][C]-0.041077[/C][C]-0.2786[/C][C]0.390902[/C][/ROW]
[ROW][C]29[/C][C]-0.009041[/C][C]-0.0613[/C][C]0.475686[/C][/ROW]
[ROW][C]30[/C][C]-0.010678[/C][C]-0.0724[/C][C]0.471291[/C][/ROW]
[ROW][C]31[/C][C]-0.086853[/C][C]-0.5891[/C][C]0.27935[/C][/ROW]
[ROW][C]32[/C][C]0.070198[/C][C]0.4761[/C][C]0.318126[/C][/ROW]
[ROW][C]33[/C][C]-0.005824[/C][C]-0.0395[/C][C]0.48433[/C][/ROW]
[ROW][C]34[/C][C]-0.061915[/C][C]-0.4199[/C][C]0.338245[/C][/ROW]
[ROW][C]35[/C][C]0.03144[/C][C]0.2132[/C][C]0.416043[/C][/ROW]
[ROW][C]36[/C][C]0.012062[/C][C]0.0818[/C][C]0.467578[/C][/ROW]
[/TABLE]
Source: https://freestatistics.org/blog/index.php?pk=68219&T=1

Globally Unique Identifier (entire table): ba.freestatistics.org/blog/index.php?pk=68219&T=1

As an alternative you can also use a QR Code:  

The GUIDs for individual cells are displayed in the table below:

Autocorrelation Function
Time lag kACF(k)T-STATP-value
1-0.063528-0.43090.334289
20.1348390.91450.182605
30.277011.87880.03331
4-0.162285-1.10070.138383
5-0.062827-0.42610.336006
60.1628521.10450.137557
7-0.099902-0.67760.250721
8-0.088287-0.59880.276124
90.1413130.95840.171427
10-0.098645-0.6690.253406
11-0.054259-0.3680.35728
120.1779381.20680.116833
13-0.07355-0.49880.310134
14-0.035776-0.24260.404681
150.0557340.3780.353582
16-0.203257-1.37860.08735
17-0.171607-1.16390.125234
180.094720.64240.261895
19-0.206699-1.40190.083829
20-0.073719-0.50.309734
21-0.024805-0.16820.433567
22-0.077986-0.52890.299701
230.0065320.04430.482428
240.1607891.09050.140581
25-0.021489-0.14570.442379
260.0863640.58570.280454
27-0.002437-0.01650.493441
28-0.041077-0.27860.390902
29-0.009041-0.06130.475686
30-0.010678-0.07240.471291
31-0.086853-0.58910.27935
320.0701980.47610.318126
33-0.005824-0.03950.48433
34-0.061915-0.41990.338245
350.031440.21320.416043
360.0120620.08180.467578


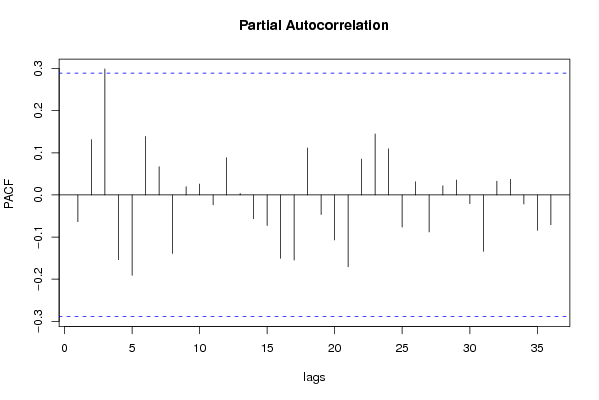
Partial Autocorrelation Function
Time lag kPACF(k)T-STATP-value
1-0.063528-0.43090.334289
20.1313330.89070.18885
30.2991412.02890.024141
4-0.153778-1.0430.151206
5-0.190882-1.29460.100956
60.1389010.94210.175538
70.0671940.45570.325364
8-0.138775-0.94120.175755
90.0195480.13260.447552
100.0259770.17620.43046
11-0.023469-0.15920.437115
120.0883940.59950.275885
130.0036090.02450.490288
14-0.056434-0.38280.351832
15-0.072678-0.49290.312205
16-0.150371-1.01990.156563
17-0.154695-1.04920.149785
180.1112030.75420.227281
19-0.046599-0.31610.376697
20-0.10683-0.72460.236196
21-0.170688-1.15770.126488
220.0852370.57810.283007
230.1449620.98320.165332
240.1094130.74210.230907
25-0.076147-0.51650.304005
260.0311830.21150.416718
27-0.087753-0.59520.277324
280.0216630.14690.441916
290.0353980.24010.405666
30-0.020854-0.14140.44407
31-0.133985-0.90870.184115
320.0325420.22070.413147
330.0371190.25180.401176
34-0.021378-0.1450.442674
35-0.083939-0.56930.285961
36-0.070568-0.47860.31724

\begin{tabular}{lllllllll}
\hline
Partial Autocorrelation Function \tabularnewline
Time lag k & PACF(k) & T-STAT & P-value \tabularnewline
1 & -0.063528 & -0.4309 & 0.334289 \tabularnewline
2 & 0.131333 & 0.8907 & 0.18885 \tabularnewline
3 & 0.299141 & 2.0289 & 0.024141 \tabularnewline
4 & -0.153778 & -1.043 & 0.151206 \tabularnewline
5 & -0.190882 & -1.2946 & 0.100956 \tabularnewline
6 & 0.138901 & 0.9421 & 0.175538 \tabularnewline
7 & 0.067194 & 0.4557 & 0.325364 \tabularnewline
8 & -0.138775 & -0.9412 & 0.175755 \tabularnewline
9 & 0.019548 & 0.1326 & 0.447552 \tabularnewline
10 & 0.025977 & 0.1762 & 0.43046 \tabularnewline
11 & -0.023469 & -0.1592 & 0.437115 \tabularnewline
12 & 0.088394 & 0.5995 & 0.275885 \tabularnewline
13 & 0.003609 & 0.0245 & 0.490288 \tabularnewline
14 & -0.056434 & -0.3828 & 0.351832 \tabularnewline
15 & -0.072678 & -0.4929 & 0.312205 \tabularnewline
16 & -0.150371 & -1.0199 & 0.156563 \tabularnewline
17 & -0.154695 & -1.0492 & 0.149785 \tabularnewline
18 & 0.111203 & 0.7542 & 0.227281 \tabularnewline
19 & -0.046599 & -0.3161 & 0.376697 \tabularnewline
20 & -0.10683 & -0.7246 & 0.236196 \tabularnewline
21 & -0.170688 & -1.1577 & 0.126488 \tabularnewline
22 & 0.085237 & 0.5781 & 0.283007 \tabularnewline
23 & 0.144962 & 0.9832 & 0.165332 \tabularnewline
24 & 0.109413 & 0.7421 & 0.230907 \tabularnewline
25 & -0.076147 & -0.5165 & 0.304005 \tabularnewline
26 & 0.031183 & 0.2115 & 0.416718 \tabularnewline
27 & -0.087753 & -0.5952 & 0.277324 \tabularnewline
28 & 0.021663 & 0.1469 & 0.441916 \tabularnewline
29 & 0.035398 & 0.2401 & 0.405666 \tabularnewline
30 & -0.020854 & -0.1414 & 0.44407 \tabularnewline
31 & -0.133985 & -0.9087 & 0.184115 \tabularnewline
32 & 0.032542 & 0.2207 & 0.413147 \tabularnewline
33 & 0.037119 & 0.2518 & 0.401176 \tabularnewline
34 & -0.021378 & -0.145 & 0.442674 \tabularnewline
35 & -0.083939 & -0.5693 & 0.285961 \tabularnewline
36 & -0.070568 & -0.4786 & 0.31724 \tabularnewline
\hline
\end{tabular}
%Source: https://freestatistics.org/blog/index.php?pk=68219&T=2

[TABLE]
[ROW][C]Partial Autocorrelation Function[/C][/ROW]
[ROW][C]Time lag k[/C][C]PACF(k)[/C][C]T-STAT[/C][C]P-value[/C][/ROW]
[ROW][C]1[/C][C]-0.063528[/C][C]-0.4309[/C][C]0.334289[/C][/ROW]
[ROW][C]2[/C][C]0.131333[/C][C]0.8907[/C][C]0.18885[/C][/ROW]
[ROW][C]3[/C][C]0.299141[/C][C]2.0289[/C][C]0.024141[/C][/ROW]
[ROW][C]4[/C][C]-0.153778[/C][C]-1.043[/C][C]0.151206[/C][/ROW]
[ROW][C]5[/C][C]-0.190882[/C][C]-1.2946[/C][C]0.100956[/C][/ROW]
[ROW][C]6[/C][C]0.138901[/C][C]0.9421[/C][C]0.175538[/C][/ROW]
[ROW][C]7[/C][C]0.067194[/C][C]0.4557[/C][C]0.325364[/C][/ROW]
[ROW][C]8[/C][C]-0.138775[/C][C]-0.9412[/C][C]0.175755[/C][/ROW]
[ROW][C]9[/C][C]0.019548[/C][C]0.1326[/C][C]0.447552[/C][/ROW]
[ROW][C]10[/C][C]0.025977[/C][C]0.1762[/C][C]0.43046[/C][/ROW]
[ROW][C]11[/C][C]-0.023469[/C][C]-0.1592[/C][C]0.437115[/C][/ROW]
[ROW][C]12[/C][C]0.088394[/C][C]0.5995[/C][C]0.275885[/C][/ROW]
[ROW][C]13[/C][C]0.003609[/C][C]0.0245[/C][C]0.490288[/C][/ROW]
[ROW][C]14[/C][C]-0.056434[/C][C]-0.3828[/C][C]0.351832[/C][/ROW]
[ROW][C]15[/C][C]-0.072678[/C][C]-0.4929[/C][C]0.312205[/C][/ROW]
[ROW][C]16[/C][C]-0.150371[/C][C]-1.0199[/C][C]0.156563[/C][/ROW]
[ROW][C]17[/C][C]-0.154695[/C][C]-1.0492[/C][C]0.149785[/C][/ROW]
[ROW][C]18[/C][C]0.111203[/C][C]0.7542[/C][C]0.227281[/C][/ROW]
[ROW][C]19[/C][C]-0.046599[/C][C]-0.3161[/C][C]0.376697[/C][/ROW]
[ROW][C]20[/C][C]-0.10683[/C][C]-0.7246[/C][C]0.236196[/C][/ROW]
[ROW][C]21[/C][C]-0.170688[/C][C]-1.1577[/C][C]0.126488[/C][/ROW]
[ROW][C]22[/C][C]0.085237[/C][C]0.5781[/C][C]0.283007[/C][/ROW]
[ROW][C]23[/C][C]0.144962[/C][C]0.9832[/C][C]0.165332[/C][/ROW]
[ROW][C]24[/C][C]0.109413[/C][C]0.7421[/C][C]0.230907[/C][/ROW]
[ROW][C]25[/C][C]-0.076147[/C][C]-0.5165[/C][C]0.304005[/C][/ROW]
[ROW][C]26[/C][C]0.031183[/C][C]0.2115[/C][C]0.416718[/C][/ROW]
[ROW][C]27[/C][C]-0.087753[/C][C]-0.5952[/C][C]0.277324[/C][/ROW]
[ROW][C]28[/C][C]0.021663[/C][C]0.1469[/C][C]0.441916[/C][/ROW]
[ROW][C]29[/C][C]0.035398[/C][C]0.2401[/C][C]0.405666[/C][/ROW]
[ROW][C]30[/C][C]-0.020854[/C][C]-0.1414[/C][C]0.44407[/C][/ROW]
[ROW][C]31[/C][C]-0.133985[/C][C]-0.9087[/C][C]0.184115[/C][/ROW]
[ROW][C]32[/C][C]0.032542[/C][C]0.2207[/C][C]0.413147[/C][/ROW]
[ROW][C]33[/C][C]0.037119[/C][C]0.2518[/C][C]0.401176[/C][/ROW]
[ROW][C]34[/C][C]-0.021378[/C][C]-0.145[/C][C]0.442674[/C][/ROW]
[ROW][C]35[/C][C]-0.083939[/C][C]-0.5693[/C][C]0.285961[/C][/ROW]
[ROW][C]36[/C][C]-0.070568[/C][C]-0.4786[/C][C]0.31724[/C][/ROW]
[/TABLE]
Source: https://freestatistics.org/blog/index.php?pk=68219&T=2

Globally Unique Identifier (entire table): ba.freestatistics.org/blog/index.php?pk=68219&T=2

As an alternative you can also use a QR Code:  

The GUIDs for individual cells are displayed in the table below:

Partial Autocorrelation Function
Time lag kPACF(k)T-STATP-value
1-0.063528-0.43090.334289
20.1313330.89070.18885
30.2991412.02890.024141
4-0.153778-1.0430.151206
5-0.190882-1.29460.100956
60.1389010.94210.175538
70.0671940.45570.325364
8-0.138775-0.94120.175755
90.0195480.13260.447552
100.0259770.17620.43046
11-0.023469-0.15920.437115
120.0883940.59950.275885
130.0036090.02450.490288
14-0.056434-0.38280.351832
15-0.072678-0.49290.312205
16-0.150371-1.01990.156563
17-0.154695-1.04920.149785
180.1112030.75420.227281
19-0.046599-0.31610.376697
20-0.10683-0.72460.236196
21-0.170688-1.15770.126488
220.0852370.57810.283007
230.1449620.98320.165332
240.1094130.74210.230907
25-0.076147-0.51650.304005
260.0311830.21150.416718
27-0.087753-0.59520.277324
280.0216630.14690.441916
290.0353980.24010.405666
30-0.020854-0.14140.44407
31-0.133985-0.90870.184115
320.0325420.22070.413147
330.0371190.25180.401176
34-0.021378-0.1450.442674
35-0.083939-0.56930.285961
36-0.070568-0.47860.31724


Parameters (Session):
par1 = 36 ; par2 = 1 ; par3 = 1 ; par4 = 0 ; par5 = 12 ; par6 = White Noise ; par7 = 0.95 ;
Parameters (R input):
par1 = 36 ; par2 = 1 ; par3 = 1 ; par4 = 0 ; par5 = 12 ; par6 = White Noise ; par7 = 0.95 ;
R code (references can be found in the software module):
if (par1 == 'Default') {
par1 = 10*log10(length(x))
} else {
par1 <- as.numeric(par1)
}
par2 <- as.numeric(par2)
par3 <- as.numeric(par3)
par4 <- as.numeric(par4)
par5 <- as.numeric(par5)
if (par6 == 'White Noise') par6 <- 'white' else par6 <- 'ma'
par7 <- as.numeric(par7)
if (par2 == 0) {
x <- log(x)
} else {
x <- (x ^ par2 - 1) / par2
}
if (par3 > 0) x <- diff(x,lag=1,difference=par3)
if (par4 > 0) x <- diff(x,lag=par5,difference=par4)
bitmap(file='pic1.png')
racf <- acf(x, par1, main='Autocorrelation', xlab='time lag', ylab='ACF', ci.type=par6, ci=par7, sub=paste('(lambda=',par2,', d=',par3,', D=',par4,', CI=', par7, ', CI type=',par6,')',sep=''))
dev.off()
bitmap(file='pic2.png')
rpacf <- pacf(x,par1,main='Partial Autocorrelation',xlab='lags',ylab='PACF')
dev.off()
(myacf <- c(racf$acf))
(mypacf <- c(rpacf$acf))
lengthx <- length(x)
sqrtn <- sqrt(lengthx)
load(file='createtable')
a<-table.start()
a<-table.row.start(a)
a<-table.element(a,'Autocorrelation Function',4,TRUE)
a<-table.row.end(a)
a<-table.row.start(a)
a<-table.element(a,'Time lag k',header=TRUE)
a<-table.element(a,hyperlink('basics.htm','ACF(k)','click here for more information about the Autocorrelation Function'),header=TRUE)
a<-table.element(a,'T-STAT',header=TRUE)
a<-table.element(a,'P-value',header=TRUE)
a<-table.row.end(a)
for (i in 2:(par1+1)) {
a<-table.row.start(a)
a<-table.element(a,i-1,header=TRUE)
a<-table.element(a,round(myacf[i],6))
mytstat <- myacf[i]*sqrtn
a<-table.element(a,round(mytstat,4))
a<-table.element(a,round(1-pt(abs(mytstat),lengthx),6))
a<-table.row.end(a)
}
a<-table.end(a)
table.save(a,file='mytable.tab')
a<-table.start()
a<-table.row.start(a)
a<-table.element(a,'Partial Autocorrelation Function',4,TRUE)
a<-table.row.end(a)
a<-table.row.start(a)
a<-table.element(a,'Time lag k',header=TRUE)
a<-table.element(a,hyperlink('basics.htm','PACF(k)','click here for more information about the Partial Autocorrelation Function'),header=TRUE)
a<-table.element(a,'T-STAT',header=TRUE)
a<-table.element(a,'P-value',header=TRUE)
a<-table.row.end(a)
for (i in 1:par1) {
a<-table.row.start(a)
a<-table.element(a,i,header=TRUE)
a<-table.element(a,round(mypacf[i],6))
mytstat <- mypacf[i]*sqrtn
a<-table.element(a,round(mytstat,4))
a<-table.element(a,round(1-pt(abs(mytstat),lengthx),6))
a<-table.row.end(a)
}
a<-table.end(a)
table.save(a,file='mytable1.tab')