| Multiple Linear Regression - Estimated Regression Equation |
| Y[t] = + 335.571157600404 -1.70477710726246X[t] + 0.89890147954134`Y(t-1)`[t] + 0.0936947988015468`Y(t-2)`[t] -0.208005305165498`Y(t-3)`[t] -0.142243480596650`Y(t-4)`[t] + 0.96939388495551t + e[t] |
| Multiple Linear Regression - Ordinary Least Squares | |||||
| Variable | Parameter | S.D. | T-STAT H0: parameter = 0 | 2-tail p-value | 1-tail p-value |
| (Intercept) | 335.571157600404 | 45.260139 | 7.4143 | 0 | 0 |
| X | -1.70477710726246 | 0.227642 | -7.4888 | 0 | 0 |
| `Y(t-1)` | 0.89890147954134 | 0.096674 | 9.2983 | 0 | 0 |
| `Y(t-2)` | 0.0936947988015468 | 0.151481 | 0.6185 | 0.538533 | 0.269267 |
| `Y(t-3)` | -0.208005305165498 | 0.138109 | -1.5061 | 0.137204 | 0.068602 |
| `Y(t-4)` | -0.142243480596650 | 0.10325 | -1.3777 | 0.17334 | 0.08667 |
| t | 0.96939388495551 | 0.216996 | 4.4673 | 3.5e-05 | 1.7e-05 |
| Multiple Linear Regression - Regression Statistics | |
| Multiple R | 0.975397615345982 |
| R-squared | 0.951400508022629 |
| Adjusted R-squared | 0.946620230123215 |
| F-TEST (value) | 199.026192209315 |
| F-TEST (DF numerator) | 6 |
| F-TEST (DF denominator) | 61 |
| p-value | 0 |
| Multiple Linear Regression - Residual Statistics | |
| Residual Standard Deviation | 12.0710486924909 |
| Sum Squared Residuals | 8888.32320872567 |
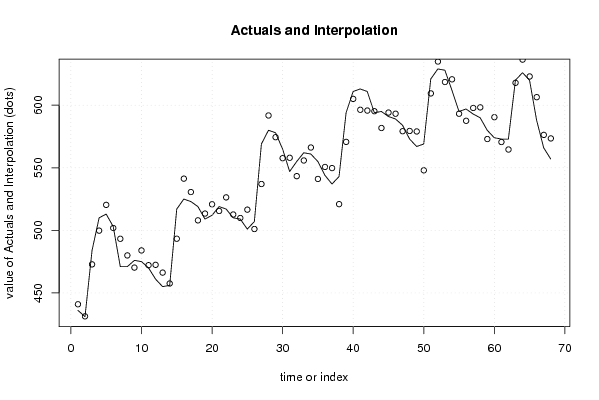
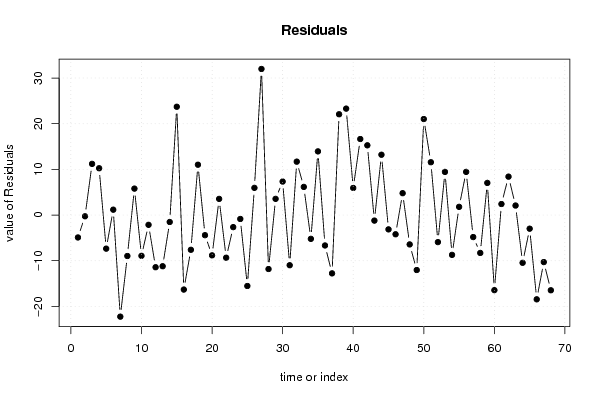
| Multiple Linear Regression - Actuals, Interpolation, and Residuals | |||
| Time or Index | Actuals | Interpolation Forecast | Residuals Prediction Error |
| 1 | 436 | 440.902243740456 | -4.90224374045607 |
| 2 | 431 | 431.272079739549 | -0.272079739548576 |
| 3 | 484 | 472.798434031188 | 11.2015659688121 |
| 4 | 510 | 499.752940507473 | 10.2470594925274 |
| 5 | 513 | 520.355232311236 | -7.35523231123551 |
| 6 | 503 | 501.824203931862 | 1.1757960681376 |
| 7 | 471 | 493.242542473447 | -22.2425424734472 |
| 8 | 471 | 479.9632090583 | -8.96320905829952 |
| 9 | 476 | 470.211417901527 | 5.78858209847298 |
| 10 | 475 | 483.924401466178 | -8.92440146617794 |
| 11 | 470 | 472.137865882794 | -2.13786588279427 |
| 12 | 461 | 472.422884656475 | -11.4228846564752 |
| 13 | 455 | 466.205733951722 | -11.2057339517219 |
| 14 | 456 | 457.517837587031 | -1.5178375870309 |
| 15 | 517 | 493.286561213999 | 23.7134387860008 |
| 16 | 525 | 541.31172295184 | -16.3117229518399 |
| 17 | 523 | 530.60246579095 | -7.6024657909504 |
| 18 | 519 | 507.975818500148 | 11.0241814998525 |
| 19 | 509 | 513.403392580776 | -4.40339258077575 |
| 20 | 512 | 520.823393181115 | -8.82339318111535 |
| 21 | 519 | 515.463255319317 | 3.5367446806826 |
| 22 | 517 | 526.336981774414 | -9.33698177441351 |
| 23 | 510 | 512.642727481362 | -2.64272748136249 |
| 24 | 509 | 509.852552023586 | -0.852552023585738 |
| 25 | 501 | 516.529461776951 | -15.5294617769509 |
| 26 | 507 | 501.043899637646 | 5.95610036235386 |
| 27 | 569 | 537.012542212967 | 31.9874577870325 |
| 28 | 580 | 591.82033977606 | -11.8203397760598 |
| 29 | 578 | 574.451579040923 | 3.54842095907682 |
| 30 | 565 | 557.664946445974 | 7.33505355402648 |
| 31 | 547 | 557.986657450614 | -10.9866574506140 |
| 32 | 555 | 543.307245725519 | 11.6927542744807 |
| 33 | 562 | 555.838499789795 | 6.16150021020511 |
| 34 | 561 | 566.203946658889 | -5.20394665888889 |
| 35 | 555 | 541.061642281309 | 13.9383577186910 |
| 36 | 544 | 550.656763160455 | -6.65676316045531 |
| 37 | 537 | 549.764647008579 | -12.7646470085793 |
| 38 | 543 | 520.934483559844 | 22.0655164401564 |
| 39 | 594 | 570.697592545136 | 23.3024074548642 |
| 40 | 611 | 605.068941293963 | 5.93105870603661 |
| 41 | 613 | 596.353123647544 | 16.6468763524564 |
| 42 | 611 | 595.729553631785 | 15.2704463682149 |
| 43 | 594 | 595.208599943498 | -1.20859994349809 |
| 44 | 595 | 581.796116644877 | 13.2038833551227 |
| 45 | 591 | 594.136563829723 | -3.13656382972284 |
| 46 | 589 | 593.20841350488 | -4.20841350488008 |
| 47 | 584 | 579.213320556615 | 4.78667944338537 |
| 48 | 573 | 579.429671690124 | -6.42967169012437 |
| 49 | 567 | 579.040112242969 | -12.0401122429686 |
| 50 | 569 | 547.974489656133 | 21.0255103438671 |
| 51 | 621 | 609.436438006827 | 11.5635619931732 |
| 52 | 629 | 634.918107355607 | -5.91810735560679 |
| 53 | 628 | 618.554693510729 | 9.44530648927072 |
| 54 | 612 | 620.718854359773 | -8.71885435977258 |
| 55 | 595 | 593.207572729854 | 1.79242727014585 |
| 56 | 597 | 587.54763333938 | 9.45236666061956 |
| 57 | 593 | 597.818111421003 | -4.81811142100308 |
| 58 | 590 | 598.29315378041 | -8.29315378041001 |
| 59 | 580 | 572.962491403863 | 7.03750859613707 |
| 60 | 574 | 590.440021543954 | -16.4400215439536 |
| 61 | 573 | 570.588099014714 | 2.41190098528601 |
| 62 | 573 | 564.59075371663 | 8.40924628336974 |
| 63 | 620 | 617.916410971808 | 2.0835890281924 |
| 64 | 626 | 636.453506264288 | -10.4535062642883 |
| 65 | 620 | 622.983895416908 | -2.98389541690800 |
| 66 | 588 | 606.4476787923 | -18.4476787923001 |
| 67 | 566 | 576.293778706233 | -10.2937787062328 |
| 68 | 557 | 573.465747896203 | -16.4657478962033 |
| Goldfeld-Quandt test for Heteroskedasticity | |||
| p-values | Alternative Hypothesis | ||
| breakpoint index | greater | 2-sided | less |
| 10 | 0.236510475682015 | 0.47302095136403 | 0.763489524317985 |
| 11 | 0.165178093814837 | 0.330356187629675 | 0.834821906185162 |
| 12 | 0.203423241239741 | 0.406846482479482 | 0.796576758760259 |
| 13 | 0.151887457793023 | 0.303774915586047 | 0.848112542206977 |
| 14 | 0.0917150316631639 | 0.183430063326328 | 0.908284968336836 |
| 15 | 0.161503145696357 | 0.323006291392715 | 0.838496854303643 |
| 16 | 0.394973913338768 | 0.789947826677535 | 0.605026086661232 |
| 17 | 0.345993260746964 | 0.691986521493927 | 0.654006739253036 |
| 18 | 0.390604244612135 | 0.78120848922427 | 0.609395755387865 |
| 19 | 0.340779892732296 | 0.681559785464593 | 0.659220107267704 |
| 20 | 0.277482962140613 | 0.554965924281226 | 0.722517037859387 |
| 21 | 0.256513633080538 | 0.513027266161077 | 0.743486366919462 |
| 22 | 0.216300945344194 | 0.432601890688387 | 0.783699054655806 |
| 23 | 0.175588011856562 | 0.351176023713125 | 0.824411988143438 |
| 24 | 0.133748545586970 | 0.267497091173940 | 0.86625145441303 |
| 25 | 0.220596277813233 | 0.441192555626467 | 0.779403722186767 |
| 26 | 0.219488155827634 | 0.438976311655268 | 0.780511844172366 |
| 27 | 0.464391419873061 | 0.928782839746122 | 0.535608580126939 |
| 28 | 0.500222238837007 | 0.999555522325986 | 0.499777761162993 |
| 29 | 0.556968597064726 | 0.886062805870548 | 0.443031402935274 |
| 30 | 0.494832509055834 | 0.989665018111667 | 0.505167490944166 |
| 31 | 0.510423104258759 | 0.979153791482482 | 0.489576895741241 |
| 32 | 0.541466910214398 | 0.917066179571204 | 0.458533089785602 |
| 33 | 0.50019541379878 | 0.99960917240244 | 0.49980458620122 |
| 34 | 0.519887565068556 | 0.960224869862887 | 0.480112434931444 |
| 35 | 0.516921964370707 | 0.966156071258585 | 0.483078035629293 |
| 36 | 0.607098486422318 | 0.785803027155365 | 0.392901513577682 |
| 37 | 0.903944364820316 | 0.192111270359368 | 0.0960556351796842 |
| 38 | 0.90786055481905 | 0.184278890361899 | 0.0921394451809495 |
| 39 | 0.895293546750045 | 0.209412906499910 | 0.104706453249955 |
| 40 | 0.864322126320253 | 0.271355747359494 | 0.135677873679747 |
| 41 | 0.853872930855082 | 0.292254138289836 | 0.146127069144918 |
| 42 | 0.833125813006842 | 0.333748373986317 | 0.166874186993159 |
| 43 | 0.780629094100719 | 0.438741811798563 | 0.219370905899281 |
| 44 | 0.776744834405987 | 0.446510331188026 | 0.223255165594013 |
| 45 | 0.717295045786541 | 0.565409908426919 | 0.282704954213459 |
| 46 | 0.690860662865715 | 0.618278674268571 | 0.309139337134285 |
| 47 | 0.610082444139056 | 0.779835111721888 | 0.389917555860944 |
| 48 | 0.682961515556475 | 0.634076968887051 | 0.317038484443526 |
| 49 | 0.941115447533883 | 0.117769104932235 | 0.0588845524661173 |
| 50 | 0.909242526041199 | 0.181514947917603 | 0.0907574739588014 |
| 51 | 0.86706914548049 | 0.265861709039021 | 0.132930854519510 |
| 52 | 0.847585928554038 | 0.304828142891923 | 0.152414071445962 |
| 53 | 0.769619312580366 | 0.460761374839268 | 0.230380687419634 |
| 54 | 0.72170325599937 | 0.55659348800126 | 0.27829674400063 |
| 55 | 0.608947924779973 | 0.782104150440055 | 0.391052075220028 |
| 56 | 0.751008872272548 | 0.497982255454905 | 0.248991127727452 |
| 57 | 0.720536312537067 | 0.558927374925865 | 0.279463687462933 |
| 58 | 0.574999953159469 | 0.850000093681063 | 0.425000046840531 |
| Meta Analysis of Goldfeld-Quandt test for Heteroskedasticity | |||
| Description | # significant tests | % significant tests | OK/NOK |
| 1% type I error level | 0 | 0 | OK |
| 5% type I error level | 0 | 0 | OK |
| 10% type I error level | 0 | 0 | OK |