| Multiple Linear Regression - Estimated Regression Equation |
| TW[t] = + 2.75714764262054 -0.00337666443229272CV[t] + 1.32623679314269TW1[t] -0.639603306651212TW2[t] -0.109035744813868M1[t] -0.0460005199250042M2[t] + 0.673083023163224M3[t] -0.271431816286714M4[t] -0.0474155919942077M5[t] -0.0865653868507958M6[t] + 0.0235232511887366M7[t] + 0.246755675487309M8[t] + 0.137257167200593M9[t] -0.00491680202440453M10[t] -0.0173049943056759M11[t] -0.0118920563247720t + e[t] |
| Multiple Linear Regression - Ordinary Least Squares | |||||
| Variable | Parameter | S.D. | T-STAT H0: parameter = 0 | 2-tail p-value | 1-tail p-value |
| (Intercept) | 2.75714764262054 | 0.527471 | 5.2271 | 6e-06 | 3e-06 |
| CV | -0.00337666443229272 | 0.004699 | -0.7186 | 0.476578 | 0.238289 |
| TW1 | 1.32623679314269 | 0.10123 | 13.1012 | 0 | 0 |
| TW2 | -0.639603306651212 | 0.099888 | -6.4032 | 0 | 0 |
| M1 | -0.109035744813868 | 0.118356 | -0.9213 | 0.36244 | 0.18122 |
| M2 | -0.0460005199250042 | 0.120025 | -0.3833 | 0.703558 | 0.351779 |
| M3 | 0.673083023163224 | 0.122248 | 5.5059 | 2e-06 | 1e-06 |
| M4 | -0.271431816286714 | 0.145796 | -1.8617 | 0.070002 | 0.035001 |
| M5 | -0.0474155919942077 | 0.118628 | -0.3997 | 0.691504 | 0.345752 |
| M6 | -0.0865653868507958 | 0.116184 | -0.7451 | 0.460584 | 0.230292 |
| M7 | 0.0235232511887366 | 0.118638 | 0.1983 | 0.843832 | 0.421916 |
| M8 | 0.246755675487309 | 0.119056 | 2.0726 | 0.044696 | 0.022348 |
| M9 | 0.137257167200593 | 0.124156 | 1.1055 | 0.27554 | 0.13777 |
| M10 | -0.00491680202440453 | 0.124872 | -0.0394 | 0.968787 | 0.484394 |
| M11 | -0.0173049943056759 | 0.121992 | -0.1419 | 0.887907 | 0.443954 |
| t | -0.0118920563247720 | 0.002358 | -5.0431 | 1e-05 | 5e-06 |
| Multiple Linear Regression - Regression Statistics | |
| Multiple R | 0.980458370849766 |
| R-squared | 0.961298616969377 |
| Adjusted R-squared | 0.946785598332893 |
| F-TEST (value) | 66.2369863256984 |
| F-TEST (DF numerator) | 15 |
| F-TEST (DF denominator) | 40 |
| p-value | 0 |
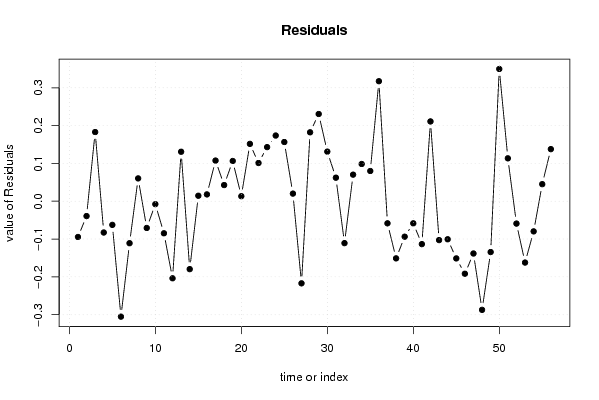
| Multiple Linear Regression - Residual Statistics | |
| Residual Standard Deviation | 0.171586434098140 |
| Sum Squared Residuals | 1.17767617466061 |
| Multiple Linear Regression - Actuals, Interpolation, and Residuals | |||
| Time or Index | Actuals | Interpolation Forecast | Residuals Prediction Error |
| 1 | 7.2 | 7.2945483314408 | -0.0945483314407923 |
| 2 | 7.4 | 7.4392431207893 | -0.0392431207892947 |
| 3 | 8.8 | 8.61706961590582 | 0.182930384094177 |
| 4 | 9.3 | 9.38272024033606 | -0.0827202403360574 |
| 5 | 9.3 | 9.36251817556344 | -0.0625181755634421 |
| 6 | 8.7 | 9.00518132878565 | -0.305181328785649 |
| 7 | 8.2 | 8.31101249904708 | -0.111012499047083 |
| 8 | 8.3 | 8.23961979000797 | 0.06038020999203 |
| 9 | 8.5 | 8.57065455803636 | -0.0706545580363608 |
| 10 | 8.6 | 8.60774556715313 | -0.00774556715312895 |
| 11 | 8.5 | 8.58479167209882 | -0.0847916720988191 |
| 12 | 8.2 | 8.40375059339721 | -0.203750593397212 |
| 13 | 8.1 | 7.96917207157464 | 0.13082792842536 |
| 14 | 7.9 | 8.07957255281983 | -0.179572552819826 |
| 15 | 8.6 | 8.58547701161987 | 0.0145229883801341 |
| 16 | 8.7 | 8.681979867943 | 0.0180201320570091 |
| 17 | 8.7 | 8.59251205829832 | 0.107487941701683 |
| 18 | 8.5 | 8.45724988985808 | 0.0427501101419214 |
| 19 | 8.4 | 8.2935757773766 | 0.106424222623407 |
| 20 | 8.5 | 8.4867064696372 | 0.0132935303628041 |
| 21 | 8.7 | 8.54839325727593 | 0.151606742724072 |
| 22 | 8.7 | 8.59899092412187 | 0.101009075878132 |
| 23 | 8.6 | 8.45692000748246 | 0.143079992517539 |
| 24 | 8.5 | 8.3263326017168 | 0.173667398283198 |
| 25 | 8.3 | 8.1434947807936 | 0.156505219206401 |
| 26 | 8 | 7.9798442636651 | 0.0201557363348963 |
| 27 | 8.2 | 8.41708537381599 | -0.217085373815993 |
| 28 | 8.1 | 7.91780682866518 | 0.182193171334815 |
| 29 | 8.1 | 7.8693866559884 | 0.230613344011592 |
| 30 | 8 | 7.868798477743 | 0.131201522257002 |
| 31 | 7.9 | 7.83774804457578 | 0.0622519554242182 |
| 32 | 7.9 | 8.01081504379107 | -0.110815043791068 |
| 33 | 8 | 7.92974815881865 | 0.0702518411813467 |
| 34 | 8 | 7.90155248371857 | 0.0984475162814332 |
| 35 | 7.9 | 7.82006523331199 | 0.0799347666880124 |
| 36 | 8 | 7.68272449868174 | 0.317275501318255 |
| 37 | 7.7 | 7.75838070752249 | -0.0583807075224943 |
| 38 | 7.2 | 7.35106917191095 | -0.151069171910950 |
| 39 | 7.5 | 7.59377658296301 | -0.093776582963008 |
| 40 | 7.3 | 7.358419042889 | -0.0584190428890049 |
| 41 | 7 | 7.11341486023284 | -0.113414860232837 |
| 42 | 7 | 6.78904596800662 | 0.210954031993382 |
| 43 | 7 | 7.10276019274279 | -0.102760192742791 |
| 44 | 7.2 | 7.30059390298742 | -0.100593902987420 |
| 45 | 7.3 | 7.45120402586906 | -0.151204025869058 |
| 46 | 7.1 | 7.29171102500644 | -0.191711025006436 |
| 47 | 6.8 | 6.93822308710673 | -0.138223087106733 |
| 48 | 6.4 | 6.68719230620424 | -0.287192306204241 |
| 49 | 6.1 | 6.23440410866847 | -0.134404108668474 |
| 50 | 6.5 | 6.15027089081483 | 0.349729109185174 |
| 51 | 7.7 | 7.58659141569531 | 0.113408584304690 |
| 52 | 7.9 | 7.95907402016676 | -0.0590740201667619 |
| 53 | 7.5 | 7.662168249917 | -0.162168249916996 |
| 54 | 6.9 | 6.97972433560666 | -0.0797243356066566 |
| 55 | 6.6 | 6.55490348625775 | 0.0450965137422496 |
| 56 | 6.9 | 6.76226479357635 | 0.137735206423654 |
| Goldfeld-Quandt test for Heteroskedasticity | |||
| p-values | Alternative Hypothesis | ||
| breakpoint index | greater | 2-sided | less |
| 19 | 0.170836706027506 | 0.341673412055013 | 0.829163293972494 |
| 20 | 0.201516690933704 | 0.403033381867409 | 0.798483309066295 |
| 21 | 0.150050902050833 | 0.300101804101666 | 0.849949097949167 |
| 22 | 0.0759213508774094 | 0.151842701754819 | 0.92407864912259 |
| 23 | 0.0492411089202135 | 0.098482217840427 | 0.950758891079787 |
| 24 | 0.0515732769993417 | 0.103146553998683 | 0.948426723000658 |
| 25 | 0.027211430377822 | 0.054422860755644 | 0.972788569622178 |
| 26 | 0.0149208241781074 | 0.0298416483562148 | 0.985079175821893 |
| 27 | 0.153612415289636 | 0.307224830579272 | 0.846387584710364 |
| 28 | 0.102739990513264 | 0.205479981026527 | 0.897260009486736 |
| 29 | 0.0726734931475349 | 0.14534698629507 | 0.927326506852465 |
| 30 | 0.0467658089700294 | 0.0935316179400588 | 0.95323419102997 |
| 31 | 0.0426857444672038 | 0.0853714889344075 | 0.957314255532796 |
| 32 | 0.152186221383871 | 0.304372442767742 | 0.847813778616129 |
| 33 | 0.100020984911161 | 0.200041969822322 | 0.89997901508884 |
| 34 | 0.0590434017992282 | 0.118086803598456 | 0.940956598200772 |
| 35 | 0.0341172747809487 | 0.0682345495618975 | 0.965882725219051 |
| 36 | 0.240414379366149 | 0.480828758732297 | 0.759585620633851 |
| 37 | 0.752417236451776 | 0.495165527096448 | 0.247582763548224 |
| Meta Analysis of Goldfeld-Quandt test for Heteroskedasticity | |||
| Description | # significant tests | % significant tests | OK/NOK |
| 1% type I error level | 0 | 0 | OK |
| 5% type I error level | 1 | 0.0526315789473684 | NOK |
| 10% type I error level | 6 | 0.315789473684211 | NOK |