Free Statistics

of Irreproducible Research!

Author's title

Author*The author of this computation has been verified*
R Software Modulerwasp_arimabackwardselection.wasp
Title produced by softwareARIMA Backward Selection
Date of computationSat, 12 Dec 2009 14:59:02 -0700
Cite this page as followsStatistical Computations at FreeStatistics.org, Office for Research Development and Education, URL https://freestatistics.org/blog/index.php?v=date/2009/Dec/12/t1260655185ju2hpleuzeddks8.htm/, Retrieved Mon, 29 Apr 2024 08:50:30 +0000
Statistical Computations at FreeStatistics.org, Office for Research Development and Education, URL https://freestatistics.org/blog/index.php?pk=67149, Retrieved Mon, 29 Apr 2024 08:50:30 +0000
QR Codes:

Original text written by user:
IsPrivate?No (this computation is public)
User-defined keywords
Estimated Impact112
Family? (F = Feedback message, R = changed R code, M = changed R Module, P = changed Parameters, D = changed Data)
-     [Univariate Data Series] [data set] [2008-12-01 19:54:57] [b98453cac15ba1066b407e146608df68]
- RMP   [ARIMA Backward Selection] [] [2009-11-27 14:53:14] [b98453cac15ba1066b407e146608df68]
-   PD      [ARIMA Backward Selection] [] [2009-12-12 21:59:02] [03368d751914a6c247d86aff8eac7cbf] [Current]
-   PD        [ARIMA Backward Selection] [ARMA voor aantal ...] [2009-12-15 19:22:35] [82d27727e9ba70a4d0e9e253f76836cf]
Feedback Forum

Post a new message
Dataseries X:
2360
2214
2825
2355
2333
3016
2155
2172
2150
2533
2058
2160
2260
2498
2695
2799
2947
2930
2318
2540
2570
2669
2450
2842
3440
2678
2981
2260
2844
2546
2456
2295
2379
2479
2057
2280
2351
2276
2548
2311
2201
2725
2408
2139
1898
2537
2069
2063
2524
2437
2189
2793
2074
2622
2278
2144
2427
2139
1828
2072
1800


Summary of computational transaction
Raw Inputview raw input (R code)
Raw Outputview raw output of R engine
Computing time5 seconds
R Server'Gwilym Jenkins' @ 72.249.127.135

\begin{tabular}{lllllllll}
\hline
Summary of computational transaction \tabularnewline
Raw Input & view raw input (R code)  \tabularnewline
Raw Output & view raw output of R engine  \tabularnewline
Computing time & 5 seconds \tabularnewline
R Server & 'Gwilym Jenkins' @ 72.249.127.135 \tabularnewline
\hline
\end{tabular}
%Source: https://freestatistics.org/blog/index.php?pk=67149&T=0

[TABLE]
[ROW][C]Summary of computational transaction[/C][/ROW]
[ROW][C]Raw Input[/C][C]view raw input (R code) [/C][/ROW]
[ROW][C]Raw Output[/C][C]view raw output of R engine [/C][/ROW]
[ROW][C]Computing time[/C][C]5 seconds[/C][/ROW]
[ROW][C]R Server[/C][C]'Gwilym Jenkins' @ 72.249.127.135[/C][/ROW]
[/TABLE]
Source: https://freestatistics.org/blog/index.php?pk=67149&T=0

Globally Unique Identifier (entire table): ba.freestatistics.org/blog/index.php?pk=67149&T=0

As an alternative you can also use a QR Code:  

The GUIDs for individual cells are displayed in the table below:

Summary of computational transaction
Raw Inputview raw input (R code)
Raw Outputview raw output of R engine
Computing time5 seconds
R Server'Gwilym Jenkins' @ 72.249.127.135


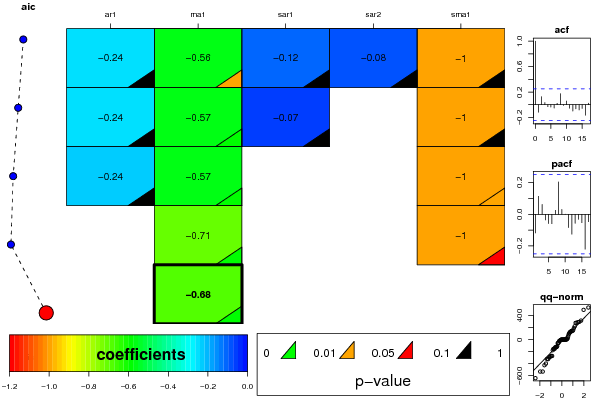
ARIMA Parameter Estimation and Backward Selection
Iterationar1ma1sar1sar2sma1
Estimates ( 1 )-0.2444-0.5581-0.1169-0.0755-0.9956
(p-val)(0.2746 )(0.0119 )(0.6367 )(0.765 )(0.4629 )
Estimates ( 2 )-0.2436-0.5661-0.06640-1
(p-val)(0.2677 )(0.0081 )(0.7205 )(NA )(0.1526 )
Estimates ( 3 )-0.2369-0.566700-1
(p-val)(0.2818 )(0.008 )(NA )(NA )(0.0413 )
Estimates ( 4 )0-0.70800-0.9995
(p-val)(NA )(0 )(NA )(NA )(0.055 )
Estimates ( 5 )0-0.6759000
(p-val)(NA )(0 )(NA )(NA )(NA )
Estimates ( 6 )NANANANANA
(p-val)(NA )(NA )(NA )(NA )(NA )
Estimates ( 7 )NANANANANA
(p-val)(NA )(NA )(NA )(NA )(NA )
Estimates ( 8 )NANANANANA
(p-val)(NA )(NA )(NA )(NA )(NA )
Estimates ( 9 )NANANANANA
(p-val)(NA )(NA )(NA )(NA )(NA )

\begin{tabular}{lllllllll}
\hline
ARIMA Parameter Estimation and Backward Selection \tabularnewline
Iteration & ar1 & ma1 & sar1 & sar2 & sma1 \tabularnewline
Estimates ( 1 ) & -0.2444 & -0.5581 & -0.1169 & -0.0755 & -0.9956 \tabularnewline
(p-val) & (0.2746 ) & (0.0119 ) & (0.6367 ) & (0.765 ) & (0.4629 ) \tabularnewline
Estimates ( 2 ) & -0.2436 & -0.5661 & -0.0664 & 0 & -1 \tabularnewline
(p-val) & (0.2677 ) & (0.0081 ) & (0.7205 ) & (NA ) & (0.1526 ) \tabularnewline
Estimates ( 3 ) & -0.2369 & -0.5667 & 0 & 0 & -1 \tabularnewline
(p-val) & (0.2818 ) & (0.008 ) & (NA ) & (NA ) & (0.0413 ) \tabularnewline
Estimates ( 4 ) & 0 & -0.708 & 0 & 0 & -0.9995 \tabularnewline
(p-val) & (NA ) & (0 ) & (NA ) & (NA ) & (0.055 ) \tabularnewline
Estimates ( 5 ) & 0 & -0.6759 & 0 & 0 & 0 \tabularnewline
(p-val) & (NA ) & (0 ) & (NA ) & (NA ) & (NA ) \tabularnewline
Estimates ( 6 ) & NA & NA & NA & NA & NA \tabularnewline
(p-val) & (NA ) & (NA ) & (NA ) & (NA ) & (NA ) \tabularnewline
Estimates ( 7 ) & NA & NA & NA & NA & NA \tabularnewline
(p-val) & (NA ) & (NA ) & (NA ) & (NA ) & (NA ) \tabularnewline
Estimates ( 8 ) & NA & NA & NA & NA & NA \tabularnewline
(p-val) & (NA ) & (NA ) & (NA ) & (NA ) & (NA ) \tabularnewline
Estimates ( 9 ) & NA & NA & NA & NA & NA \tabularnewline
(p-val) & (NA ) & (NA ) & (NA ) & (NA ) & (NA ) \tabularnewline
\hline
\end{tabular}
%Source: https://freestatistics.org/blog/index.php?pk=67149&T=1

[TABLE]
[ROW][C]ARIMA Parameter Estimation and Backward Selection[/C][/ROW]
[ROW][C]Iteration[/C][C]ar1[/C][C]ma1[/C][C]sar1[/C][C]sar2[/C][C]sma1[/C][/ROW]
[ROW][C]Estimates ( 1 )[/C][C]-0.2444[/C][C]-0.5581[/C][C]-0.1169[/C][C]-0.0755[/C][C]-0.9956[/C][/ROW]
[ROW][C](p-val)[/C][C](0.2746 )[/C][C](0.0119 )[/C][C](0.6367 )[/C][C](0.765 )[/C][C](0.4629 )[/C][/ROW]
[ROW][C]Estimates ( 2 )[/C][C]-0.2436[/C][C]-0.5661[/C][C]-0.0664[/C][C]0[/C][C]-1[/C][/ROW]
[ROW][C](p-val)[/C][C](0.2677 )[/C][C](0.0081 )[/C][C](0.7205 )[/C][C](NA )[/C][C](0.1526 )[/C][/ROW]
[ROW][C]Estimates ( 3 )[/C][C]-0.2369[/C][C]-0.5667[/C][C]0[/C][C]0[/C][C]-1[/C][/ROW]
[ROW][C](p-val)[/C][C](0.2818 )[/C][C](0.008 )[/C][C](NA )[/C][C](NA )[/C][C](0.0413 )[/C][/ROW]
[ROW][C]Estimates ( 4 )[/C][C]0[/C][C]-0.708[/C][C]0[/C][C]0[/C][C]-0.9995[/C][/ROW]
[ROW][C](p-val)[/C][C](NA )[/C][C](0 )[/C][C](NA )[/C][C](NA )[/C][C](0.055 )[/C][/ROW]
[ROW][C]Estimates ( 5 )[/C][C]0[/C][C]-0.6759[/C][C]0[/C][C]0[/C][C]0[/C][/ROW]
[ROW][C](p-val)[/C][C](NA )[/C][C](0 )[/C][C](NA )[/C][C](NA )[/C][C](NA )[/C][/ROW]
[ROW][C]Estimates ( 6 )[/C][C]NA[/C][C]NA[/C][C]NA[/C][C]NA[/C][C]NA[/C][/ROW]
[ROW][C](p-val)[/C][C](NA )[/C][C](NA )[/C][C](NA )[/C][C](NA )[/C][C](NA )[/C][/ROW]
[ROW][C]Estimates ( 7 )[/C][C]NA[/C][C]NA[/C][C]NA[/C][C]NA[/C][C]NA[/C][/ROW]
[ROW][C](p-val)[/C][C](NA )[/C][C](NA )[/C][C](NA )[/C][C](NA )[/C][C](NA )[/C][/ROW]
[ROW][C]Estimates ( 8 )[/C][C]NA[/C][C]NA[/C][C]NA[/C][C]NA[/C][C]NA[/C][/ROW]
[ROW][C](p-val)[/C][C](NA )[/C][C](NA )[/C][C](NA )[/C][C](NA )[/C][C](NA )[/C][/ROW]
[ROW][C]Estimates ( 9 )[/C][C]NA[/C][C]NA[/C][C]NA[/C][C]NA[/C][C]NA[/C][/ROW]
[ROW][C](p-val)[/C][C](NA )[/C][C](NA )[/C][C](NA )[/C][C](NA )[/C][C](NA )[/C][/ROW]
[/TABLE]
Source: https://freestatistics.org/blog/index.php?pk=67149&T=1

Globally Unique Identifier (entire table): ba.freestatistics.org/blog/index.php?pk=67149&T=1

As an alternative you can also use a QR Code:  

The GUIDs for individual cells are displayed in the table below:

ARIMA Parameter Estimation and Backward Selection
Iterationar1ma1sar1sar2sma1
Estimates ( 1 )-0.2444-0.5581-0.1169-0.0755-0.9956
(p-val)(0.2746 )(0.0119 )(0.6367 )(0.765 )(0.4629 )
Estimates ( 2 )-0.2436-0.5661-0.06640-1
(p-val)(0.2677 )(0.0081 )(0.7205 )(NA )(0.1526 )
Estimates ( 3 )-0.2369-0.566700-1
(p-val)(0.2818 )(0.008 )(NA )(NA )(0.0413 )
Estimates ( 4 )0-0.70800-0.9995
(p-val)(NA )(0 )(NA )(NA )(0.055 )
Estimates ( 5 )0-0.6759000
(p-val)(NA )(0 )(NA )(NA )(NA )
Estimates ( 6 )NANANANANA
(p-val)(NA )(NA )(NA )(NA )(NA )
Estimates ( 7 )NANANANANA
(p-val)(NA )(NA )(NA )(NA )(NA )
Estimates ( 8 )NANANANANA
(p-val)(NA )(NA )(NA )(NA )(NA )
Estimates ( 9 )NANANANANA
(p-val)(NA )(NA )(NA )(NA )(NA )


Estimated ARIMA Residuals
Value
-8.562588494131
221.642856091557
-152.48274526826
295.631250866022
317.118100889547
-272.065153300428
-14.8911319732101
134.225573619448
131.486177290809
-107.822113400649
104.741638059487
279.215487949002
496.186928352294
-324.111248904754
-298.562955901744
-641.712675847783
-24.8910851554117
-531.786980093806
152.134386114004
-121.429262659234
-20.5827941224789
-129.708384681747
-153.062792958801
-127.954891211699
-272.138798428518
-57.2895952084763
-124.205153974969
21.2083131083458
-284.818339608561
146.246868934219
280.030736090634
-57.3677724459189
-275.906476161225
190.158355560676
51.4573378554693
-175.800101466085
86.0424180765638
147.446641495974
-425.922352836852
535.10665827592
-398.986716135688
8.57742619624186
118.765828913917
6.89595219366377
291.377902834559
-324.472992242067
-153.663488486180
-49.5166719532124
-531.768563328771

\begin{tabular}{lllllllll}
\hline
Estimated ARIMA Residuals \tabularnewline
Value \tabularnewline
-8.562588494131 \tabularnewline
221.642856091557 \tabularnewline
-152.48274526826 \tabularnewline
295.631250866022 \tabularnewline
317.118100889547 \tabularnewline
-272.065153300428 \tabularnewline
-14.8911319732101 \tabularnewline
134.225573619448 \tabularnewline
131.486177290809 \tabularnewline
-107.822113400649 \tabularnewline
104.741638059487 \tabularnewline
279.215487949002 \tabularnewline
496.186928352294 \tabularnewline
-324.111248904754 \tabularnewline
-298.562955901744 \tabularnewline
-641.712675847783 \tabularnewline
-24.8910851554117 \tabularnewline
-531.786980093806 \tabularnewline
152.134386114004 \tabularnewline
-121.429262659234 \tabularnewline
-20.5827941224789 \tabularnewline
-129.708384681747 \tabularnewline
-153.062792958801 \tabularnewline
-127.954891211699 \tabularnewline
-272.138798428518 \tabularnewline
-57.2895952084763 \tabularnewline
-124.205153974969 \tabularnewline
21.2083131083458 \tabularnewline
-284.818339608561 \tabularnewline
146.246868934219 \tabularnewline
280.030736090634 \tabularnewline
-57.3677724459189 \tabularnewline
-275.906476161225 \tabularnewline
190.158355560676 \tabularnewline
51.4573378554693 \tabularnewline
-175.800101466085 \tabularnewline
86.0424180765638 \tabularnewline
147.446641495974 \tabularnewline
-425.922352836852 \tabularnewline
535.10665827592 \tabularnewline
-398.986716135688 \tabularnewline
8.57742619624186 \tabularnewline
118.765828913917 \tabularnewline
6.89595219366377 \tabularnewline
291.377902834559 \tabularnewline
-324.472992242067 \tabularnewline
-153.663488486180 \tabularnewline
-49.5166719532124 \tabularnewline
-531.768563328771 \tabularnewline
\hline
\end{tabular}
%Source: https://freestatistics.org/blog/index.php?pk=67149&T=2

[TABLE]
[ROW][C]Estimated ARIMA Residuals[/C][/ROW]
[ROW][C]Value[/C][/ROW]
[ROW][C]-8.562588494131[/C][/ROW]
[ROW][C]221.642856091557[/C][/ROW]
[ROW][C]-152.48274526826[/C][/ROW]
[ROW][C]295.631250866022[/C][/ROW]
[ROW][C]317.118100889547[/C][/ROW]
[ROW][C]-272.065153300428[/C][/ROW]
[ROW][C]-14.8911319732101[/C][/ROW]
[ROW][C]134.225573619448[/C][/ROW]
[ROW][C]131.486177290809[/C][/ROW]
[ROW][C]-107.822113400649[/C][/ROW]
[ROW][C]104.741638059487[/C][/ROW]
[ROW][C]279.215487949002[/C][/ROW]
[ROW][C]496.186928352294[/C][/ROW]
[ROW][C]-324.111248904754[/C][/ROW]
[ROW][C]-298.562955901744[/C][/ROW]
[ROW][C]-641.712675847783[/C][/ROW]
[ROW][C]-24.8910851554117[/C][/ROW]
[ROW][C]-531.786980093806[/C][/ROW]
[ROW][C]152.134386114004[/C][/ROW]
[ROW][C]-121.429262659234[/C][/ROW]
[ROW][C]-20.5827941224789[/C][/ROW]
[ROW][C]-129.708384681747[/C][/ROW]
[ROW][C]-153.062792958801[/C][/ROW]
[ROW][C]-127.954891211699[/C][/ROW]
[ROW][C]-272.138798428518[/C][/ROW]
[ROW][C]-57.2895952084763[/C][/ROW]
[ROW][C]-124.205153974969[/C][/ROW]
[ROW][C]21.2083131083458[/C][/ROW]
[ROW][C]-284.818339608561[/C][/ROW]
[ROW][C]146.246868934219[/C][/ROW]
[ROW][C]280.030736090634[/C][/ROW]
[ROW][C]-57.3677724459189[/C][/ROW]
[ROW][C]-275.906476161225[/C][/ROW]
[ROW][C]190.158355560676[/C][/ROW]
[ROW][C]51.4573378554693[/C][/ROW]
[ROW][C]-175.800101466085[/C][/ROW]
[ROW][C]86.0424180765638[/C][/ROW]
[ROW][C]147.446641495974[/C][/ROW]
[ROW][C]-425.922352836852[/C][/ROW]
[ROW][C]535.10665827592[/C][/ROW]
[ROW][C]-398.986716135688[/C][/ROW]
[ROW][C]8.57742619624186[/C][/ROW]
[ROW][C]118.765828913917[/C][/ROW]
[ROW][C]6.89595219366377[/C][/ROW]
[ROW][C]291.377902834559[/C][/ROW]
[ROW][C]-324.472992242067[/C][/ROW]
[ROW][C]-153.663488486180[/C][/ROW]
[ROW][C]-49.5166719532124[/C][/ROW]
[ROW][C]-531.768563328771[/C][/ROW]
[/TABLE]
Source: https://freestatistics.org/blog/index.php?pk=67149&T=2

Globally Unique Identifier (entire table): ba.freestatistics.org/blog/index.php?pk=67149&T=2

As an alternative you can also use a QR Code:  

The GUIDs for individual cells are displayed in the table below:

Estimated ARIMA Residuals
Value
-8.562588494131
221.642856091557
-152.48274526826
295.631250866022
317.118100889547
-272.065153300428
-14.8911319732101
134.225573619448
131.486177290809
-107.822113400649
104.741638059487
279.215487949002
496.186928352294
-324.111248904754
-298.562955901744
-641.712675847783
-24.8910851554117
-531.786980093806
152.134386114004
-121.429262659234
-20.5827941224789
-129.708384681747
-153.062792958801
-127.954891211699
-272.138798428518
-57.2895952084763
-124.205153974969
21.2083131083458
-284.818339608561
146.246868934219
280.030736090634
-57.3677724459189
-275.906476161225
190.158355560676
51.4573378554693
-175.800101466085
86.0424180765638
147.446641495974
-425.922352836852
535.10665827592
-398.986716135688
8.57742619624186
118.765828913917
6.89595219366377
291.377902834559
-324.472992242067
-153.663488486180
-49.5166719532124
-531.768563328771


Parameters (Session):
par1 = 1 ; par2 = 2 ; par3 = 2 ; par4 = 12 ;
Parameters (R input):
par1 = FALSE ; par2 = 1 ; par3 = 1 ; par4 = 1 ; par5 = 12 ; par6 = 1 ; par7 = 1 ; par8 = 2 ; par9 = 1 ;
R code (references can be found in the software module):
library(lattice)
if (par1 == 'TRUE') par1 <- TRUE
if (par1 == 'FALSE') par1 <- FALSE
par2 <- as.numeric(par2) #Box-Cox lambda transformation parameter
par3 <- as.numeric(par3) #degree of non-seasonal differencing
par4 <- as.numeric(par4) #degree of seasonal differencing
par5 <- as.numeric(par5) #seasonal period
par6 <- as.numeric(par6) #degree (p) of the non-seasonal AR(p) polynomial
par7 <- as.numeric(par7) #degree (q) of the non-seasonal MA(q) polynomial
par8 <- as.numeric(par8) #degree (P) of the seasonal AR(P) polynomial
par9 <- as.numeric(par9) #degree (Q) of the seasonal MA(Q) polynomial
armaGR <- function(arima.out, names, n){
try1 <- arima.out$coef
try2 <- sqrt(diag(arima.out$var.coef))
try.data.frame <- data.frame(matrix(NA,ncol=4,nrow=length(names)))
dimnames(try.data.frame) <- list(names,c('coef','std','tstat','pv'))
try.data.frame[,1] <- try1
for(i in 1:length(try2)) try.data.frame[which(rownames(try.data.frame)==names(try2)[i]),2] <- try2[i]
try.data.frame[,3] <- try.data.frame[,1] / try.data.frame[,2]
try.data.frame[,4] <- round((1-pt(abs(try.data.frame[,3]),df=n-(length(try2)+1)))*2,5)
vector <- rep(NA,length(names))
vector[is.na(try.data.frame[,4])] <- 0
maxi <- which.max(try.data.frame[,4])
continue <- max(try.data.frame[,4],na.rm=TRUE) > .05
vector[maxi] <- 0
list(summary=try.data.frame,next.vector=vector,continue=continue)
}
arimaSelect <- function(series, order=c(13,0,0), seasonal=list(order=c(2,0,0),period=12), include.mean=F){
nrc <- order[1]+order[3]+seasonal$order[1]+seasonal$order[3]
coeff <- matrix(NA, nrow=nrc*2, ncol=nrc)
pval <- matrix(NA, nrow=nrc*2, ncol=nrc)
mylist <- rep(list(NULL), nrc)
names <- NULL
if(order[1] > 0) names <- paste('ar',1:order[1],sep='')
if(order[3] > 0) names <- c( names , paste('ma',1:order[3],sep='') )
if(seasonal$order[1] > 0) names <- c(names, paste('sar',1:seasonal$order[1],sep=''))
if(seasonal$order[3] > 0) names <- c(names, paste('sma',1:seasonal$order[3],sep=''))
arima.out <- arima(series, order=order, seasonal=seasonal, include.mean=include.mean, method='ML')
mylist[[1]] <- arima.out
last.arma <- armaGR(arima.out, names, length(series))
mystop <- FALSE
i <- 1
coeff[i,] <- last.arma[[1]][,1]
pval [i,] <- last.arma[[1]][,4]
i <- 2
aic <- arima.out$aic
while(!mystop){
mylist[[i]] <- arima.out
arima.out <- arima(series, order=order, seasonal=seasonal, include.mean=include.mean, method='ML', fixed=last.arma$next.vector)
aic <- c(aic, arima.out$aic)
last.arma <- armaGR(arima.out, names, length(series))
mystop <- !last.arma$continue
coeff[i,] <- last.arma[[1]][,1]
pval [i,] <- last.arma[[1]][,4]
i <- i+1
}
list(coeff, pval, mylist, aic=aic)
}
arimaSelectplot <- function(arimaSelect.out,noms,choix){
noms <- names(arimaSelect.out[[3]][[1]]$coef)
coeff <- arimaSelect.out[[1]]
k <- min(which(is.na(coeff[,1])))-1
coeff <- coeff[1:k,]
pval <- arimaSelect.out[[2]][1:k,]
aic <- arimaSelect.out$aic[1:k]
coeff[coeff==0] <- NA
n <- ncol(coeff)
if(missing(choix)) choix <- k
layout(matrix(c(1,1,1,2,
3,3,3,2,
3,3,3,4,
5,6,7,7),nr=4),
widths=c(10,35,45,15),
heights=c(30,30,15,15))
couleurs <- rainbow(75)[1:50]#(50)
ticks <- pretty(coeff)
par(mar=c(1,1,3,1))
plot(aic,k:1-.5,type='o',pch=21,bg='blue',cex=2,axes=F,lty=2,xpd=NA)
points(aic[choix],k-choix+.5,pch=21,cex=4,bg=2,xpd=NA)
title('aic',line=2)
par(mar=c(3,0,0,0))
plot(0,axes=F,xlab='',ylab='',xlim=range(ticks),ylim=c(.1,1))
rect(xleft = min(ticks) + (0:49)/50*(max(ticks)-min(ticks)),
xright = min(ticks) + (1:50)/50*(max(ticks)-min(ticks)),
ytop = rep(1,50),
ybottom= rep(0,50),col=couleurs,border=NA)
axis(1,ticks)
rect(xleft=min(ticks),xright=max(ticks),ytop=1,ybottom=0)
text(mean(coeff,na.rm=T),.5,'coefficients',cex=2,font=2)
par(mar=c(1,1,3,1))
image(1:n,1:k,t(coeff[k:1,]),axes=F,col=couleurs,zlim=range(ticks))
for(i in 1:n) for(j in 1:k) if(!is.na(coeff[j,i])) {
if(pval[j,i]<.01) symb = 'green'
else if( (pval[j,i]<.05) & (pval[j,i]>=.01)) symb = 'orange'
else if( (pval[j,i]<.1) & (pval[j,i]>=.05)) symb = 'red'
else symb = 'black'
polygon(c(i+.5 ,i+.2 ,i+.5 ,i+.5),
c(k-j+0.5,k-j+0.5,k-j+0.8,k-j+0.5),
col=symb)
if(j==choix) {
rect(xleft=i-.5,
xright=i+.5,
ybottom=k-j+1.5,
ytop=k-j+.5,
lwd=4)
text(i,
k-j+1,
round(coeff[j,i],2),
cex=1.2,
font=2)
}
else{
rect(xleft=i-.5,xright=i+.5,ybottom=k-j+1.5,ytop=k-j+.5)
text(i,k-j+1,round(coeff[j,i],2),cex=1.2,font=1)
}
}
axis(3,1:n,noms)
par(mar=c(0.5,0,0,0.5))
plot(0,axes=F,xlab='',ylab='',type='n',xlim=c(0,8),ylim=c(-.2,.8))
cols <- c('green','orange','red','black')
niv <- c('0','0.01','0.05','0.1')
for(i in 0:3){
polygon(c(1+2*i ,1+2*i ,1+2*i-.5 ,1+2*i),
c(.4 ,.7 , .4 , .4),
col=cols[i+1])
text(2*i,0.5,niv[i+1],cex=1.5)
}
text(8,.5,1,cex=1.5)
text(4,0,'p-value',cex=2)
box()
residus <- arimaSelect.out[[3]][[choix]]$res
par(mar=c(1,2,4,1))
acf(residus,main='')
title('acf',line=.5)
par(mar=c(1,2,4,1))
pacf(residus,main='')
title('pacf',line=.5)
par(mar=c(2,2,4,1))
qqnorm(residus,main='')
title('qq-norm',line=.5)
qqline(residus)
residus
}
if (par2 == 0) x <- log(x)
if (par2 != 0) x <- x^par2
(selection <- arimaSelect(x, order=c(par6,par3,par7), seasonal=list(order=c(par8,par4,par9), period=par5)))
bitmap(file='test1.png')
resid <- arimaSelectplot(selection)
dev.off()
resid
bitmap(file='test2.png')
acf(resid,length(resid)/2, main='Residual Autocorrelation Function')
dev.off()
bitmap(file='test3.png')
pacf(resid,length(resid)/2, main='Residual Partial Autocorrelation Function')
dev.off()
bitmap(file='test4.png')
cpgram(resid, main='Residual Cumulative Periodogram')
dev.off()
bitmap(file='test5.png')
hist(resid, main='Residual Histogram', xlab='values of Residuals')
dev.off()
bitmap(file='test6.png')
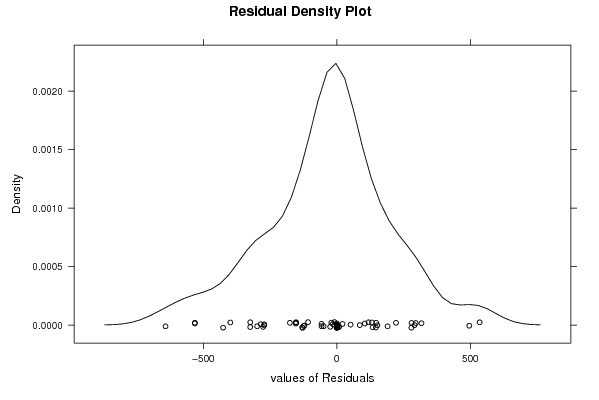
densityplot(~resid,col='black',main='Residual Density Plot', xlab='values of Residuals')
dev.off()
bitmap(file='test7.png')
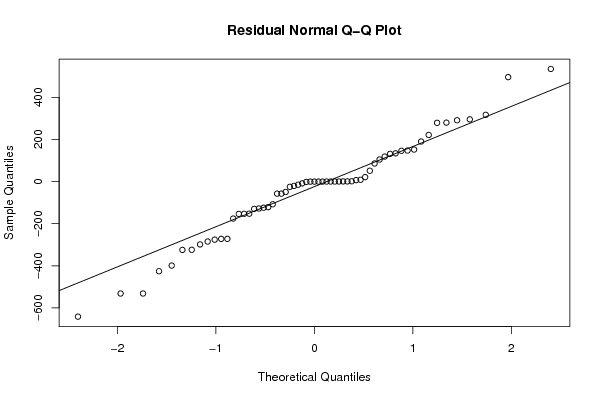
qqnorm(resid, main='Residual Normal Q-Q Plot')
qqline(resid)
dev.off()
ncols <- length(selection[[1]][1,])
nrows <- length(selection[[2]][,1])-1
load(file='createtable')
a<-table.start()
a<-table.row.start(a)
a<-table.element(a,'ARIMA Parameter Estimation and Backward Selection', ncols+1,TRUE)
a<-table.row.end(a)
a<-table.row.start(a)
a<-table.element(a,'Iteration', header=TRUE)
for (i in 1:ncols) {
a<-table.element(a,names(selection[[3]][[1]]$coef)[i],header=TRUE)
}
a<-table.row.end(a)
for (j in 1:nrows) {
a<-table.row.start(a)
mydum <- 'Estimates ('
mydum <- paste(mydum,j)
mydum <- paste(mydum,')')
a<-table.element(a,mydum, header=TRUE)
for (i in 1:ncols) {
a<-table.element(a,round(selection[[1]][j,i],4))
}
a<-table.row.end(a)
a<-table.row.start(a)
a<-table.element(a,'(p-val)', header=TRUE)
for (i in 1:ncols) {
mydum <- '('
mydum <- paste(mydum,round(selection[[2]][j,i],4),sep='')
mydum <- paste(mydum,')')
a<-table.element(a,mydum)
}
a<-table.row.end(a)
}
a<-table.end(a)
table.save(a,file='mytable.tab')
a<-table.start()
a<-table.row.start(a)
a<-table.element(a,'Estimated ARIMA Residuals', 1,TRUE)
a<-table.row.end(a)
a<-table.row.start(a)
a<-table.element(a,'Value', 1,TRUE)
a<-table.row.end(a)
for (i in (par4*par5+par3):length(resid)) {
a<-table.row.start(a)
a<-table.element(a,resid[i])
a<-table.row.end(a)
}
a<-table.end(a)
table.save(a,file='mytable1.tab')