| Multiple Linear Regression - Estimated Regression Equation |
| Werkzoekend[t] = + 209400.287969295 + 34.5996594276739Bouw[t] -4.21531532225463Auto[t] + 0.428751010829713Krediet[t] + 50230.3882566328M1[t] + 52158.6967352739M2[t] + 49001.5473624691M3[t] + 32176.4747719479M4[t] + 21960.4676447585M5[t] -17646.9872676785M6[t] + 70509.793065085M7[t] + 54730.6017553894M8[t] + 41849.4634677005M9[t] + 38938.8730270538M10[t] + 8305.34542181486M11[t] + e[t] |
| Multiple Linear Regression - Ordinary Least Squares | |||||
| Variable | Parameter | S.D. | T-STAT H0: parameter = 0 | 2-tail p-value | 1-tail p-value |
| (Intercept) | 209400.287969295 | 50245.948141 | 4.1675 | 0.000134 | 6.7e-05 |
| Bouw | 34.5996594276739 | 4.942389 | 7.0006 | 0 | 0 |
| Auto | -4.21531532225463 | 1.573651 | -2.6787 | 0.010217 | 0.005109 |
| Krediet | 0.428751010829713 | 0.045606 | 9.4013 | 0 | 0 |
| M1 | 50230.3882566328 | 14831.822937 | 3.3867 | 0.001458 | 0.000729 |
| M2 | 52158.6967352739 | 16153.822204 | 3.2289 | 0.002295 | 0.001148 |
| M3 | 49001.5473624691 | 14633.167771 | 3.3487 | 0.001628 | 0.000814 |
| M4 | 32176.4747719479 | 13187.896006 | 2.4398 | 0.018607 | 0.009303 |
| M5 | 21960.4676447585 | 16094.576952 | 1.3645 | 0.17906 | 0.08953 |
| M6 | -17646.9872676785 | 24072.077946 | -0.7331 | 0.467223 | 0.233612 |
| M7 | 70509.793065085 | 15421.784964 | 4.5721 | 3.6e-05 | 1.8e-05 |
| M8 | 54730.6017553894 | 13482.87988 | 4.0593 | 0.000189 | 9.5e-05 |
| M9 | 41849.4634677005 | 14981.511368 | 2.7934 | 0.007577 | 0.003788 |
| M10 | 38938.8730270538 | 13462.095109 | 2.8925 | 0.005821 | 0.00291 |
| M11 | 8305.34542181486 | 12603.550445 | 0.659 | 0.513201 | 0.256601 |
| Multiple Linear Regression - Regression Statistics | |
| Multiple R | 0.914421890058059 |
| R-squared | 0.836167393017353 |
| Adjusted R-squared | 0.786305295240026 |
| F-TEST (value) | 16.7695991602978 |
| F-TEST (DF numerator) | 14 |
| F-TEST (DF denominator) | 46 |
| p-value | 1.45661260830821e-13 |
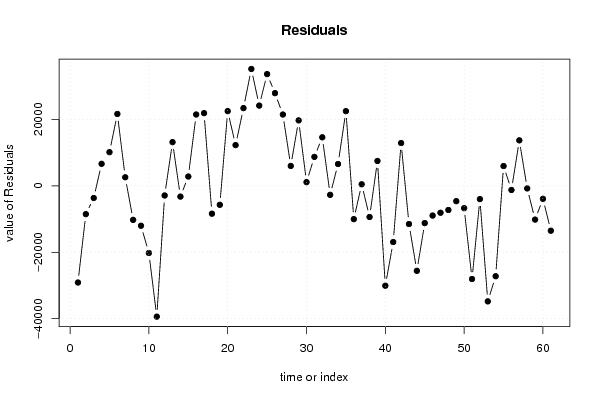
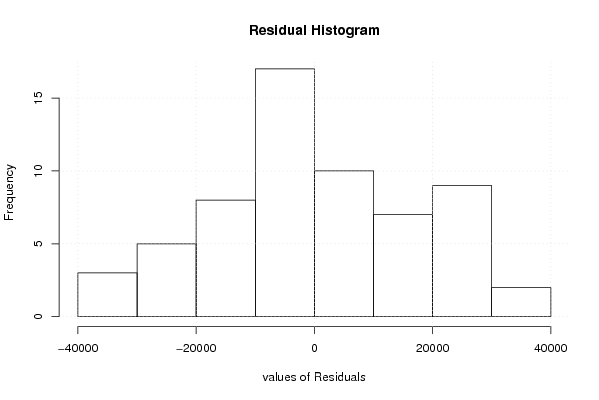
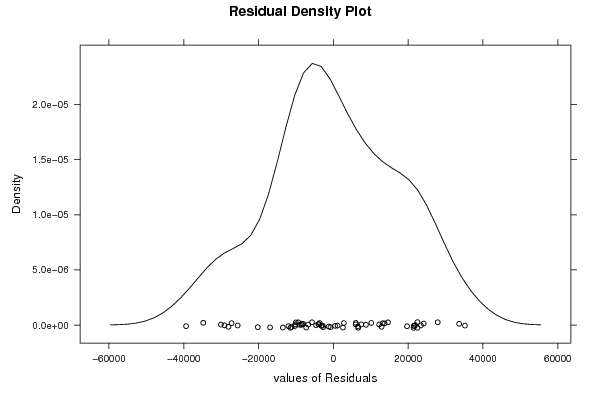
| Multiple Linear Regression - Residual Statistics | |
| Residual Standard Deviation | 19632.4366647768 |
| Sum Squared Residuals | 17729898192.2376 |
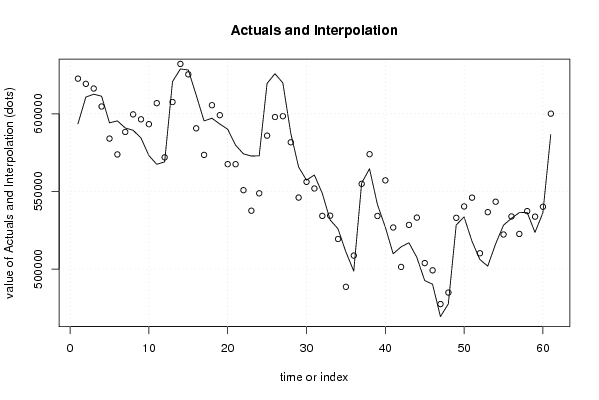
| Multiple Linear Regression - Actuals, Interpolation, and Residuals | |||
| Time or Index | Actuals | Interpolation Forecast | Residuals Prediction Error |
| 1 | 593530 | 622637.427016828 | -29107.4270168276 |
| 2 | 610763 | 619293.158238804 | -8530.15823880356 |
| 3 | 612613 | 616287.861549253 | -3674.86154925329 |
| 4 | 611324 | 604704.005373442 | 6619.99462655826 |
| 5 | 594167 | 584037.553789624 | 10129.4462103755 |
| 6 | 595454 | 573831.325204607 | 21622.6747953927 |
| 7 | 590865 | 588299.988611049 | 2565.01138895091 |
| 8 | 589379 | 599631.454689424 | -10252.4546894243 |
| 9 | 584428 | 596443.59538871 | -12015.5953887096 |
| 10 | 573100 | 593317.435136088 | -20217.4351360879 |
| 11 | 567456 | 606841.761714664 | -39385.7617146636 |
| 12 | 569028 | 571941.440757504 | -2913.44075750436 |
| 13 | 620735 | 607581.263916315 | 13153.7360836850 |
| 14 | 628884 | 632130.583840771 | -3246.5838407711 |
| 15 | 628232 | 625433.462187913 | 2798.53781208656 |
| 16 | 612117 | 590650.790148172 | 21466.2098518277 |
| 17 | 595404 | 573523.58575504 | 21880.4142449599 |
| 18 | 597141 | 605531.235745682 | -8390.23574568201 |
| 19 | 593408 | 599125.61170229 | -5717.61170229043 |
| 20 | 590072 | 567583.664373484 | 22488.3356265165 |
| 21 | 579799 | 567540.173613213 | 12258.8263867865 |
| 22 | 574205 | 550809.575645171 | 23395.424354829 |
| 23 | 572775 | 537595.202569972 | 35179.7974300275 |
| 24 | 572942 | 548793.442296577 | 24148.5577034234 |
| 25 | 619567 | 585931.527019620 | 33635.4729803804 |
| 26 | 625809 | 597913.046333092 | 27895.9536669076 |
| 27 | 619916 | 598459.583419643 | 21456.4165803575 |
| 28 | 587625 | 581640.523493718 | 5984.47650628174 |
| 29 | 565742 | 546045.886619663 | 19696.1133803371 |
| 30 | 557274 | 556165.441890990 | 1108.55810901047 |
| 31 | 560576 | 551868.964403215 | 8707.03559678461 |
| 32 | 548854 | 534252.4635326 | 14601.5364674001 |
| 33 | 531673 | 534387.403942674 | -2714.40394267437 |
| 34 | 525919 | 519357.551654485 | 6561.44834551483 |
| 35 | 511038 | 488561.314662401 | 22476.6853375991 |
| 36 | 498662 | 508697.729698452 | -10035.7296984524 |
| 37 | 555362 | 554907.028066459 | 454.971933541107 |
| 38 | 564591 | 573978.491670353 | -9387.49167035267 |
| 39 | 541657 | 534183.280401702 | 7473.71959829783 |
| 40 | 527070 | 557140.091496697 | -30070.0914966966 |
| 41 | 509846 | 526770.43292249 | -16924.43292249 |
| 42 | 514258 | 501378.838880535 | 12879.1611194645 |
| 43 | 516922 | 528429.240432233 | -11507.2404322333 |
| 44 | 507561 | 533149.785396111 | -25588.7853961110 |
| 45 | 492622 | 503843.390907396 | -11221.3909073963 |
| 46 | 490243 | 499197.453193739 | -8954.45319373926 |
| 47 | 469357 | 477460.251457931 | -8103.25145793148 |
| 48 | 477580 | 484859.118209351 | -7279.1182093508 |
| 49 | 528379 | 533004.325558074 | -4625.32555807404 |
| 50 | 533590 | 540321.71991698 | -6731.71991698028 |
| 51 | 517945 | 545998.812441489 | -28053.8124414886 |
| 52 | 506174 | 510174.589487971 | -4000.58948797108 |
| 53 | 501866 | 536647.540913183 | -34781.5409131825 |
| 54 | 516141 | 543361.158278186 | -27220.1582781856 |
| 55 | 528222 | 522269.194851212 | 5952.80514878816 |
| 56 | 532638 | 533886.632008381 | -1248.63200838119 |
| 57 | 536322 | 522629.436148006 | 13692.5638519938 |
| 58 | 536535 | 537319.984370517 | -784.984370516744 |
| 59 | 523597 | 533764.469595032 | -10167.4695950316 |
| 60 | 536214 | 540134.269038116 | -3920.26903811579 |
| 61 | 586570 | 600081.428422705 | -13511.4284227048 |
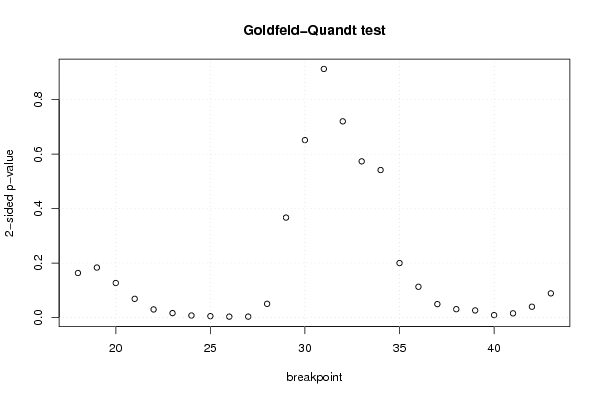
| Goldfeld-Quandt test for Heteroskedasticity | |||
| p-values | Alternative Hypothesis | ||
| breakpoint index | greater | 2-sided | less |
| 18 | 0.0817711613951422 | 0.163542322790284 | 0.918228838604858 |
| 19 | 0.0917454015935123 | 0.183490803187025 | 0.908254598406488 |
| 20 | 0.0633702450794417 | 0.126740490158883 | 0.936629754920558 |
| 21 | 0.0343175640135565 | 0.068635128027113 | 0.965682435986444 |
| 22 | 0.0148272779477321 | 0.0296545558954643 | 0.985172722052268 |
| 23 | 0.00807449433868457 | 0.0161489886773691 | 0.991925505661315 |
| 24 | 0.00367425671240134 | 0.00734851342480268 | 0.9963257432876 |
| 25 | 0.00249307230379243 | 0.00498614460758486 | 0.997506927696208 |
| 26 | 0.00156640502875234 | 0.00313281005750468 | 0.998433594971248 |
| 27 | 0.00160441056250040 | 0.00320882112500081 | 0.9983955894375 |
| 28 | 0.0251434788764243 | 0.0502869577528487 | 0.974856521123576 |
| 29 | 0.183566415808004 | 0.367132831616007 | 0.816433584191996 |
| 30 | 0.325891201245336 | 0.651782402490672 | 0.674108798754664 |
| 31 | 0.456554866607715 | 0.91310973321543 | 0.543445133392285 |
| 32 | 0.639641961218244 | 0.720716077563511 | 0.360358038781756 |
| 33 | 0.713145785291525 | 0.573708429416951 | 0.286854214708475 |
| 34 | 0.729152300445538 | 0.541695399108925 | 0.270847699554462 |
| 35 | 0.899997431310376 | 0.200005137379249 | 0.100002568689624 |
| 36 | 0.943571206852178 | 0.112857586295644 | 0.0564287931478219 |
| 37 | 0.97542751957891 | 0.0491449608421814 | 0.0245724804210907 |
| 38 | 0.984710736830297 | 0.030578526339407 | 0.0152892631697035 |
| 39 | 0.986980537243881 | 0.026038925512238 | 0.013019462756119 |
| 40 | 0.995596105729697 | 0.00880778854060663 | 0.00440389427030332 |
| 41 | 0.99230413576598 | 0.0153917284680387 | 0.00769586423401936 |
| 42 | 0.980229973729025 | 0.0395400525419498 | 0.0197700262709749 |
| 43 | 0.955617589817132 | 0.0887648203657354 | 0.0443824101828677 |
| Meta Analysis of Goldfeld-Quandt test for Heteroskedasticity | |||
| Description | # significant tests | % significant tests | OK/NOK |
| 1% type I error level | 5 | 0.192307692307692 | NOK |
| 5% type I error level | 12 | 0.461538461538462 | NOK |
| 10% type I error level | 15 | 0.576923076923077 | NOK |