| Multiple Linear Regression - Estimated Regression Equation |
| Werkzoekend[t] = + 434529.160361769 + 10.2471001027768Bouw[t] -1.70629265950963Auto[t] + 0.252198183143766Krediet[t] -1065.96796545348t + e[t] |
| Multiple Linear Regression - Ordinary Least Squares | |||||
| Variable | Parameter | S.D. | T-STAT H0: parameter = 0 | 2-tail p-value | 1-tail p-value |
| (Intercept) | 434529.160361769 | 70188.97008 | 6.1908 | 0 | 0 |
| Bouw | 10.2471001027768 | 6.152758 | 1.6654 | 0.101409 | 0.050704 |
| Auto | -1.70629265950963 | 0.590407 | -2.89 | 0.005471 | 0.002736 |
| Krediet | 0.252198183143766 | 0.081582 | 3.0914 | 0.003103 | 0.001551 |
| t | -1065.96796545348 | 290.63326 | -3.6677 | 0.000546 | 0.000273 |
| Multiple Linear Regression - Regression Statistics | |
| Multiple R | 0.82249180459475 |
| R-squared | 0.676492768625529 |
| Adjusted R-squared | 0.653385109241639 |
| F-TEST (value) | 29.2756941491503 |
| F-TEST (DF numerator) | 4 |
| F-TEST (DF denominator) | 56 |
| p-value | 3.77142761465166e-13 |
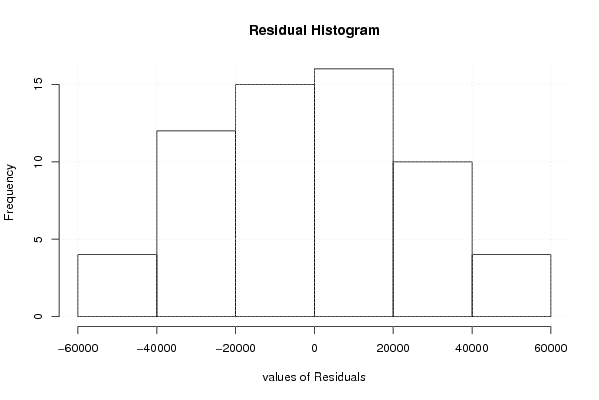
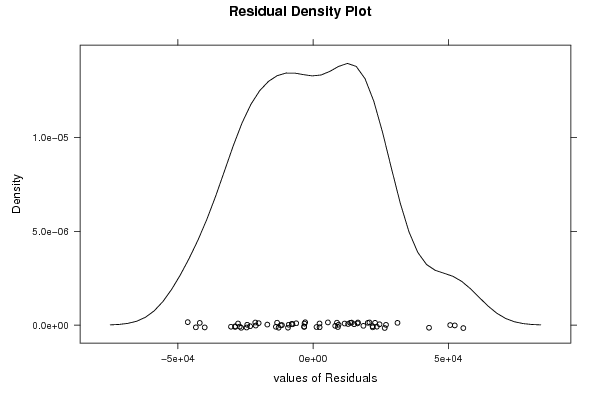
| Multiple Linear Regression - Residual Statistics | |
| Residual Standard Deviation | 25003.5073243768 |
| Sum Squared Residuals | 35009821197.1293 |
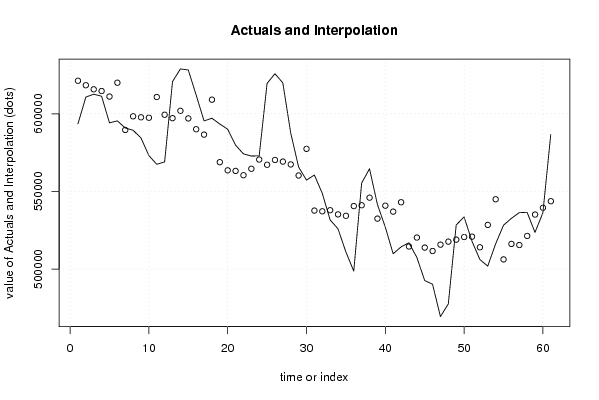
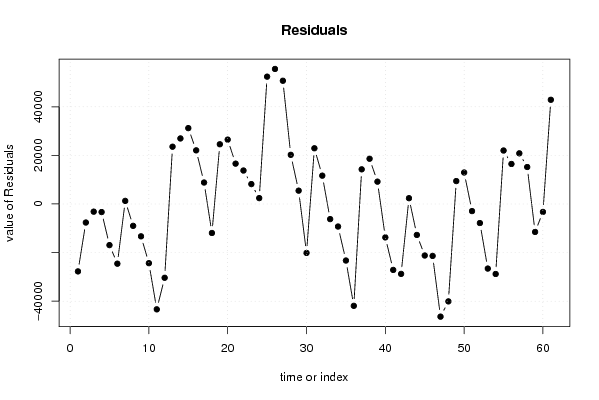
| Multiple Linear Regression - Actuals, Interpolation, and Residuals | |||
| Time or Index | Actuals | Interpolation Forecast | Residuals Prediction Error |
| 1 | 593530 | 621278.962933186 | -27748.9629331861 |
| 2 | 610763 | 618397.596108931 | -7634.5961089306 |
| 3 | 612613 | 615778.614140018 | -3165.61414001825 |
| 4 | 611324 | 614651.654316618 | -3327.65431661761 |
| 5 | 594167 | 611091.885144162 | -16924.8851441618 |
| 6 | 595454 | 620021.414385982 | -24567.4143859823 |
| 7 | 590865 | 589600.32348823 | 1264.67651176940 |
| 8 | 589379 | 598380.832689932 | -9001.8326899321 |
| 9 | 584428 | 597743.825377958 | -13315.8253779581 |
| 10 | 573100 | 597460.292481855 | -24360.292481855 |
| 11 | 567456 | 610808.912065485 | -43352.912065485 |
| 12 | 569028 | 599394.077189691 | -30366.0771896911 |
| 13 | 620735 | 597169.484366529 | 23565.5156334712 |
| 14 | 628884 | 601923.333476338 | 26960.6665236618 |
| 15 | 628232 | 597026.929166896 | 31205.0708331039 |
| 16 | 612117 | 590053.662370529 | 22063.3376294709 |
| 17 | 595404 | 586580.301099297 | 8823.69890070334 |
| 18 | 597141 | 609082.762014106 | -11941.7620141063 |
| 19 | 593408 | 568840.960035669 | 24567.039964331 |
| 20 | 590072 | 563591.226360977 | 26480.7736390233 |
| 21 | 579799 | 563211.203002009 | 16587.7969979911 |
| 22 | 574205 | 560445.611571188 | 13759.3884288123 |
| 23 | 572775 | 564595.34373025 | 8179.6562697502 |
| 24 | 572942 | 570535.292421833 | 2406.70757816740 |
| 25 | 619567 | 567179.873960075 | 52387.1260399255 |
| 26 | 625809 | 570254.606249162 | 55554.3937508377 |
| 27 | 619916 | 569215.930343024 | 50700.0696569756 |
| 28 | 587625 | 567400.559650892 | 20224.440349108 |
| 29 | 565742 | 560263.854076261 | 5478.14592373859 |
| 30 | 557274 | 577410.442604054 | -20136.4426040538 |
| 31 | 560576 | 537663.355770166 | 22912.6442298337 |
| 32 | 548854 | 537204.974253541 | 11649.0257464589 |
| 33 | 531673 | 537901.326499465 | -6228.32649946477 |
| 34 | 525919 | 535206.959549555 | -9287.95954955498 |
| 35 | 511038 | 534307.224635354 | -23269.2246353542 |
| 36 | 498662 | 540572.31709213 | -41910.3170921304 |
| 37 | 555362 | 541110.896448186 | 14251.1035518145 |
| 38 | 564591 | 545981.947829336 | 18609.0521706636 |
| 39 | 541657 | 532477.925725005 | 9179.07427499488 |
| 40 | 527070 | 540827.127008783 | -13757.1270087830 |
| 41 | 509846 | 536983.880547292 | -27137.8805472923 |
| 42 | 514258 | 543032.460466743 | -28774.460466743 |
| 43 | 516922 | 514538.216471078 | 2383.78352892249 |
| 44 | 507561 | 520302.862415197 | -12741.8624151969 |
| 45 | 492622 | 513829.088024233 | -21207.0880242327 |
| 46 | 490243 | 511616.392791107 | -21373.392791107 |
| 47 | 469357 | 515718.931057956 | -46361.9310579564 |
| 48 | 477580 | 517657.763052394 | -40077.7630523942 |
| 49 | 528379 | 518959.379964803 | 9419.6200351969 |
| 50 | 533590 | 520640.262303227 | 12949.737696773 |
| 51 | 517945 | 520869.950465061 | -2924.95046506124 |
| 52 | 506174 | 514023.272985714 | -7849.27298571422 |
| 53 | 501866 | 528439.970399457 | -26573.9703994567 |
| 54 | 516141 | 544951.379178959 | -28810.3791789592 |
| 55 | 528222 | 506235.23069208 | 21986.7693079198 |
| 56 | 532638 | 516183.039345462 | 16454.9606545381 |
| 57 | 536322 | 515484.337340401 | 20837.6626595988 |
| 58 | 536535 | 521328.453261719 | 15206.5467382811 |
| 59 | 523597 | 535113.501282521 | -11516.5012825209 |
| 60 | 536214 | 539482.800828889 | -3268.80082888884 |
| 61 | 586570 | 543703.005493048 | 42866.9945069522 |
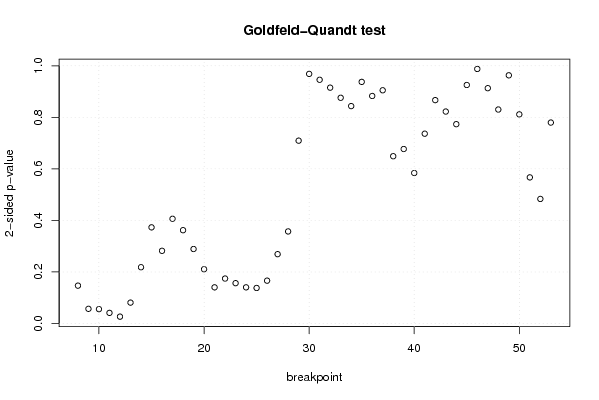
| Goldfeld-Quandt test for Heteroskedasticity | |||
| p-values | Alternative Hypothesis | ||
| breakpoint index | greater | 2-sided | less |
| 8 | 0.073436405855734 | 0.146872811711468 | 0.926563594144266 |
| 9 | 0.0284711344887235 | 0.056942268977447 | 0.971528865511276 |
| 10 | 0.0278738622093116 | 0.0557477244186232 | 0.972126137790688 |
| 11 | 0.0206373756351975 | 0.041274751270395 | 0.979362624364803 |
| 12 | 0.0132841451571472 | 0.0265682903142945 | 0.986715854842853 |
| 13 | 0.040493346550204 | 0.080986693100408 | 0.959506653449796 |
| 14 | 0.109199108475342 | 0.218398216950683 | 0.890800891524658 |
| 15 | 0.186569701016654 | 0.373139402033308 | 0.813430298983346 |
| 16 | 0.140983648457482 | 0.281967296914964 | 0.859016351542518 |
| 17 | 0.203180427237826 | 0.406360854475651 | 0.796819572762174 |
| 18 | 0.181040216316976 | 0.362080432633952 | 0.818959783683024 |
| 19 | 0.144514194545983 | 0.289028389091965 | 0.855485805454017 |
| 20 | 0.105337218279214 | 0.210674436558429 | 0.894662781720786 |
| 21 | 0.0701655183609203 | 0.140331036721841 | 0.92983448163908 |
| 22 | 0.0872059570089358 | 0.174411914017872 | 0.912794042991064 |
| 23 | 0.0782480275283909 | 0.156496055056782 | 0.921751972471609 |
| 24 | 0.0701573465763624 | 0.140314693152725 | 0.929842653423638 |
| 25 | 0.0689438080933335 | 0.137887616186667 | 0.931056191906667 |
| 26 | 0.0831196025866649 | 0.166239205173330 | 0.916880397413335 |
| 27 | 0.134519148971220 | 0.269038297942441 | 0.86548085102878 |
| 28 | 0.178632958404967 | 0.357265916809934 | 0.821367041595033 |
| 29 | 0.354718296125004 | 0.709436592250007 | 0.645281703874996 |
| 30 | 0.484239741142803 | 0.968479482285605 | 0.515760258857197 |
| 31 | 0.472861994000333 | 0.945723988000665 | 0.527138005999667 |
| 32 | 0.457569131927338 | 0.915138263854676 | 0.542430868072662 |
| 33 | 0.437935693445563 | 0.875871386891125 | 0.562064306554437 |
| 34 | 0.42181893472493 | 0.84363786944986 | 0.57818106527507 |
| 35 | 0.468783545510404 | 0.937567091020807 | 0.531216454489596 |
| 36 | 0.558588518880511 | 0.882822962238978 | 0.441411481119489 |
| 37 | 0.547500262695162 | 0.904999474609676 | 0.452499737304838 |
| 38 | 0.675457741927061 | 0.649084516145877 | 0.324542258072939 |
| 39 | 0.661482364460475 | 0.67703527107905 | 0.338517635539525 |
| 40 | 0.708036857870193 | 0.583926284259615 | 0.291963142129807 |
| 41 | 0.631761188477681 | 0.736477623044637 | 0.368238811522319 |
| 42 | 0.566617524304563 | 0.866764951390873 | 0.433382475695437 |
| 43 | 0.588772660829171 | 0.822454678341659 | 0.411227339170829 |
| 44 | 0.613270680324571 | 0.773458639350858 | 0.386729319675429 |
| 45 | 0.537247403549767 | 0.925505192900466 | 0.462752596450233 |
| 46 | 0.493873072010079 | 0.987746144020157 | 0.506126927989921 |
| 47 | 0.543430706442489 | 0.913138587115021 | 0.456569293557511 |
| 48 | 0.584853191930117 | 0.830293616139765 | 0.415146808069883 |
| 49 | 0.518478472431952 | 0.963043055136097 | 0.481521527568049 |
| 50 | 0.594250150830763 | 0.811499698338474 | 0.405749849169237 |
| 51 | 0.716507242382752 | 0.566985515234496 | 0.283492757617248 |
| 52 | 0.758308639920363 | 0.483382720159274 | 0.241691360079637 |
| 53 | 0.610155892520195 | 0.77968821495961 | 0.389844107479805 |
| Meta Analysis of Goldfeld-Quandt test for Heteroskedasticity | |||
| Description | # significant tests | % significant tests | OK/NOK |
| 1% type I error level | 0 | 0 | OK |
| 5% type I error level | 2 | 0.0434782608695652 | OK |
| 10% type I error level | 5 | 0.108695652173913 | NOK |