Free Statistics

of Irreproducible Research!

Author's title

Author*The author of this computation has been verified*
R Software Modulerwasp_percentiles.wasp
Title produced by softwarePercentiles
Date of computationSat, 12 Dec 2009 11:00:42 -0700
Cite this page as followsStatistical Computations at FreeStatistics.org, Office for Research Development and Education, URL https://freestatistics.org/blog/index.php?v=date/2009/Dec/12/t1260641070wuqgatuw3hbanu0.htm/, Retrieved Mon, 29 Apr 2024 11:09:54 +0000
Statistical Computations at FreeStatistics.org, Office for Research Development and Education, URL https://freestatistics.org/blog/index.php?pk=67105, Retrieved Mon, 29 Apr 2024 11:09:54 +0000
QR Codes:

Original text written by user:
IsPrivate?No (this computation is public)
User-defined keywords
Estimated Impact145
Family? (F = Feedback message, R = changed R code, M = changed R Module, P = changed Parameters, D = changed Data)
-     [Standard Deviation-Mean Plot] [dollarkoers] [2007-11-29 14:04:00] [707a919fab5d6f3020ea3c395672cd86]
- RMPD  [Percentiles] [] [2008-12-21 13:02:48] [0e3da40906c04c6abfe5eb434331b3f1]
-  M D      [Percentiles] [] [2009-12-12 18:00:42] [90c9838c596c9c0a7d0d4c412ffe5b98] [Current]
Feedback Forum

Post a new message
Dataseries X:
6802.96
7132.68
7073.29
7264.5
7105.33
7218.71
7225.72
7354.25
7745.46
8070.26
8366.33
8667.51
8854.34
9218.1
9332.9
9358.31
9248.66
9401.2
9652.04
9957.38
10110.63
10169.26
10343.78
10750.21
11337.5
11786.96
12083.04
12007.74
11745.93
11051.51
11445.9
11924.88
12247.63
12690.91
12910.7
13202.12
13654.67
13862.82
13523.93
14211.17
14510.35
14289.23
14111.82
13086.59
13351.54
13747.69
12855.61
12926.93
12121.95
11731.65
11639.51
12163.78
12029.53
11234.18
9852.13
9709.04
9332.75
7108.6
6691.49
6143.05


Summary of computational transaction
Raw Inputview raw input (R code)
Raw Outputview raw output of R engine
Computing time1 seconds
R Server'Gwilym Jenkins' @ 72.249.127.135

\begin{tabular}{lllllllll}
\hline
Summary of computational transaction \tabularnewline
Raw Input & view raw input (R code)  \tabularnewline
Raw Output & view raw output of R engine  \tabularnewline
Computing time & 1 seconds \tabularnewline
R Server & 'Gwilym Jenkins' @ 72.249.127.135 \tabularnewline
\hline
\end{tabular}
%Source: https://freestatistics.org/blog/index.php?pk=67105&T=0

[TABLE]
[ROW][C]Summary of computational transaction[/C][/ROW]
[ROW][C]Raw Input[/C][C]view raw input (R code) [/C][/ROW]
[ROW][C]Raw Output[/C][C]view raw output of R engine [/C][/ROW]
[ROW][C]Computing time[/C][C]1 seconds[/C][/ROW]
[ROW][C]R Server[/C][C]'Gwilym Jenkins' @ 72.249.127.135[/C][/ROW]
[/TABLE]
Source: https://freestatistics.org/blog/index.php?pk=67105&T=0

Globally Unique Identifier (entire table): ba.freestatistics.org/blog/index.php?pk=67105&T=0

As an alternative you can also use a QR Code:  

The GUIDs for individual cells are displayed in the table below:

Summary of computational transaction
Raw Inputview raw input (R code)
Raw Outputview raw output of R engine
Computing time1 seconds
R Server'Gwilym Jenkins' @ 72.249.127.135


Percentiles - Ungrouped Data
pWeighted Average at XnpWeighted Average at X(n+1)pEmpirical Distribution FunctionEmpirical Distribution Function - AveragingEmpirical Distribution Function - InterpolationClosest ObservationTrue Basic - Statistics Graphics ToolkitMS Excel (old versions)
0.026252.7386263.70686691.496691.496711.55466143.056570.83326143.05
0.046736.0786740.53686802.966802.966900.27886691.496753.91326691.49
0.066965.1586981.37787073.297073.297090.59167073.296894.87227073.29
0.087098.9227101.48527105.337105.337107.68447105.337077.13487105.33
0.17108.67111.0087108.67120.647130.2727108.67130.2727108.6
0.127149.8867160.20967218.717218.717219.27087132.687191.18047132.68
0.147221.5147222.49547225.727225.727235.80287218.717221.93467225.72
0.167248.9887255.19287264.57264.57303.997264.57235.02727264.5
0.187336.37352.4557354.257354.257596.80027354.257266.2957354.25
0.27745.467810.427745.467907.868005.37745.468005.37745.46
0.228129.4748194.60948366.338366.338360.40868070.268241.98068070.26
0.248486.8028559.08528667.518667.518697.40288366.338474.75488667.51
0.268779.6088828.18388854.348854.348978.01848854.348693.66628854.34
0.289145.3489220.54489218.19218.19233.99129218.19246.21529218.1
0.39248.669273.8879248.669290.7059307.5239248.669307.5239248.66
0.329332.789332.8289332.99332.99332.8829332.759332.8229332.9
0.349343.0649351.70349358.319358.319360.88349332.99339.50669358.31
0.369384.0449399.48449401.29401.29461.40169401.29360.02569401.2
0.389601.8729662.39652.049652.049675.989652.049698.789652.04
0.49709.049766.2769709.049780.5859794.8949709.049794.8949709.04
0.429873.189917.3859957.389957.389934.2259852.139892.1259957.38
0.4410018.6810086.1110110.6310110.6310104.59957.389981.910110.63
0.4610145.80810179.731210169.2610169.2610193.692810169.2610333.308810169.26
0.4810308.87610457.580410343.7810343.7810473.837610343.7810636.409610343.78
0.510750.2110900.8610750.2110900.8610900.8610750.2110900.8610900.86
0.5211088.04411183.032411234.1811234.1811175.725611051.5111102.657611234.18
0.5411275.50811331.300811337.511337.511323.035211234.1811240.379211337.5
0.5611402.5411476.877611445.911445.911453.644411445.911608.532411445.9
0.5811600.78811674.523211639.5111639.5111659.780811639.5111696.636811639.51
0.611731.6511740.21811731.6511738.7911737.36211731.6511737.36211745.93
0.6211754.13611779.574611786.9611786.9611769.727411745.9311753.315411786.96
0.6411842.12811928.194411924.8811924.8811891.779211786.9612004.425611924.88
0.6611974.59612013.405412007.7412007.7412002.768412007.7412023.864612007.74
0.6812025.17212055.214812029.5312029.5312035.951212029.5312057.355212029.53
0.712083.0412110.27712083.0412102.49512094.71312083.0412094.71312121.95
0.7212130.31612160.433612163.7812163.7812142.028412121.9512125.296412163.78
0.7412197.3212309.689212247.6312247.6312219.12112163.7812628.850812247.63
0.7612513.59812750.20212690.9112690.9112619.985212690.9112796.31812690.91
0.7812822.6712887.562212855.6112855.6112856.711812855.6112878.747812910.7
0.812910.712923.68412910.712918.81512913.94612910.712913.94612926.93
0.8212958.86213088.900613086.5913086.5912987.600812926.9313199.809413086.59
0.8413132.80213237.980813202.1213202.1213151.286813086.5913315.679213202.12
0.8613291.77213430.839413351.5413351.5413312.690813351.5413444.630613351.54
0.8813489.45213612.833213523.9313523.9313510.138813523.9313565.766813654.67
0.913654.6713738.38813654.6713701.1813663.97213654.6713663.97213747.69
0.9213770.71613892.713862.8213862.8213779.926413747.6914081.9413862.82
0.9413962.4214145.59914111.8214111.8213977.3613862.8214177.39114111.82
0.9614171.4314254.883614211.1714211.1714175.40414211.1714245.516414289.23
0.9814273.61814461.703614289.2314289.2314275.179214289.2314337.876414510.35

\begin{tabular}{lllllllll}
\hline
Percentiles - Ungrouped Data \tabularnewline
p & Weighted Average at Xnp & Weighted Average at X(n+1)p & Empirical Distribution Function & Empirical Distribution Function - Averaging & Empirical Distribution Function - Interpolation & Closest Observation & True Basic - Statistics Graphics Toolkit & MS Excel (old versions) \tabularnewline
0.02 & 6252.738 & 6263.7068 & 6691.49 & 6691.49 & 6711.5546 & 6143.05 & 6570.8332 & 6143.05 \tabularnewline
0.04 & 6736.078 & 6740.5368 & 6802.96 & 6802.96 & 6900.2788 & 6691.49 & 6753.9132 & 6691.49 \tabularnewline
0.06 & 6965.158 & 6981.3778 & 7073.29 & 7073.29 & 7090.5916 & 7073.29 & 6894.8722 & 7073.29 \tabularnewline
0.08 & 7098.922 & 7101.4852 & 7105.33 & 7105.33 & 7107.6844 & 7105.33 & 7077.1348 & 7105.33 \tabularnewline
0.1 & 7108.6 & 7111.008 & 7108.6 & 7120.64 & 7130.272 & 7108.6 & 7130.272 & 7108.6 \tabularnewline
0.12 & 7149.886 & 7160.2096 & 7218.71 & 7218.71 & 7219.2708 & 7132.68 & 7191.1804 & 7132.68 \tabularnewline
0.14 & 7221.514 & 7222.4954 & 7225.72 & 7225.72 & 7235.8028 & 7218.71 & 7221.9346 & 7225.72 \tabularnewline
0.16 & 7248.988 & 7255.1928 & 7264.5 & 7264.5 & 7303.99 & 7264.5 & 7235.0272 & 7264.5 \tabularnewline
0.18 & 7336.3 & 7352.455 & 7354.25 & 7354.25 & 7596.8002 & 7354.25 & 7266.295 & 7354.25 \tabularnewline
0.2 & 7745.46 & 7810.42 & 7745.46 & 7907.86 & 8005.3 & 7745.46 & 8005.3 & 7745.46 \tabularnewline
0.22 & 8129.474 & 8194.6094 & 8366.33 & 8366.33 & 8360.4086 & 8070.26 & 8241.9806 & 8070.26 \tabularnewline
0.24 & 8486.802 & 8559.0852 & 8667.51 & 8667.51 & 8697.4028 & 8366.33 & 8474.7548 & 8667.51 \tabularnewline
0.26 & 8779.608 & 8828.1838 & 8854.34 & 8854.34 & 8978.0184 & 8854.34 & 8693.6662 & 8854.34 \tabularnewline
0.28 & 9145.348 & 9220.5448 & 9218.1 & 9218.1 & 9233.9912 & 9218.1 & 9246.2152 & 9218.1 \tabularnewline
0.3 & 9248.66 & 9273.887 & 9248.66 & 9290.705 & 9307.523 & 9248.66 & 9307.523 & 9248.66 \tabularnewline
0.32 & 9332.78 & 9332.828 & 9332.9 & 9332.9 & 9332.882 & 9332.75 & 9332.822 & 9332.9 \tabularnewline
0.34 & 9343.064 & 9351.7034 & 9358.31 & 9358.31 & 9360.8834 & 9332.9 & 9339.5066 & 9358.31 \tabularnewline
0.36 & 9384.044 & 9399.4844 & 9401.2 & 9401.2 & 9461.4016 & 9401.2 & 9360.0256 & 9401.2 \tabularnewline
0.38 & 9601.872 & 9662.3 & 9652.04 & 9652.04 & 9675.98 & 9652.04 & 9698.78 & 9652.04 \tabularnewline
0.4 & 9709.04 & 9766.276 & 9709.04 & 9780.585 & 9794.894 & 9709.04 & 9794.894 & 9709.04 \tabularnewline
0.42 & 9873.18 & 9917.385 & 9957.38 & 9957.38 & 9934.225 & 9852.13 & 9892.125 & 9957.38 \tabularnewline
0.44 & 10018.68 & 10086.11 & 10110.63 & 10110.63 & 10104.5 & 9957.38 & 9981.9 & 10110.63 \tabularnewline
0.46 & 10145.808 & 10179.7312 & 10169.26 & 10169.26 & 10193.6928 & 10169.26 & 10333.3088 & 10169.26 \tabularnewline
0.48 & 10308.876 & 10457.5804 & 10343.78 & 10343.78 & 10473.8376 & 10343.78 & 10636.4096 & 10343.78 \tabularnewline
0.5 & 10750.21 & 10900.86 & 10750.21 & 10900.86 & 10900.86 & 10750.21 & 10900.86 & 10900.86 \tabularnewline
0.52 & 11088.044 & 11183.0324 & 11234.18 & 11234.18 & 11175.7256 & 11051.51 & 11102.6576 & 11234.18 \tabularnewline
0.54 & 11275.508 & 11331.3008 & 11337.5 & 11337.5 & 11323.0352 & 11234.18 & 11240.3792 & 11337.5 \tabularnewline
0.56 & 11402.54 & 11476.8776 & 11445.9 & 11445.9 & 11453.6444 & 11445.9 & 11608.5324 & 11445.9 \tabularnewline
0.58 & 11600.788 & 11674.5232 & 11639.51 & 11639.51 & 11659.7808 & 11639.51 & 11696.6368 & 11639.51 \tabularnewline
0.6 & 11731.65 & 11740.218 & 11731.65 & 11738.79 & 11737.362 & 11731.65 & 11737.362 & 11745.93 \tabularnewline
0.62 & 11754.136 & 11779.5746 & 11786.96 & 11786.96 & 11769.7274 & 11745.93 & 11753.3154 & 11786.96 \tabularnewline
0.64 & 11842.128 & 11928.1944 & 11924.88 & 11924.88 & 11891.7792 & 11786.96 & 12004.4256 & 11924.88 \tabularnewline
0.66 & 11974.596 & 12013.4054 & 12007.74 & 12007.74 & 12002.7684 & 12007.74 & 12023.8646 & 12007.74 \tabularnewline
0.68 & 12025.172 & 12055.2148 & 12029.53 & 12029.53 & 12035.9512 & 12029.53 & 12057.3552 & 12029.53 \tabularnewline
0.7 & 12083.04 & 12110.277 & 12083.04 & 12102.495 & 12094.713 & 12083.04 & 12094.713 & 12121.95 \tabularnewline
0.72 & 12130.316 & 12160.4336 & 12163.78 & 12163.78 & 12142.0284 & 12121.95 & 12125.2964 & 12163.78 \tabularnewline
0.74 & 12197.32 & 12309.6892 & 12247.63 & 12247.63 & 12219.121 & 12163.78 & 12628.8508 & 12247.63 \tabularnewline
0.76 & 12513.598 & 12750.202 & 12690.91 & 12690.91 & 12619.9852 & 12690.91 & 12796.318 & 12690.91 \tabularnewline
0.78 & 12822.67 & 12887.5622 & 12855.61 & 12855.61 & 12856.7118 & 12855.61 & 12878.7478 & 12910.7 \tabularnewline
0.8 & 12910.7 & 12923.684 & 12910.7 & 12918.815 & 12913.946 & 12910.7 & 12913.946 & 12926.93 \tabularnewline
0.82 & 12958.862 & 13088.9006 & 13086.59 & 13086.59 & 12987.6008 & 12926.93 & 13199.8094 & 13086.59 \tabularnewline
0.84 & 13132.802 & 13237.9808 & 13202.12 & 13202.12 & 13151.2868 & 13086.59 & 13315.6792 & 13202.12 \tabularnewline
0.86 & 13291.772 & 13430.8394 & 13351.54 & 13351.54 & 13312.6908 & 13351.54 & 13444.6306 & 13351.54 \tabularnewline
0.88 & 13489.452 & 13612.8332 & 13523.93 & 13523.93 & 13510.1388 & 13523.93 & 13565.7668 & 13654.67 \tabularnewline
0.9 & 13654.67 & 13738.388 & 13654.67 & 13701.18 & 13663.972 & 13654.67 & 13663.972 & 13747.69 \tabularnewline
0.92 & 13770.716 & 13892.7 & 13862.82 & 13862.82 & 13779.9264 & 13747.69 & 14081.94 & 13862.82 \tabularnewline
0.94 & 13962.42 & 14145.599 & 14111.82 & 14111.82 & 13977.36 & 13862.82 & 14177.391 & 14111.82 \tabularnewline
0.96 & 14171.43 & 14254.8836 & 14211.17 & 14211.17 & 14175.404 & 14211.17 & 14245.5164 & 14289.23 \tabularnewline
0.98 & 14273.618 & 14461.7036 & 14289.23 & 14289.23 & 14275.1792 & 14289.23 & 14337.8764 & 14510.35 \tabularnewline
\hline
\end{tabular}
%Source: https://freestatistics.org/blog/index.php?pk=67105&T=1

[TABLE]
[ROW][C]Percentiles - Ungrouped Data[/C][/ROW]
[ROW][C]p[/C][C]Weighted Average at Xnp[/C][C]Weighted Average at X(n+1)p[/C][C]Empirical Distribution Function[/C][C]Empirical Distribution Function - Averaging[/C][C]Empirical Distribution Function - Interpolation[/C][C]Closest Observation[/C][C]True Basic - Statistics Graphics Toolkit[/C][C]MS Excel (old versions)[/C][/ROW]
[ROW][C]0.02[/C][C]6252.738[/C][C]6263.7068[/C][C]6691.49[/C][C]6691.49[/C][C]6711.5546[/C][C]6143.05[/C][C]6570.8332[/C][C]6143.05[/C][/ROW]
[ROW][C]0.04[/C][C]6736.078[/C][C]6740.5368[/C][C]6802.96[/C][C]6802.96[/C][C]6900.2788[/C][C]6691.49[/C][C]6753.9132[/C][C]6691.49[/C][/ROW]
[ROW][C]0.06[/C][C]6965.158[/C][C]6981.3778[/C][C]7073.29[/C][C]7073.29[/C][C]7090.5916[/C][C]7073.29[/C][C]6894.8722[/C][C]7073.29[/C][/ROW]
[ROW][C]0.08[/C][C]7098.922[/C][C]7101.4852[/C][C]7105.33[/C][C]7105.33[/C][C]7107.6844[/C][C]7105.33[/C][C]7077.1348[/C][C]7105.33[/C][/ROW]
[ROW][C]0.1[/C][C]7108.6[/C][C]7111.008[/C][C]7108.6[/C][C]7120.64[/C][C]7130.272[/C][C]7108.6[/C][C]7130.272[/C][C]7108.6[/C][/ROW]
[ROW][C]0.12[/C][C]7149.886[/C][C]7160.2096[/C][C]7218.71[/C][C]7218.71[/C][C]7219.2708[/C][C]7132.68[/C][C]7191.1804[/C][C]7132.68[/C][/ROW]
[ROW][C]0.14[/C][C]7221.514[/C][C]7222.4954[/C][C]7225.72[/C][C]7225.72[/C][C]7235.8028[/C][C]7218.71[/C][C]7221.9346[/C][C]7225.72[/C][/ROW]
[ROW][C]0.16[/C][C]7248.988[/C][C]7255.1928[/C][C]7264.5[/C][C]7264.5[/C][C]7303.99[/C][C]7264.5[/C][C]7235.0272[/C][C]7264.5[/C][/ROW]
[ROW][C]0.18[/C][C]7336.3[/C][C]7352.455[/C][C]7354.25[/C][C]7354.25[/C][C]7596.8002[/C][C]7354.25[/C][C]7266.295[/C][C]7354.25[/C][/ROW]
[ROW][C]0.2[/C][C]7745.46[/C][C]7810.42[/C][C]7745.46[/C][C]7907.86[/C][C]8005.3[/C][C]7745.46[/C][C]8005.3[/C][C]7745.46[/C][/ROW]
[ROW][C]0.22[/C][C]8129.474[/C][C]8194.6094[/C][C]8366.33[/C][C]8366.33[/C][C]8360.4086[/C][C]8070.26[/C][C]8241.9806[/C][C]8070.26[/C][/ROW]
[ROW][C]0.24[/C][C]8486.802[/C][C]8559.0852[/C][C]8667.51[/C][C]8667.51[/C][C]8697.4028[/C][C]8366.33[/C][C]8474.7548[/C][C]8667.51[/C][/ROW]
[ROW][C]0.26[/C][C]8779.608[/C][C]8828.1838[/C][C]8854.34[/C][C]8854.34[/C][C]8978.0184[/C][C]8854.34[/C][C]8693.6662[/C][C]8854.34[/C][/ROW]
[ROW][C]0.28[/C][C]9145.348[/C][C]9220.5448[/C][C]9218.1[/C][C]9218.1[/C][C]9233.9912[/C][C]9218.1[/C][C]9246.2152[/C][C]9218.1[/C][/ROW]
[ROW][C]0.3[/C][C]9248.66[/C][C]9273.887[/C][C]9248.66[/C][C]9290.705[/C][C]9307.523[/C][C]9248.66[/C][C]9307.523[/C][C]9248.66[/C][/ROW]
[ROW][C]0.32[/C][C]9332.78[/C][C]9332.828[/C][C]9332.9[/C][C]9332.9[/C][C]9332.882[/C][C]9332.75[/C][C]9332.822[/C][C]9332.9[/C][/ROW]
[ROW][C]0.34[/C][C]9343.064[/C][C]9351.7034[/C][C]9358.31[/C][C]9358.31[/C][C]9360.8834[/C][C]9332.9[/C][C]9339.5066[/C][C]9358.31[/C][/ROW]
[ROW][C]0.36[/C][C]9384.044[/C][C]9399.4844[/C][C]9401.2[/C][C]9401.2[/C][C]9461.4016[/C][C]9401.2[/C][C]9360.0256[/C][C]9401.2[/C][/ROW]
[ROW][C]0.38[/C][C]9601.872[/C][C]9662.3[/C][C]9652.04[/C][C]9652.04[/C][C]9675.98[/C][C]9652.04[/C][C]9698.78[/C][C]9652.04[/C][/ROW]
[ROW][C]0.4[/C][C]9709.04[/C][C]9766.276[/C][C]9709.04[/C][C]9780.585[/C][C]9794.894[/C][C]9709.04[/C][C]9794.894[/C][C]9709.04[/C][/ROW]
[ROW][C]0.42[/C][C]9873.18[/C][C]9917.385[/C][C]9957.38[/C][C]9957.38[/C][C]9934.225[/C][C]9852.13[/C][C]9892.125[/C][C]9957.38[/C][/ROW]
[ROW][C]0.44[/C][C]10018.68[/C][C]10086.11[/C][C]10110.63[/C][C]10110.63[/C][C]10104.5[/C][C]9957.38[/C][C]9981.9[/C][C]10110.63[/C][/ROW]
[ROW][C]0.46[/C][C]10145.808[/C][C]10179.7312[/C][C]10169.26[/C][C]10169.26[/C][C]10193.6928[/C][C]10169.26[/C][C]10333.3088[/C][C]10169.26[/C][/ROW]
[ROW][C]0.48[/C][C]10308.876[/C][C]10457.5804[/C][C]10343.78[/C][C]10343.78[/C][C]10473.8376[/C][C]10343.78[/C][C]10636.4096[/C][C]10343.78[/C][/ROW]
[ROW][C]0.5[/C][C]10750.21[/C][C]10900.86[/C][C]10750.21[/C][C]10900.86[/C][C]10900.86[/C][C]10750.21[/C][C]10900.86[/C][C]10900.86[/C][/ROW]
[ROW][C]0.52[/C][C]11088.044[/C][C]11183.0324[/C][C]11234.18[/C][C]11234.18[/C][C]11175.7256[/C][C]11051.51[/C][C]11102.6576[/C][C]11234.18[/C][/ROW]
[ROW][C]0.54[/C][C]11275.508[/C][C]11331.3008[/C][C]11337.5[/C][C]11337.5[/C][C]11323.0352[/C][C]11234.18[/C][C]11240.3792[/C][C]11337.5[/C][/ROW]
[ROW][C]0.56[/C][C]11402.54[/C][C]11476.8776[/C][C]11445.9[/C][C]11445.9[/C][C]11453.6444[/C][C]11445.9[/C][C]11608.5324[/C][C]11445.9[/C][/ROW]
[ROW][C]0.58[/C][C]11600.788[/C][C]11674.5232[/C][C]11639.51[/C][C]11639.51[/C][C]11659.7808[/C][C]11639.51[/C][C]11696.6368[/C][C]11639.51[/C][/ROW]
[ROW][C]0.6[/C][C]11731.65[/C][C]11740.218[/C][C]11731.65[/C][C]11738.79[/C][C]11737.362[/C][C]11731.65[/C][C]11737.362[/C][C]11745.93[/C][/ROW]
[ROW][C]0.62[/C][C]11754.136[/C][C]11779.5746[/C][C]11786.96[/C][C]11786.96[/C][C]11769.7274[/C][C]11745.93[/C][C]11753.3154[/C][C]11786.96[/C][/ROW]
[ROW][C]0.64[/C][C]11842.128[/C][C]11928.1944[/C][C]11924.88[/C][C]11924.88[/C][C]11891.7792[/C][C]11786.96[/C][C]12004.4256[/C][C]11924.88[/C][/ROW]
[ROW][C]0.66[/C][C]11974.596[/C][C]12013.4054[/C][C]12007.74[/C][C]12007.74[/C][C]12002.7684[/C][C]12007.74[/C][C]12023.8646[/C][C]12007.74[/C][/ROW]
[ROW][C]0.68[/C][C]12025.172[/C][C]12055.2148[/C][C]12029.53[/C][C]12029.53[/C][C]12035.9512[/C][C]12029.53[/C][C]12057.3552[/C][C]12029.53[/C][/ROW]
[ROW][C]0.7[/C][C]12083.04[/C][C]12110.277[/C][C]12083.04[/C][C]12102.495[/C][C]12094.713[/C][C]12083.04[/C][C]12094.713[/C][C]12121.95[/C][/ROW]
[ROW][C]0.72[/C][C]12130.316[/C][C]12160.4336[/C][C]12163.78[/C][C]12163.78[/C][C]12142.0284[/C][C]12121.95[/C][C]12125.2964[/C][C]12163.78[/C][/ROW]
[ROW][C]0.74[/C][C]12197.32[/C][C]12309.6892[/C][C]12247.63[/C][C]12247.63[/C][C]12219.121[/C][C]12163.78[/C][C]12628.8508[/C][C]12247.63[/C][/ROW]
[ROW][C]0.76[/C][C]12513.598[/C][C]12750.202[/C][C]12690.91[/C][C]12690.91[/C][C]12619.9852[/C][C]12690.91[/C][C]12796.318[/C][C]12690.91[/C][/ROW]
[ROW][C]0.78[/C][C]12822.67[/C][C]12887.5622[/C][C]12855.61[/C][C]12855.61[/C][C]12856.7118[/C][C]12855.61[/C][C]12878.7478[/C][C]12910.7[/C][/ROW]
[ROW][C]0.8[/C][C]12910.7[/C][C]12923.684[/C][C]12910.7[/C][C]12918.815[/C][C]12913.946[/C][C]12910.7[/C][C]12913.946[/C][C]12926.93[/C][/ROW]
[ROW][C]0.82[/C][C]12958.862[/C][C]13088.9006[/C][C]13086.59[/C][C]13086.59[/C][C]12987.6008[/C][C]12926.93[/C][C]13199.8094[/C][C]13086.59[/C][/ROW]
[ROW][C]0.84[/C][C]13132.802[/C][C]13237.9808[/C][C]13202.12[/C][C]13202.12[/C][C]13151.2868[/C][C]13086.59[/C][C]13315.6792[/C][C]13202.12[/C][/ROW]
[ROW][C]0.86[/C][C]13291.772[/C][C]13430.8394[/C][C]13351.54[/C][C]13351.54[/C][C]13312.6908[/C][C]13351.54[/C][C]13444.6306[/C][C]13351.54[/C][/ROW]
[ROW][C]0.88[/C][C]13489.452[/C][C]13612.8332[/C][C]13523.93[/C][C]13523.93[/C][C]13510.1388[/C][C]13523.93[/C][C]13565.7668[/C][C]13654.67[/C][/ROW]
[ROW][C]0.9[/C][C]13654.67[/C][C]13738.388[/C][C]13654.67[/C][C]13701.18[/C][C]13663.972[/C][C]13654.67[/C][C]13663.972[/C][C]13747.69[/C][/ROW]
[ROW][C]0.92[/C][C]13770.716[/C][C]13892.7[/C][C]13862.82[/C][C]13862.82[/C][C]13779.9264[/C][C]13747.69[/C][C]14081.94[/C][C]13862.82[/C][/ROW]
[ROW][C]0.94[/C][C]13962.42[/C][C]14145.599[/C][C]14111.82[/C][C]14111.82[/C][C]13977.36[/C][C]13862.82[/C][C]14177.391[/C][C]14111.82[/C][/ROW]
[ROW][C]0.96[/C][C]14171.43[/C][C]14254.8836[/C][C]14211.17[/C][C]14211.17[/C][C]14175.404[/C][C]14211.17[/C][C]14245.5164[/C][C]14289.23[/C][/ROW]
[ROW][C]0.98[/C][C]14273.618[/C][C]14461.7036[/C][C]14289.23[/C][C]14289.23[/C][C]14275.1792[/C][C]14289.23[/C][C]14337.8764[/C][C]14510.35[/C][/ROW]
[/TABLE]
Source: https://freestatistics.org/blog/index.php?pk=67105&T=1

Globally Unique Identifier (entire table): ba.freestatistics.org/blog/index.php?pk=67105&T=1

As an alternative you can also use a QR Code:  

The GUIDs for individual cells are displayed in the table below:

Percentiles - Ungrouped Data
pWeighted Average at XnpWeighted Average at X(n+1)pEmpirical Distribution FunctionEmpirical Distribution Function - AveragingEmpirical Distribution Function - InterpolationClosest ObservationTrue Basic - Statistics Graphics ToolkitMS Excel (old versions)
0.026252.7386263.70686691.496691.496711.55466143.056570.83326143.05
0.046736.0786740.53686802.966802.966900.27886691.496753.91326691.49
0.066965.1586981.37787073.297073.297090.59167073.296894.87227073.29
0.087098.9227101.48527105.337105.337107.68447105.337077.13487105.33
0.17108.67111.0087108.67120.647130.2727108.67130.2727108.6
0.127149.8867160.20967218.717218.717219.27087132.687191.18047132.68
0.147221.5147222.49547225.727225.727235.80287218.717221.93467225.72
0.167248.9887255.19287264.57264.57303.997264.57235.02727264.5
0.187336.37352.4557354.257354.257596.80027354.257266.2957354.25
0.27745.467810.427745.467907.868005.37745.468005.37745.46
0.228129.4748194.60948366.338366.338360.40868070.268241.98068070.26
0.248486.8028559.08528667.518667.518697.40288366.338474.75488667.51
0.268779.6088828.18388854.348854.348978.01848854.348693.66628854.34
0.289145.3489220.54489218.19218.19233.99129218.19246.21529218.1
0.39248.669273.8879248.669290.7059307.5239248.669307.5239248.66
0.329332.789332.8289332.99332.99332.8829332.759332.8229332.9
0.349343.0649351.70349358.319358.319360.88349332.99339.50669358.31
0.369384.0449399.48449401.29401.29461.40169401.29360.02569401.2
0.389601.8729662.39652.049652.049675.989652.049698.789652.04
0.49709.049766.2769709.049780.5859794.8949709.049794.8949709.04
0.429873.189917.3859957.389957.389934.2259852.139892.1259957.38
0.4410018.6810086.1110110.6310110.6310104.59957.389981.910110.63
0.4610145.80810179.731210169.2610169.2610193.692810169.2610333.308810169.26
0.4810308.87610457.580410343.7810343.7810473.837610343.7810636.409610343.78
0.510750.2110900.8610750.2110900.8610900.8610750.2110900.8610900.86
0.5211088.04411183.032411234.1811234.1811175.725611051.5111102.657611234.18
0.5411275.50811331.300811337.511337.511323.035211234.1811240.379211337.5
0.5611402.5411476.877611445.911445.911453.644411445.911608.532411445.9
0.5811600.78811674.523211639.5111639.5111659.780811639.5111696.636811639.51
0.611731.6511740.21811731.6511738.7911737.36211731.6511737.36211745.93
0.6211754.13611779.574611786.9611786.9611769.727411745.9311753.315411786.96
0.6411842.12811928.194411924.8811924.8811891.779211786.9612004.425611924.88
0.6611974.59612013.405412007.7412007.7412002.768412007.7412023.864612007.74
0.6812025.17212055.214812029.5312029.5312035.951212029.5312057.355212029.53
0.712083.0412110.27712083.0412102.49512094.71312083.0412094.71312121.95
0.7212130.31612160.433612163.7812163.7812142.028412121.9512125.296412163.78
0.7412197.3212309.689212247.6312247.6312219.12112163.7812628.850812247.63
0.7612513.59812750.20212690.9112690.9112619.985212690.9112796.31812690.91
0.7812822.6712887.562212855.6112855.6112856.711812855.6112878.747812910.7
0.812910.712923.68412910.712918.81512913.94612910.712913.94612926.93
0.8212958.86213088.900613086.5913086.5912987.600812926.9313199.809413086.59
0.8413132.80213237.980813202.1213202.1213151.286813086.5913315.679213202.12
0.8613291.77213430.839413351.5413351.5413312.690813351.5413444.630613351.54
0.8813489.45213612.833213523.9313523.9313510.138813523.9313565.766813654.67
0.913654.6713738.38813654.6713701.1813663.97213654.6713663.97213747.69
0.9213770.71613892.713862.8213862.8213779.926413747.6914081.9413862.82
0.9413962.4214145.59914111.8214111.8213977.3613862.8214177.39114111.82
0.9614171.4314254.883614211.1714211.1714175.40414211.1714245.516414289.23
0.9814273.61814461.703614289.2314289.2314275.179214289.2314337.876414510.35


Parameters (Session):
Parameters (R input):
R code (references can be found in the software module):
x <-sort(x[!is.na(x)])
q1 <- function(data,n,p,i,f) {
np <- n*p;
i <<- floor(np)
f <<- np - i
qvalue <- (1-f)*data[i] + f*data[i+1]
}
q2 <- function(data,n,p,i,f) {
np <- (n+1)*p
i <<- floor(np)
f <<- np - i
qvalue <- (1-f)*data[i] + f*data[i+1]
}
q3 <- function(data,n,p,i,f) {
np <- n*p
i <<- floor(np)
f <<- np - i
if (f==0) {
qvalue <- data[i]
} else {
qvalue <- data[i+1]
}
}
q4 <- function(data,n,p,i,f) {
np <- n*p
i <<- floor(np)
f <<- np - i
if (f==0) {
qvalue <- (data[i]+data[i+1])/2
} else {
qvalue <- data[i+1]
}
}
q5 <- function(data,n,p,i,f) {
np <- (n-1)*p
i <<- floor(np)
f <<- np - i
if (f==0) {
qvalue <- data[i+1]
} else {
qvalue <- data[i+1] + f*(data[i+2]-data[i+1])
}
}
q6 <- function(data,n,p,i,f) {
np <- n*p+0.5
i <<- floor(np)
f <<- np - i
qvalue <- data[i]
}
q7 <- function(data,n,p,i,f) {
np <- (n+1)*p
i <<- floor(np)
f <<- np - i
if (f==0) {
qvalue <- data[i]
} else {
qvalue <- f*data[i] + (1-f)*data[i+1]
}
}
q8 <- function(data,n,p,i,f) {
np <- (n+1)*p
i <<- floor(np)
f <<- np - i
if (f==0) {
qvalue <- data[i]
} else {
if (f == 0.5) {
qvalue <- (data[i]+data[i+1])/2
} else {
if (f < 0.5) {
qvalue <- data[i]
} else {
qvalue <- data[i+1]
}
}
}
}
lx <- length(x)
qval <- array(NA,dim=c(99,8))
mystep <- 25
mystart <- 25
if (lx>10){
mystep=10
mystart=10
}
if (lx>20){
mystep=5
mystart=5
}
if (lx>50){
mystep=2
mystart=2
}
if (lx>=100){
mystep=1
mystart=1
}
for (perc in seq(mystart,99,mystep)) {
qval[perc,1] <- q1(x,lx,perc/100,i,f)
qval[perc,2] <- q2(x,lx,perc/100,i,f)
qval[perc,3] <- q3(x,lx,perc/100,i,f)
qval[perc,4] <- q4(x,lx,perc/100,i,f)
qval[perc,5] <- q5(x,lx,perc/100,i,f)
qval[perc,6] <- q6(x,lx,perc/100,i,f)
qval[perc,7] <- q7(x,lx,perc/100,i,f)
qval[perc,8] <- q8(x,lx,perc/100,i,f)
}
bitmap(file='test1.png')
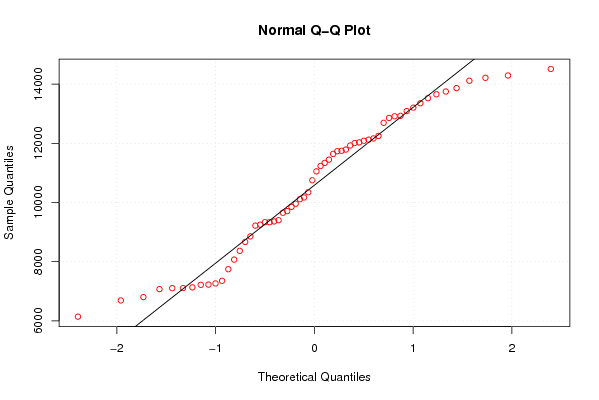
myqqnorm <- qqnorm(x,col=2)
qqline(x)
grid()
dev.off()
load(file='createtable')
a<-table.start()
a<-table.row.start(a)
a<-table.element(a,'Percentiles - Ungrouped Data',9,TRUE)
a<-table.row.end(a)
a<-table.row.start(a)
a<-table.element(a,'p',1,TRUE)
a<-table.element(a,hyperlink('method_1.htm', 'Weighted Average at Xnp',''),1,TRUE)
a<-table.element(a,hyperlink('method_2.htm','Weighted Average at X(n+1)p',''),1,TRUE)
a<-table.element(a,hyperlink('method_3.htm','Empirical Distribution Function',''),1,TRUE)
a<-table.element(a,hyperlink('method_4.htm','Empirical Distribution Function - Averaging',''),1,TRUE)
a<-table.element(a,hyperlink('method_5.htm','Empirical Distribution Function - Interpolation',''),1,TRUE)
a<-table.element(a,hyperlink('method_6.htm','Closest Observation',''),1,TRUE)
a<-table.element(a,hyperlink('method_7.htm','True Basic - Statistics Graphics Toolkit',''),1,TRUE)
a<-table.element(a,hyperlink('method_8.htm','MS Excel (old versions)',''),1,TRUE)
a<-table.row.end(a)
for (perc in seq(mystart,99,mystep)) {
a<-table.row.start(a)
a<-table.element(a,round(perc/100,2),1,TRUE)
for (j in 1:8) {
a<-table.element(a,round(qval[perc,j],6))
}
a<-table.row.end(a)
}
a<-table.end(a)
table.save(a,file='mytable.tab')