| Multiple Linear Regression - Estimated Regression Equation |
| dzcg [t] = + 62.7286165220799 + 0.513169574290042indcvtr[t] + e[t] |
| Multiple Linear Regression - Ordinary Least Squares | |||||
| Variable | Parameter | S.D. | T-STAT H0: parameter = 0 | 2-tail p-value | 1-tail p-value |
| (Intercept) | 62.7286165220799 | 1.465188 | 42.8127 | 0 | 0 |
| indcvtr | 0.513169574290042 | 0.078524 | 6.5352 | 0 | 0 |
| Multiple Linear Regression - Regression Statistics | |
| Multiple R | 0.648007328327549 |
| R-squared | 0.419913497566208 |
| Adjusted R-squared | 0.410081522948686 |
| F-TEST (value) | 42.7089688390637 |
| F-TEST (DF numerator) | 1 |
| F-TEST (DF denominator) | 59 |
| p-value | 1.64733496843539e-08 |
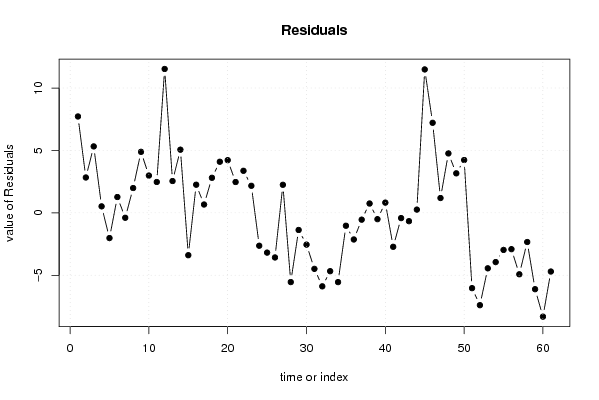
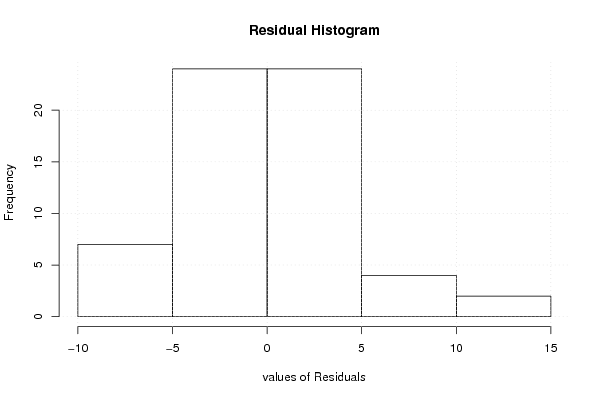
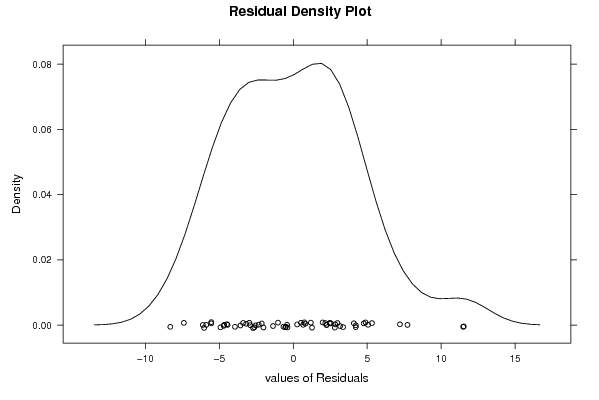
| Multiple Linear Regression - Residual Statistics | |
| Residual Standard Deviation | 4.36871320336193 |
| Sum Squared Residuals | 1126.0536481405 |
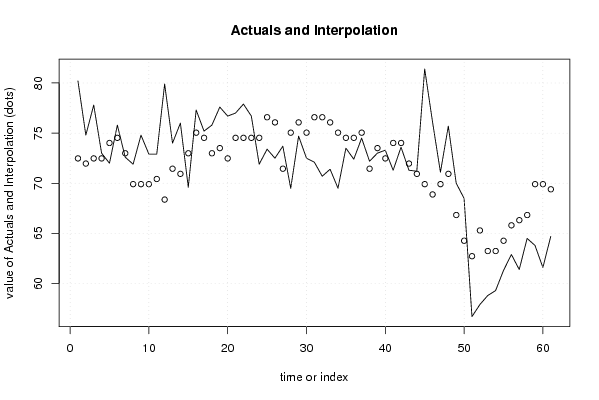
| Multiple Linear Regression - Actuals, Interpolation, and Residuals | |||
| Time or Index | Actuals | Interpolation Forecast | Residuals Prediction Error |
| 1 | 80.2 | 72.4788384335906 | 7.72116156640942 |
| 2 | 74.8 | 71.9656688593007 | 2.83433114069932 |
| 3 | 77.8 | 72.4788384335907 | 5.32116156640926 |
| 4 | 73 | 72.4788384335907 | 0.521161566409267 |
| 5 | 72 | 74.0183471564609 | -2.01834715646086 |
| 6 | 75.8 | 74.5315167307509 | 1.26848326924910 |
| 7 | 72.6 | 72.9920080078808 | -0.39200800788078 |
| 8 | 71.9 | 69.9129905621405 | 1.98700943785948 |
| 9 | 74.8 | 69.9129905621405 | 4.88700943785947 |
| 10 | 72.9 | 69.9129905621405 | 2.98700943785948 |
| 11 | 72.9 | 70.4261601364306 | 2.47383986356944 |
| 12 | 79.9 | 68.3734818392704 | 11.5265181607296 |
| 13 | 74 | 71.4524992850106 | 2.54750071498935 |
| 14 | 76 | 70.9393297107206 | 5.0606702892794 |
| 15 | 69.6 | 72.9920080078808 | -3.39200800788078 |
| 16 | 77.3 | 75.044686305041 | 2.25531369495905 |
| 17 | 75.2 | 74.5315167307509 | 0.668483269249101 |
| 18 | 75.8 | 72.9920080078808 | 2.80799199211922 |
| 19 | 77.6 | 73.5051775821708 | 4.09482241782918 |
| 20 | 76.7 | 72.4788384335907 | 4.22116156640927 |
| 21 | 77 | 74.5315167307509 | 2.4684832692491 |
| 22 | 77.9 | 74.5315167307509 | 3.36848326924910 |
| 23 | 76.7 | 74.5315167307509 | 2.1684832692491 |
| 24 | 71.9 | 74.5315167307509 | -2.63151673075090 |
| 25 | 73.4 | 76.584195027911 | -3.18419502791106 |
| 26 | 72.5 | 76.071025453621 | -3.57102545362103 |
| 27 | 73.7 | 71.4524992850106 | 2.24750071498935 |
| 28 | 69.5 | 75.044686305041 | -5.54468630504094 |
| 29 | 74.7 | 76.071025453621 | -1.37102545362102 |
| 30 | 72.5 | 75.044686305041 | -2.54468630504094 |
| 31 | 72.1 | 76.584195027911 | -4.48419502791107 |
| 32 | 70.7 | 76.584195027911 | -5.88419502791107 |
| 33 | 71.4 | 76.071025453621 | -4.67102545362102 |
| 34 | 69.5 | 75.044686305041 | -5.54468630504094 |
| 35 | 73.5 | 74.5315167307509 | -1.03151673075090 |
| 36 | 72.4 | 74.5315167307509 | -2.13151673075090 |
| 37 | 74.5 | 75.044686305041 | -0.544686305040943 |
| 38 | 72.2 | 71.4524992850106 | 0.747500714989355 |
| 39 | 73 | 73.5051775821708 | -0.505177582170817 |
| 40 | 73.3 | 72.4788384335907 | 0.821161566409265 |
| 41 | 71.3 | 74.0183471564609 | -2.71834715646086 |
| 42 | 73.6 | 74.0183471564609 | -0.418347156460865 |
| 43 | 71.3 | 71.9656688593007 | -0.665668859300693 |
| 44 | 71.2 | 70.9393297107206 | 0.260670289279397 |
| 45 | 81.4 | 69.9129905621405 | 11.4870094378595 |
| 46 | 76.1 | 68.8866514135604 | 7.21334858643956 |
| 47 | 71.1 | 69.9129905621405 | 1.18700943785947 |
| 48 | 75.7 | 70.9393297107206 | 4.7606702892794 |
| 49 | 70 | 66.8339731164003 | 3.16602688359973 |
| 50 | 68.5 | 64.26812524495 | 4.23187475504994 |
| 51 | 56.7 | 62.7286165220799 | -6.02861652207993 |
| 52 | 57.9 | 65.2944643935301 | -7.39446439353014 |
| 53 | 58.8 | 63.24178609637 | -4.44178609636998 |
| 54 | 59.3 | 63.24178609637 | -3.94178609636998 |
| 55 | 61.3 | 64.26812524495 | -2.96812524495006 |
| 56 | 62.9 | 65.8076339678202 | -2.90763396782019 |
| 57 | 61.4 | 66.3208035421102 | -4.92080354211023 |
| 58 | 64.5 | 66.8339731164003 | -2.33397311640027 |
| 59 | 63.8 | 69.9129905621405 | -6.11299056214053 |
| 60 | 61.6 | 69.9129905621405 | -8.31299056214052 |
| 61 | 64.7 | 69.3998209878505 | -4.69982098785048 |
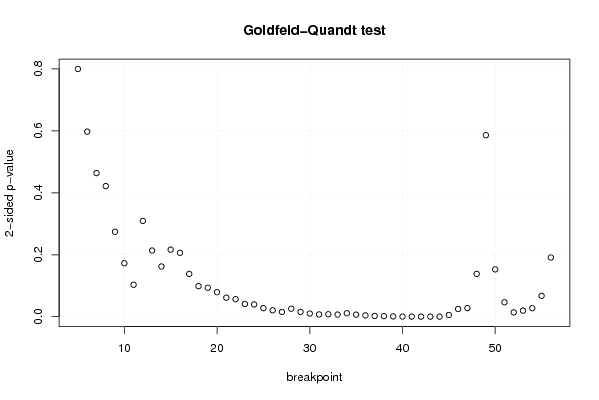
| Goldfeld-Quandt test for Heteroskedasticity | |||
| p-values | Alternative Hypothesis | ||
| breakpoint index | greater | 2-sided | less |
| 5 | 0.399948384598097 | 0.799896769196194 | 0.600051615401903 |
| 6 | 0.298814347741707 | 0.597628695483413 | 0.701185652258293 |
| 7 | 0.231777397409364 | 0.463554794818729 | 0.768222602590636 |
| 8 | 0.210781339681757 | 0.421562679363515 | 0.789218660318243 |
| 9 | 0.137090627723079 | 0.274181255446158 | 0.86290937227692 |
| 10 | 0.0862333271020925 | 0.172466654204185 | 0.913766672897907 |
| 11 | 0.0515629819181611 | 0.103125963836322 | 0.94843701808184 |
| 12 | 0.154668102745004 | 0.309336205490008 | 0.845331897254996 |
| 13 | 0.106812791893071 | 0.213625583786142 | 0.89318720810693 |
| 14 | 0.0810622387539523 | 0.162124477507905 | 0.918937761246048 |
| 15 | 0.108244303408682 | 0.216488606817363 | 0.891755696591318 |
| 16 | 0.103063373753574 | 0.206126747507147 | 0.896936626246426 |
| 17 | 0.0690894958556869 | 0.138178991711374 | 0.930910504144313 |
| 18 | 0.0493192809943355 | 0.098638561988671 | 0.950680719005665 |
| 19 | 0.0467888063975454 | 0.0935776127950909 | 0.953211193602455 |
| 20 | 0.0395304697139033 | 0.0790609394278066 | 0.960469530286097 |
| 21 | 0.0306738317619044 | 0.0613476635238088 | 0.969326168238096 |
| 22 | 0.0282817813391016 | 0.0565635626782031 | 0.971718218660898 |
| 23 | 0.0205970680249387 | 0.0411941360498774 | 0.979402931975061 |
| 24 | 0.0198313557412161 | 0.0396627114824322 | 0.980168644258784 |
| 25 | 0.0137681321080492 | 0.0275362642160984 | 0.98623186789195 |
| 26 | 0.0103787599184673 | 0.0207575198369345 | 0.989621240081533 |
| 27 | 0.00763408958319647 | 0.0152681791663929 | 0.992365910416804 |
| 28 | 0.0128809463790121 | 0.0257618927580243 | 0.987119053620988 |
| 29 | 0.00769398341736228 | 0.0153879668347246 | 0.992306016582638 |
| 30 | 0.0050715640137392 | 0.0101431280274784 | 0.99492843598626 |
| 31 | 0.00366372967450665 | 0.0073274593490133 | 0.996336270325493 |
| 32 | 0.00393715435266324 | 0.00787430870532648 | 0.996062845647337 |
| 33 | 0.00341747880527386 | 0.00683495761054772 | 0.996582521194726 |
| 34 | 0.00557186227622221 | 0.0111437245524444 | 0.994428137723778 |
| 35 | 0.0032907778746211 | 0.0065815557492422 | 0.996709222125379 |
| 36 | 0.00221155295216500 | 0.00442310590432999 | 0.997788447047835 |
| 37 | 0.00129341770249072 | 0.00258683540498145 | 0.99870658229751 |
| 38 | 0.000885139282786457 | 0.00177027856557291 | 0.999114860717214 |
| 39 | 0.0004876795588048 | 0.0009753591176096 | 0.999512320441195 |
| 40 | 0.000252949608898364 | 0.000505899217796727 | 0.999747050391102 |
| 41 | 0.000224335030708594 | 0.000448670061417187 | 0.999775664969291 |
| 42 | 0.000124839454191488 | 0.000249678908382976 | 0.999875160545808 |
| 43 | 9.64540403455025e-05 | 0.000192908080691005 | 0.999903545959654 |
| 44 | 7.0019452803131e-05 | 0.000140038905606262 | 0.999929980547197 |
| 45 | 0.00280126224510495 | 0.00560252449020991 | 0.997198737754895 |
| 46 | 0.0124203103164082 | 0.0248406206328163 | 0.987579689683592 |
| 47 | 0.0138332616561852 | 0.0276665233123704 | 0.986166738343815 |
| 48 | 0.069137518149662 | 0.138275036299324 | 0.930862481850338 |
| 49 | 0.292984230866881 | 0.585968461733761 | 0.707015769133119 |
| 50 | 0.923582187971904 | 0.152835624056191 | 0.0764178120280957 |
| 51 | 0.976694261158813 | 0.0466114776823745 | 0.0233057388411873 |
| 52 | 0.993057878557554 | 0.0138842428848925 | 0.00694212144244623 |
| 53 | 0.990176015642288 | 0.0196479687154248 | 0.00982398435771238 |
| 54 | 0.986351303442901 | 0.0272973931141981 | 0.0136486965570991 |
| 55 | 0.966338986772979 | 0.0673220264540422 | 0.0336610132270211 |
| 56 | 0.904447133939626 | 0.191105732120749 | 0.0955528660603744 |
| Meta Analysis of Goldfeld-Quandt test for Heteroskedasticity | |||
| Description | # significant tests | % significant tests | OK/NOK |
| 1% type I error level | 14 | 0.269230769230769 | NOK |
| 5% type I error level | 29 | 0.557692307692308 | NOK |
| 10% type I error level | 35 | 0.673076923076923 | NOK |