Free Statistics
of Irreproducible Research!
Description of Statistical Computation | |||||||||||||||||||||||||||||||||||||||||
|---|---|---|---|---|---|---|---|---|---|---|---|---|---|---|---|---|---|---|---|---|---|---|---|---|---|---|---|---|---|---|---|---|---|---|---|---|---|---|---|---|---|
| Author's title | |||||||||||||||||||||||||||||||||||||||||
| Author | *The author of this computation has been verified* | ||||||||||||||||||||||||||||||||||||||||
| R Software Module | rwasp_univariatedataseries.wasp | ||||||||||||||||||||||||||||||||||||||||
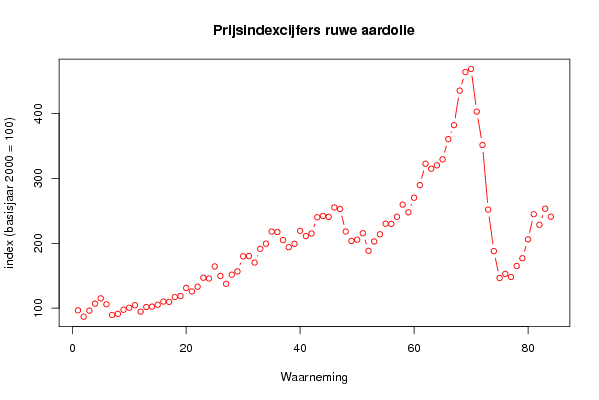
| Title produced by software | Univariate Data Series | ||||||||||||||||||||||||||||||||||||||||
| Date of computation | Sat, 12 Dec 2009 10:13:39 -0700 | ||||||||||||||||||||||||||||||||||||||||
| Cite this page as follows | Statistical Computations at FreeStatistics.org, Office for Research Development and Education, URL https://freestatistics.org/blog/index.php?v=date/2009/Dec/12/t12606381481nzn3hxfg2io5od.htm/, Retrieved Mon, 29 Apr 2024 10:14:29 +0000 | ||||||||||||||||||||||||||||||||||||||||
| Statistical Computations at FreeStatistics.org, Office for Research Development and Education, URL https://freestatistics.org/blog/index.php?pk=67086, Retrieved Mon, 29 Apr 2024 10:14:29 +0000 | |||||||||||||||||||||||||||||||||||||||||
| QR Codes: | |||||||||||||||||||||||||||||||||||||||||
|
| |||||||||||||||||||||||||||||||||||||||||
| Original text written by user: | |||||||||||||||||||||||||||||||||||||||||
| IsPrivate? | No (this computation is public) | ||||||||||||||||||||||||||||||||||||||||
| User-defined keywords | |||||||||||||||||||||||||||||||||||||||||
| Estimated Impact | 175 | ||||||||||||||||||||||||||||||||||||||||
Tree of Dependent Computations | |||||||||||||||||||||||||||||||||||||||||
| Family? (F = Feedback message, R = changed R code, M = changed R Module, P = changed Parameters, D = changed Data) | |||||||||||||||||||||||||||||||||||||||||
| - [Univariate Data Series] [Scatterplot prijs...] [2009-12-12 17:13:39] [c6e373ff11c42d4585d53e9e88ed5606] [Current] - RMP [Notched Boxplots] [Notched Boxplot R...] [2009-12-12 20:55:11] [8733f8ed033058987ec00f5e71b74854] - RMP [Kernel Density Estimation] [Kernel Density Plot] [2009-12-12 21:34:52] [8733f8ed033058987ec00f5e71b74854] - RMPD [Multiple Regression] [Multiple Regression] [2009-12-12 23:11:16] [8733f8ed033058987ec00f5e71b74854] - RMPD [Multiple Regression] [Multiple Regression] [2009-12-12 23:11:16] [8733f8ed033058987ec00f5e71b74854] - [Multiple Regression] [Multiple Regression] [2009-12-13 11:19:41] [8733f8ed033058987ec00f5e71b74854] - D [Multiple Regression] [Multiple Regression] [2009-12-14 22:31:19] [8733f8ed033058987ec00f5e71b74854] - D [Multiple Regression] [Multiple Regression] [2009-12-14 23:44:49] [8733f8ed033058987ec00f5e71b74854] - P [Multiple Regression] [Multiple Regression] [2009-12-15 19:04:43] [8733f8ed033058987ec00f5e71b74854] - P [Multiple Regression] [Multiple Regression] [2009-12-17 12:59:13] [8733f8ed033058987ec00f5e71b74854] - RMP [Variance Reduction Matrix] [Identifying Integ...] [2009-12-17 16:15:40] [8733f8ed033058987ec00f5e71b74854] - [Variance Reduction Matrix] [Identifying Integ...] [2009-12-17 16:22:25] [8733f8ed033058987ec00f5e71b74854] - RMP [Standard Deviation-Mean Plot] [Identifying Integ...] [2009-12-17 16:27:45] [8733f8ed033058987ec00f5e71b74854] - RMP [ARIMA Backward Selection] [Estimation of Box...] [2009-12-17 16:59:20] [8733f8ed033058987ec00f5e71b74854] - RMP [ARIMA Forecasting] [ARIMA Forecasting] [2009-12-17 18:25:36] [8733f8ed033058987ec00f5e71b74854] | |||||||||||||||||||||||||||||||||||||||||
| Feedback Forum | |||||||||||||||||||||||||||||||||||||||||
Post a new message | |||||||||||||||||||||||||||||||||||||||||
Dataset | |||||||||||||||||||||||||||||||||||||||||
| Dataseries X: | |||||||||||||||||||||||||||||||||||||||||
96.8 87.0 96.3 107.1 115.2 106.1 89.5 91.3 97.6 100.7 104.6 94.7 101.8 102.5 105.3 110.3 109.8 117.3 118.8 131.3 125.9 133.1 147.0 145.8 164.4 149.8 137.7 151.7 156.8 180.0 180.4 170.4 191.6 199.5 218.2 217.5 205.0 194.0 199.3 219.3 211.1 215.2 240.2 242.2 240.7 255.4 253.0 218.2 203.7 205.6 215.6 188.5 202.9 214.0 230.3 230.0 241.0 259.6 247.8 270.3 289.7 322.7 315.0 320.2 329.5 360.6 382.2 435.4 464.0 468.8 403.0 351.6 252.0 188.0 146.5 152.9 148.1 165.1 177.0 206.1 244.9 228.6 253.4 241.1 | |||||||||||||||||||||||||||||||||||||||||
Tables (Output of Computation) | |||||||||||||||||||||||||||||||||||||||||
| |||||||||||||||||||||||||||||||||||||||||
Figures (Output of Computation) | |||||||||||||||||||||||||||||||||||||||||
Input Parameters & R Code | |||||||||||||||||||||||||||||||||||||||||
| Parameters (Session): | |||||||||||||||||||||||||||||||||||||||||
| par1 = Prijsindexcijfers ruwe aardolie ; par2 = Belgostat ; | |||||||||||||||||||||||||||||||||||||||||
| Parameters (R input): | |||||||||||||||||||||||||||||||||||||||||
| par1 = Prijsindexcijfers ruwe aardolie ; par2 = Belgostat ; par3 = ; | |||||||||||||||||||||||||||||||||||||||||
| R code (references can be found in the software module): | |||||||||||||||||||||||||||||||||||||||||
bitmap(file='test1.png') | |||||||||||||||||||||||||||||||||||||||||