| Multiple Linear Regression - Estimated Regression Equation |
| IndProd[t] = + 29.9537315632205 + 0.729251732970066ProdMetal[t] + e[t] |
| Multiple Linear Regression - Ordinary Least Squares | |||||
| Variable | Parameter | S.D. | T-STAT H0: parameter = 0 | 2-tail p-value | 1-tail p-value |
| (Intercept) | 29.9537315632205 | 7.862957 | 3.8095 | 0.000339 | 0.000169 |
| ProdMetal | 0.729251732970066 | 0.080808 | 9.0245 | 0 | 0 |
| Multiple Linear Regression - Regression Statistics | |
| Multiple R | 0.764233944431027 |
| R-squared | 0.584053521820605 |
| Adjusted R-squared | 0.576882030817512 |
| F-TEST (value) | 81.4410171565031 |
| F-TEST (DF numerator) | 1 |
| F-TEST (DF denominator) | 58 |
| p-value | 1.20836674000202e-12 |
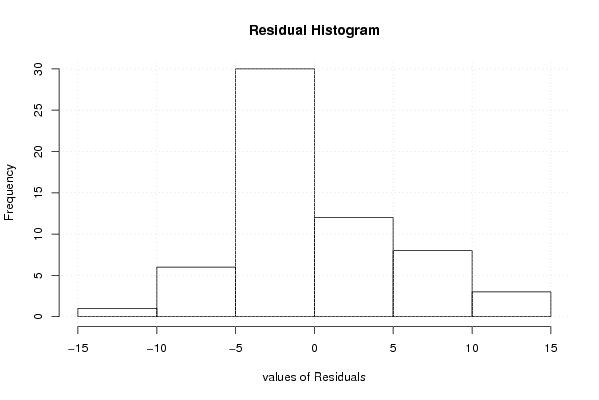
| Multiple Linear Regression - Residual Statistics | |
| Residual Standard Deviation | 5.15279922314939 |
| Sum Squared Residuals | 1539.97771037716 |
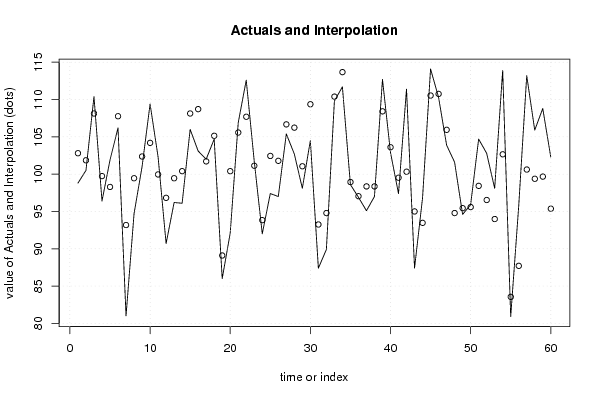
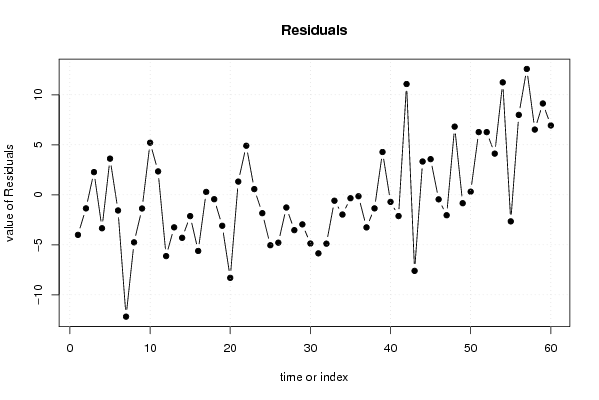
| Multiple Linear Regression - Actuals, Interpolation, and Residuals | |||
| Time or Index | Actuals | Interpolation Forecast | Residuals Prediction Error |
| 1 | 98.8 | 102.805979686931 | -4.00597968693054 |
| 2 | 100.5 | 101.857952434069 | -1.35795243406910 |
| 3 | 110.4 | 108.129517337612 | 2.27048266238835 |
| 4 | 96.4 | 99.743122408456 | -3.34312240845589 |
| 5 | 101.9 | 98.2846189425158 | 3.61538105748424 |
| 6 | 106.2 | 107.764891471127 | -1.56489147112662 |
| 7 | 81 | 93.1798568117253 | -12.1798568117253 |
| 8 | 94.7 | 99.4514217152679 | -4.75142171526786 |
| 9 | 101 | 102.368428647148 | -1.36842864714813 |
| 10 | 109.4 | 104.191557979573 | 5.20844202042671 |
| 11 | 102.3 | 99.9618979283469 | 2.33810207165308 |
| 12 | 90.7 | 96.8261154765756 | -6.12611547657563 |
| 13 | 96.2 | 99.4514217152679 | -3.25142171526786 |
| 14 | 96.1 | 100.399448968129 | -4.29944896812896 |
| 15 | 106 | 108.129517337612 | -2.12951733761166 |
| 16 | 103.1 | 108.712918723988 | -5.61291872398772 |
| 17 | 102 | 101.712102087475 | 0.287897912524922 |
| 18 | 104.7 | 105.139585232434 | -0.439585232434379 |
| 19 | 86 | 89.0960471070929 | -3.09604710709292 |
| 20 | 92.1 | 100.399448968129 | -8.29944896812896 |
| 21 | 106.9 | 105.577136272216 | 1.32286372778358 |
| 22 | 112.6 | 107.691966297830 | 4.90803370217038 |
| 23 | 101.7 | 101.128700701099 | 0.571299298900986 |
| 24 | 92 | 93.8361833713983 | -1.83618337139835 |
| 25 | 97.4 | 102.441353820445 | -5.04135382044514 |
| 26 | 97 | 101.785027260772 | -4.78502726077208 |
| 27 | 105.4 | 106.671013871672 | -1.27101387167152 |
| 28 | 102.7 | 106.233462831889 | -3.53346283188948 |
| 29 | 98.1 | 101.055775527802 | -2.95577552780202 |
| 30 | 104.5 | 109.369245283661 | -4.86924528366077 |
| 31 | 87.4 | 93.2527819850223 | -5.8527819850223 |
| 32 | 89.9 | 94.7842106242594 | -4.88421062425944 |
| 33 | 109.8 | 110.390197709819 | -0.590197709818864 |
| 34 | 111.7 | 113.671830508184 | -1.97183050818416 |
| 35 | 98.6 | 98.9409455021888 | -0.340945502188824 |
| 36 | 96.9 | 97.0448909964666 | -0.144890996466644 |
| 37 | 95.1 | 98.3575441158128 | -3.25754411581277 |
| 38 | 97 | 98.3575441158128 | -1.35754411581277 |
| 39 | 112.7 | 108.421218030800 | 4.27878196920032 |
| 40 | 102.9 | 103.608156593197 | -0.708156593197241 |
| 41 | 97.4 | 99.5243468885649 | -2.12434688856487 |
| 42 | 111.4 | 100.326523794832 | 11.0734762051681 |
| 43 | 87.4 | 95.0029861441505 | -7.60298614415046 |
| 44 | 96.8 | 93.4715575049133 | 3.32844249508668 |
| 45 | 114.1 | 110.536048056413 | 3.56395194358712 |
| 46 | 110.3 | 110.754823576304 | -0.454823576303898 |
| 47 | 103.9 | 105.941762138701 | -2.04176213870145 |
| 48 | 101.6 | 94.7842106242594 | 6.81578937574055 |
| 49 | 94.6 | 95.4405371839325 | -0.840537183932507 |
| 50 | 95.9 | 95.5863875305265 | 0.313612469473489 |
| 51 | 104.7 | 98.4304692891098 | 6.26953071089022 |
| 52 | 102.8 | 96.5344147833876 | 6.2655852166124 |
| 53 | 98.1 | 93.9820337179924 | 4.11796628200763 |
| 54 | 113.9 | 102.660129340336 | 11.2398706596638 |
| 55 | 80.9 | 83.5537339365204 | -2.65373393652042 |
| 56 | 95.7 | 87.7104688144498 | 7.9895311855502 |
| 57 | 113.2 | 100.61822448802 | 12.5817755119800 |
| 58 | 105.9 | 99.3784965419709 | 6.52150345802914 |
| 59 | 108.8 | 99.6701972351589 | 9.12980276484111 |
| 60 | 102.3 | 95.3676120106355 | 6.9323879893645 |
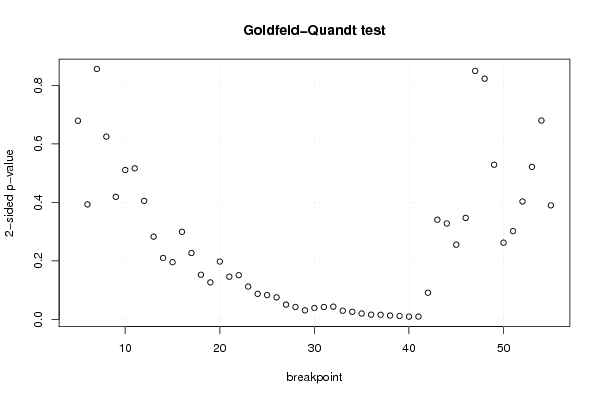
| Goldfeld-Quandt test for Heteroskedasticity | |||
| p-values | Alternative Hypothesis | ||
| breakpoint index | greater | 2-sided | less |
| 5 | 0.339544752313321 | 0.679089504626641 | 0.66045524768668 |
| 6 | 0.196535776617408 | 0.393071553234815 | 0.803464223382592 |
| 7 | 0.428149642462160 | 0.856299284924321 | 0.57185035753784 |
| 8 | 0.312406769605763 | 0.624813539211525 | 0.687593230394237 |
| 9 | 0.20942869529548 | 0.41885739059096 | 0.79057130470452 |
| 10 | 0.255296776507303 | 0.510593553014606 | 0.744703223492697 |
| 11 | 0.258170408342428 | 0.516340816684856 | 0.741829591657572 |
| 12 | 0.202517009443249 | 0.405034018886497 | 0.797482990556752 |
| 13 | 0.141312006002732 | 0.282624012005464 | 0.858687993997268 |
| 14 | 0.104879707355026 | 0.209759414710051 | 0.895120292644974 |
| 15 | 0.0976525018459636 | 0.195305003691927 | 0.902347498154036 |
| 16 | 0.149543115196375 | 0.299086230392751 | 0.850456884803624 |
| 17 | 0.113303332385835 | 0.226606664771670 | 0.886696667614165 |
| 18 | 0.0761364846065074 | 0.152272969213015 | 0.923863515393493 |
| 19 | 0.0630910455924731 | 0.126182091184946 | 0.936908954407527 |
| 20 | 0.0987544549243504 | 0.197508909848701 | 0.90124554507565 |
| 21 | 0.0728079394226963 | 0.145615878845393 | 0.927192060577304 |
| 22 | 0.0753201843722566 | 0.150640368744513 | 0.924679815627743 |
| 23 | 0.0559791986149098 | 0.111958397229820 | 0.94402080138509 |
| 24 | 0.0434656551241777 | 0.0869313102483553 | 0.956534344875822 |
| 25 | 0.0413520163309692 | 0.0827040326619383 | 0.95864798366903 |
| 26 | 0.0374748964436673 | 0.0749497928873345 | 0.962525103556333 |
| 27 | 0.0250862375290543 | 0.0501724750581086 | 0.974913762470946 |
| 28 | 0.0210401872394061 | 0.0420803744788122 | 0.978959812760594 |
| 29 | 0.0152920344718431 | 0.0305840689436861 | 0.984707965528157 |
| 30 | 0.0193970832975868 | 0.0387941665951736 | 0.980602916702413 |
| 31 | 0.0209398424244448 | 0.0418796848488896 | 0.979060157575555 |
| 32 | 0.0215789062599798 | 0.0431578125199595 | 0.97842109374002 |
| 33 | 0.0146045669901665 | 0.0292091339803330 | 0.985395433009834 |
| 34 | 0.0127583256226074 | 0.0255166512452148 | 0.987241674377393 |
| 35 | 0.00985086701726876 | 0.0197017340345375 | 0.99014913298273 |
| 36 | 0.0078384773549021 | 0.0156769547098042 | 0.992161522645098 |
| 37 | 0.00766441567929838 | 0.0153288313585968 | 0.992335584320702 |
| 38 | 0.00636554374471697 | 0.0127310874894339 | 0.993634456255283 |
| 39 | 0.00566419130752362 | 0.0113283826150472 | 0.994335808692476 |
| 40 | 0.00448827830259563 | 0.00897655660519126 | 0.995511721697404 |
| 41 | 0.00453075869098315 | 0.0090615173819663 | 0.995469241309017 |
| 42 | 0.0454291662949175 | 0.090858332589835 | 0.954570833705082 |
| 43 | 0.170246936881471 | 0.340493873762942 | 0.829753063118529 |
| 44 | 0.163904569795840 | 0.327809139591681 | 0.83609543020416 |
| 45 | 0.127607570833008 | 0.255215141666015 | 0.872392429166992 |
| 46 | 0.173448733414402 | 0.346897466828803 | 0.826551266585598 |
| 47 | 0.575248293822009 | 0.849503412355982 | 0.424751706177991 |
| 48 | 0.58843782438761 | 0.82312435122478 | 0.41156217561239 |
| 49 | 0.735657152125605 | 0.528685695748791 | 0.264342847874395 |
| 50 | 0.868990852690531 | 0.262018294618937 | 0.131009147309469 |
| 51 | 0.849113093753839 | 0.301773812492323 | 0.150886906246161 |
| 52 | 0.798515347930485 | 0.402969304139031 | 0.201484652069515 |
| 53 | 0.739385918115774 | 0.521228163768452 | 0.260614081884226 |
| 54 | 0.660084200499854 | 0.679831599000292 | 0.339915799500146 |
| 55 | 0.805144690913747 | 0.389710618172505 | 0.194855309086253 |
| Meta Analysis of Goldfeld-Quandt test for Heteroskedasticity | |||
| Description | # significant tests | % significant tests | OK/NOK |
| 1% type I error level | 2 | 0.0392156862745098 | NOK |
| 5% type I error level | 14 | 0.274509803921569 | NOK |
| 10% type I error level | 19 | 0.372549019607843 | NOK |