Free Statistics

of Irreproducible Research!

Author's title

Author*The author of this computation has been verified*
R Software Modulerwasp_arimabackwardselection.wasp
Title produced by softwareARIMA Backward Selection
Date of computationSat, 12 Dec 2009 09:32:49 -0700
Cite this page as followsStatistical Computations at FreeStatistics.org, Office for Research Development and Education, URL https://freestatistics.org/blog/index.php?v=date/2009/Dec/12/t1260635619ecj1txghpnqgp0t.htm/, Retrieved Mon, 29 Apr 2024 15:16:49 +0000
Statistical Computations at FreeStatistics.org, Office for Research Development and Education, URL https://freestatistics.org/blog/index.php?pk=67048, Retrieved Mon, 29 Apr 2024 15:16:49 +0000
QR Codes:

Original text written by user:
IsPrivate?No (this computation is public)
User-defined keywords
Estimated Impact146
Family? (F = Feedback message, R = changed R code, M = changed R Module, P = changed Parameters, D = changed Data)
-     [Univariate Data Series] [data set] [2008-12-01 19:54:57] [b98453cac15ba1066b407e146608df68]
F RMP   [ARIMA Backward Selection] [ARIMA Backward Se...] [2008-12-06 10:27:24] [c94d7012e41b73cfa20d93e879679ede]
-   PD    [ARIMA Backward Selection] [ARIMA backward se...] [2008-12-14 08:46:35] [12d343c4448a5f9e527bb31caeac580b]
- RM D        [ARIMA Backward Selection] [ARIMA BACKWARD SE...] [2009-12-12 16:32:49] [5d37783481a916b2505b66314b556267] [Current]
Feedback Forum

Post a new message
Dataseries X:
17192.4
15386.1
14287.1
17526.6
14497
14398.3
16629.6
16670.7
16614.8
16869.2
15663.9
16359.9
18447.7
16889
16505
18320.9
15052.1
15699.8
18135.3
16768.7
18883
19021
18101.9
17776.1
21489.9
17065.3
18690
18953.1
16398.9
16895.6
18553
19270
19422.1
17579.4
18637.3
18076.7
20438.6
18075.2
19563
19899.2
19227.5
17789.6
19220.8
21968.9
21131.5
19484.6
22168.7
20866.8
22176.2
23533.8
21479.6
24347.7
22751.6
20328.3
23650.4
23335.7
19614.9
18042.3
17282.5
16847.2
18159.5


Summary of computational transaction
Raw Inputview raw input (R code)
Raw Outputview raw output of R engine
Computing time8 seconds
R Server'Gwilym Jenkins' @ 72.249.127.135

\begin{tabular}{lllllllll}
\hline
Summary of computational transaction \tabularnewline
Raw Input & view raw input (R code)  \tabularnewline
Raw Output & view raw output of R engine  \tabularnewline
Computing time & 8 seconds \tabularnewline
R Server & 'Gwilym Jenkins' @ 72.249.127.135 \tabularnewline
\hline
\end{tabular}
%Source: https://freestatistics.org/blog/index.php?pk=67048&T=0

[TABLE]
[ROW][C]Summary of computational transaction[/C][/ROW]
[ROW][C]Raw Input[/C][C]view raw input (R code) [/C][/ROW]
[ROW][C]Raw Output[/C][C]view raw output of R engine [/C][/ROW]
[ROW][C]Computing time[/C][C]8 seconds[/C][/ROW]
[ROW][C]R Server[/C][C]'Gwilym Jenkins' @ 72.249.127.135[/C][/ROW]
[/TABLE]
Source: https://freestatistics.org/blog/index.php?pk=67048&T=0

Globally Unique Identifier (entire table): ba.freestatistics.org/blog/index.php?pk=67048&T=0

As an alternative you can also use a QR Code:  

The GUIDs for individual cells are displayed in the table below:

Summary of computational transaction
Raw Inputview raw input (R code)
Raw Outputview raw output of R engine
Computing time8 seconds
R Server'Gwilym Jenkins' @ 72.249.127.135


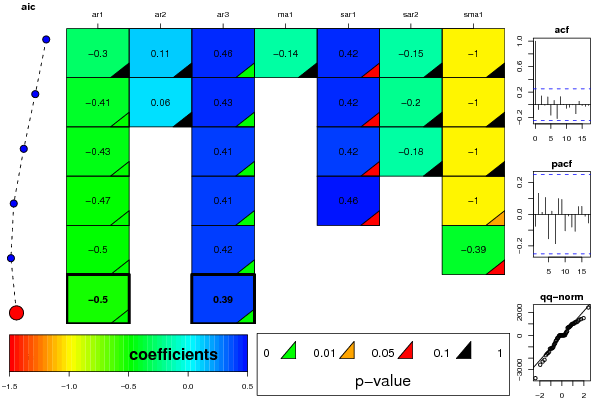
ARIMA Parameter Estimation and Backward Selection
Iterationar1ar2ar3ma1sar1sar2sma1
Estimates ( 1 )-0.29890.11460.455-0.14420.4208-0.1519-0.9971
(p-val)(0.2315 )(0.4982 )(0.0013 )(0.6016 )(0.0824 )(0.5907 )(0.1425 )
Estimates ( 2 )-0.40550.0610.429200.4237-0.1984-0.9999
(p-val)(0.0068 )(0.6743 )(0.0015 )(NA )(0.073 )(0.448 )(0.1542 )
Estimates ( 3 )-0.432800.405100.4197-0.1774-0.9997
(p-val)(0.0016 )(NA )(8e-04 )(NA )(0.0841 )(0.4979 )(0.1582 )
Estimates ( 4 )-0.467800.410400.46490-1
(p-val)(1e-04 )(NA )(5e-04 )(NA )(0.0508 )(NA )(0.0312 )
Estimates ( 5 )-0.497700.418000-0.3894
(p-val)(0 )(NA )(3e-04 )(NA )(NA )(NA )(0.0891 )
Estimates ( 6 )-0.500100.39440000
(p-val)(0 )(NA )(0.001 )(NA )(NA )(NA )(NA )
Estimates ( 7 )NANANANANANANA
(p-val)(NA )(NA )(NA )(NA )(NA )(NA )(NA )
Estimates ( 8 )NANANANANANANA
(p-val)(NA )(NA )(NA )(NA )(NA )(NA )(NA )
Estimates ( 9 )NANANANANANANA
(p-val)(NA )(NA )(NA )(NA )(NA )(NA )(NA )
Estimates ( 10 )NANANANANANANA
(p-val)(NA )(NA )(NA )(NA )(NA )(NA )(NA )
Estimates ( 11 )NANANANANANANA
(p-val)(NA )(NA )(NA )(NA )(NA )(NA )(NA )
Estimates ( 12 )NANANANANANANA
(p-val)(NA )(NA )(NA )(NA )(NA )(NA )(NA )
Estimates ( 13 )NANANANANANANA
(p-val)(NA )(NA )(NA )(NA )(NA )(NA )(NA )

\begin{tabular}{lllllllll}
\hline
ARIMA Parameter Estimation and Backward Selection \tabularnewline
Iteration & ar1 & ar2 & ar3 & ma1 & sar1 & sar2 & sma1 \tabularnewline
Estimates ( 1 ) & -0.2989 & 0.1146 & 0.455 & -0.1442 & 0.4208 & -0.1519 & -0.9971 \tabularnewline
(p-val) & (0.2315 ) & (0.4982 ) & (0.0013 ) & (0.6016 ) & (0.0824 ) & (0.5907 ) & (0.1425 ) \tabularnewline
Estimates ( 2 ) & -0.4055 & 0.061 & 0.4292 & 0 & 0.4237 & -0.1984 & -0.9999 \tabularnewline
(p-val) & (0.0068 ) & (0.6743 ) & (0.0015 ) & (NA ) & (0.073 ) & (0.448 ) & (0.1542 ) \tabularnewline
Estimates ( 3 ) & -0.4328 & 0 & 0.4051 & 0 & 0.4197 & -0.1774 & -0.9997 \tabularnewline
(p-val) & (0.0016 ) & (NA ) & (8e-04 ) & (NA ) & (0.0841 ) & (0.4979 ) & (0.1582 ) \tabularnewline
Estimates ( 4 ) & -0.4678 & 0 & 0.4104 & 0 & 0.4649 & 0 & -1 \tabularnewline
(p-val) & (1e-04 ) & (NA ) & (5e-04 ) & (NA ) & (0.0508 ) & (NA ) & (0.0312 ) \tabularnewline
Estimates ( 5 ) & -0.4977 & 0 & 0.418 & 0 & 0 & 0 & -0.3894 \tabularnewline
(p-val) & (0 ) & (NA ) & (3e-04 ) & (NA ) & (NA ) & (NA ) & (0.0891 ) \tabularnewline
Estimates ( 6 ) & -0.5001 & 0 & 0.3944 & 0 & 0 & 0 & 0 \tabularnewline
(p-val) & (0 ) & (NA ) & (0.001 ) & (NA ) & (NA ) & (NA ) & (NA ) \tabularnewline
Estimates ( 7 ) & NA & NA & NA & NA & NA & NA & NA \tabularnewline
(p-val) & (NA ) & (NA ) & (NA ) & (NA ) & (NA ) & (NA ) & (NA ) \tabularnewline
Estimates ( 8 ) & NA & NA & NA & NA & NA & NA & NA \tabularnewline
(p-val) & (NA ) & (NA ) & (NA ) & (NA ) & (NA ) & (NA ) & (NA ) \tabularnewline
Estimates ( 9 ) & NA & NA & NA & NA & NA & NA & NA \tabularnewline
(p-val) & (NA ) & (NA ) & (NA ) & (NA ) & (NA ) & (NA ) & (NA ) \tabularnewline
Estimates ( 10 ) & NA & NA & NA & NA & NA & NA & NA \tabularnewline
(p-val) & (NA ) & (NA ) & (NA ) & (NA ) & (NA ) & (NA ) & (NA ) \tabularnewline
Estimates ( 11 ) & NA & NA & NA & NA & NA & NA & NA \tabularnewline
(p-val) & (NA ) & (NA ) & (NA ) & (NA ) & (NA ) & (NA ) & (NA ) \tabularnewline
Estimates ( 12 ) & NA & NA & NA & NA & NA & NA & NA \tabularnewline
(p-val) & (NA ) & (NA ) & (NA ) & (NA ) & (NA ) & (NA ) & (NA ) \tabularnewline
Estimates ( 13 ) & NA & NA & NA & NA & NA & NA & NA \tabularnewline
(p-val) & (NA ) & (NA ) & (NA ) & (NA ) & (NA ) & (NA ) & (NA ) \tabularnewline
\hline
\end{tabular}
%Source: https://freestatistics.org/blog/index.php?pk=67048&T=1

[TABLE]
[ROW][C]ARIMA Parameter Estimation and Backward Selection[/C][/ROW]
[ROW][C]Iteration[/C][C]ar1[/C][C]ar2[/C][C]ar3[/C][C]ma1[/C][C]sar1[/C][C]sar2[/C][C]sma1[/C][/ROW]
[ROW][C]Estimates ( 1 )[/C][C]-0.2989[/C][C]0.1146[/C][C]0.455[/C][C]-0.1442[/C][C]0.4208[/C][C]-0.1519[/C][C]-0.9971[/C][/ROW]
[ROW][C](p-val)[/C][C](0.2315 )[/C][C](0.4982 )[/C][C](0.0013 )[/C][C](0.6016 )[/C][C](0.0824 )[/C][C](0.5907 )[/C][C](0.1425 )[/C][/ROW]
[ROW][C]Estimates ( 2 )[/C][C]-0.4055[/C][C]0.061[/C][C]0.4292[/C][C]0[/C][C]0.4237[/C][C]-0.1984[/C][C]-0.9999[/C][/ROW]
[ROW][C](p-val)[/C][C](0.0068 )[/C][C](0.6743 )[/C][C](0.0015 )[/C][C](NA )[/C][C](0.073 )[/C][C](0.448 )[/C][C](0.1542 )[/C][/ROW]
[ROW][C]Estimates ( 3 )[/C][C]-0.4328[/C][C]0[/C][C]0.4051[/C][C]0[/C][C]0.4197[/C][C]-0.1774[/C][C]-0.9997[/C][/ROW]
[ROW][C](p-val)[/C][C](0.0016 )[/C][C](NA )[/C][C](8e-04 )[/C][C](NA )[/C][C](0.0841 )[/C][C](0.4979 )[/C][C](0.1582 )[/C][/ROW]
[ROW][C]Estimates ( 4 )[/C][C]-0.4678[/C][C]0[/C][C]0.4104[/C][C]0[/C][C]0.4649[/C][C]0[/C][C]-1[/C][/ROW]
[ROW][C](p-val)[/C][C](1e-04 )[/C][C](NA )[/C][C](5e-04 )[/C][C](NA )[/C][C](0.0508 )[/C][C](NA )[/C][C](0.0312 )[/C][/ROW]
[ROW][C]Estimates ( 5 )[/C][C]-0.4977[/C][C]0[/C][C]0.418[/C][C]0[/C][C]0[/C][C]0[/C][C]-0.3894[/C][/ROW]
[ROW][C](p-val)[/C][C](0 )[/C][C](NA )[/C][C](3e-04 )[/C][C](NA )[/C][C](NA )[/C][C](NA )[/C][C](0.0891 )[/C][/ROW]
[ROW][C]Estimates ( 6 )[/C][C]-0.5001[/C][C]0[/C][C]0.3944[/C][C]0[/C][C]0[/C][C]0[/C][C]0[/C][/ROW]
[ROW][C](p-val)[/C][C](0 )[/C][C](NA )[/C][C](0.001 )[/C][C](NA )[/C][C](NA )[/C][C](NA )[/C][C](NA )[/C][/ROW]
[ROW][C]Estimates ( 7 )[/C][C]NA[/C][C]NA[/C][C]NA[/C][C]NA[/C][C]NA[/C][C]NA[/C][C]NA[/C][/ROW]
[ROW][C](p-val)[/C][C](NA )[/C][C](NA )[/C][C](NA )[/C][C](NA )[/C][C](NA )[/C][C](NA )[/C][C](NA )[/C][/ROW]
[ROW][C]Estimates ( 8 )[/C][C]NA[/C][C]NA[/C][C]NA[/C][C]NA[/C][C]NA[/C][C]NA[/C][C]NA[/C][/ROW]
[ROW][C](p-val)[/C][C](NA )[/C][C](NA )[/C][C](NA )[/C][C](NA )[/C][C](NA )[/C][C](NA )[/C][C](NA )[/C][/ROW]
[ROW][C]Estimates ( 9 )[/C][C]NA[/C][C]NA[/C][C]NA[/C][C]NA[/C][C]NA[/C][C]NA[/C][C]NA[/C][/ROW]
[ROW][C](p-val)[/C][C](NA )[/C][C](NA )[/C][C](NA )[/C][C](NA )[/C][C](NA )[/C][C](NA )[/C][C](NA )[/C][/ROW]
[ROW][C]Estimates ( 10 )[/C][C]NA[/C][C]NA[/C][C]NA[/C][C]NA[/C][C]NA[/C][C]NA[/C][C]NA[/C][/ROW]
[ROW][C](p-val)[/C][C](NA )[/C][C](NA )[/C][C](NA )[/C][C](NA )[/C][C](NA )[/C][C](NA )[/C][C](NA )[/C][/ROW]
[ROW][C]Estimates ( 11 )[/C][C]NA[/C][C]NA[/C][C]NA[/C][C]NA[/C][C]NA[/C][C]NA[/C][C]NA[/C][/ROW]
[ROW][C](p-val)[/C][C](NA )[/C][C](NA )[/C][C](NA )[/C][C](NA )[/C][C](NA )[/C][C](NA )[/C][C](NA )[/C][/ROW]
[ROW][C]Estimates ( 12 )[/C][C]NA[/C][C]NA[/C][C]NA[/C][C]NA[/C][C]NA[/C][C]NA[/C][C]NA[/C][/ROW]
[ROW][C](p-val)[/C][C](NA )[/C][C](NA )[/C][C](NA )[/C][C](NA )[/C][C](NA )[/C][C](NA )[/C][C](NA )[/C][/ROW]
[ROW][C]Estimates ( 13 )[/C][C]NA[/C][C]NA[/C][C]NA[/C][C]NA[/C][C]NA[/C][C]NA[/C][C]NA[/C][/ROW]
[ROW][C](p-val)[/C][C](NA )[/C][C](NA )[/C][C](NA )[/C][C](NA )[/C][C](NA )[/C][C](NA )[/C][C](NA )[/C][/ROW]
[/TABLE]
Source: https://freestatistics.org/blog/index.php?pk=67048&T=1

Globally Unique Identifier (entire table): ba.freestatistics.org/blog/index.php?pk=67048&T=1

As an alternative you can also use a QR Code:  

The GUIDs for individual cells are displayed in the table below:

ARIMA Parameter Estimation and Backward Selection
Iterationar1ar2ar3ma1sar1sar2sma1
Estimates ( 1 )-0.29890.11460.455-0.14420.4208-0.1519-0.9971
(p-val)(0.2315 )(0.4982 )(0.0013 )(0.6016 )(0.0824 )(0.5907 )(0.1425 )
Estimates ( 2 )-0.40550.0610.429200.4237-0.1984-0.9999
(p-val)(0.0068 )(0.6743 )(0.0015 )(NA )(0.073 )(0.448 )(0.1542 )
Estimates ( 3 )-0.432800.405100.4197-0.1774-0.9997
(p-val)(0.0016 )(NA )(8e-04 )(NA )(0.0841 )(0.4979 )(0.1582 )
Estimates ( 4 )-0.467800.410400.46490-1
(p-val)(1e-04 )(NA )(5e-04 )(NA )(0.0508 )(NA )(0.0312 )
Estimates ( 5 )-0.497700.418000-0.3894
(p-val)(0 )(NA )(3e-04 )(NA )(NA )(NA )(0.0891 )
Estimates ( 6 )-0.500100.39440000
(p-val)(0 )(NA )(0.001 )(NA )(NA )(NA )(NA )
Estimates ( 7 )NANANANANANANA
(p-val)(NA )(NA )(NA )(NA )(NA )(NA )(NA )
Estimates ( 8 )NANANANANANANA
(p-val)(NA )(NA )(NA )(NA )(NA )(NA )(NA )
Estimates ( 9 )NANANANANANANA
(p-val)(NA )(NA )(NA )(NA )(NA )(NA )(NA )
Estimates ( 10 )NANANANANANANA
(p-val)(NA )(NA )(NA )(NA )(NA )(NA )(NA )
Estimates ( 11 )NANANANANANANA
(p-val)(NA )(NA )(NA )(NA )(NA )(NA )(NA )
Estimates ( 12 )NANANANANANANA
(p-val)(NA )(NA )(NA )(NA )(NA )(NA )(NA )
Estimates ( 13 )NANANANANANANA
(p-val)(NA )(NA )(NA )(NA )(NA )(NA )(NA )


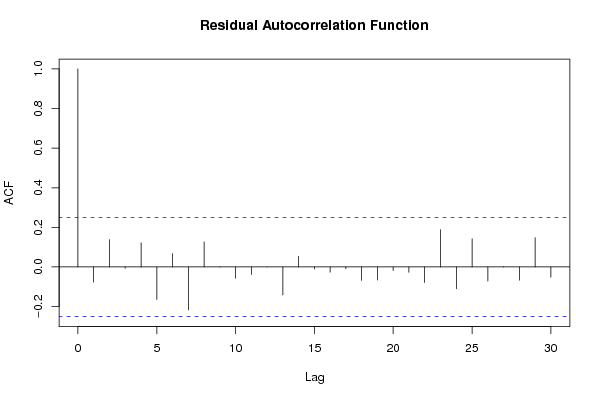
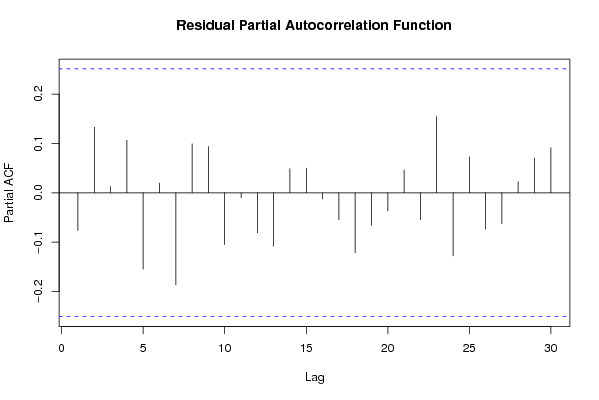
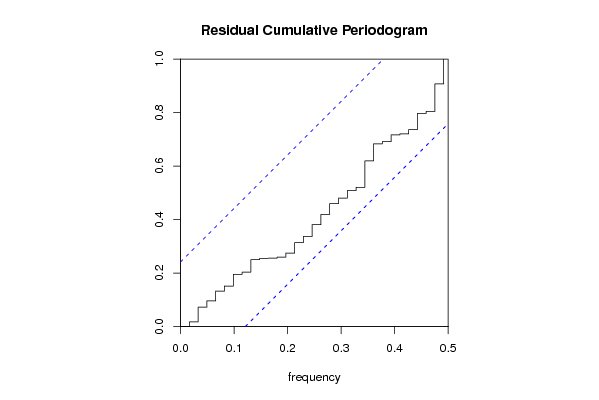
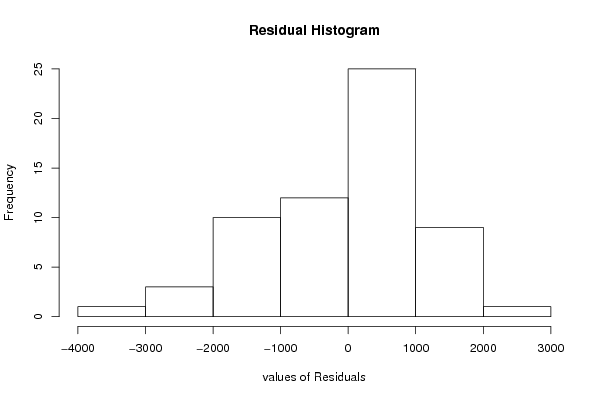
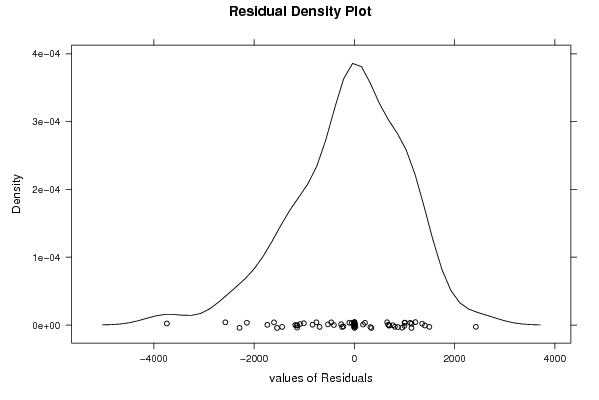
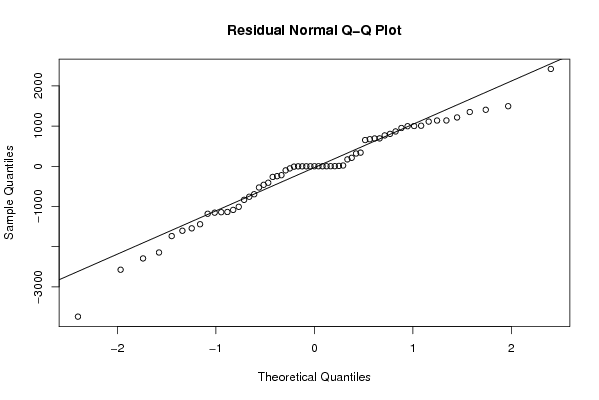
Estimated ARIMA Residuals
Value
-51.1810530981849
173.053424263638
674.867076576601
-757.453113215312
-1007.57884478662
319.375523717437
1113.10054432797
-1180.16164203243
1141.70457726196
807.479048487757
693.039880599724
-1542.50517219311
1010.30888596683
-2143.96935697404
1139.83697866762
-1441.07691193469
769.354673483113
-526.789735614925
211.908869934017
953.833869782457
-459.768326188681
-2291.75864701721
340.558324654599
998.40628396675
-263.620180083793
-244.880527171718
1406.82138016604
20.957234144898
1351.3359889748
-1141.39999647380
-1135.92726199104
1496.25241872859
653.564443850763
-1084.31354358057
1003.37690517463
868.442139436211
-1602.9732022947
2423.17311126526
-834.295697677006
1216.61513960290
-694.129727803405
-408.240064984138
-99.9492474239783
-1153.11877729499
-3740.47670856810
-2572.95208527842
-1735.40041064847
695.41105526812
-220.478725208386

\begin{tabular}{lllllllll}
\hline
Estimated ARIMA Residuals \tabularnewline
Value \tabularnewline
-51.1810530981849 \tabularnewline
173.053424263638 \tabularnewline
674.867076576601 \tabularnewline
-757.453113215312 \tabularnewline
-1007.57884478662 \tabularnewline
319.375523717437 \tabularnewline
1113.10054432797 \tabularnewline
-1180.16164203243 \tabularnewline
1141.70457726196 \tabularnewline
807.479048487757 \tabularnewline
693.039880599724 \tabularnewline
-1542.50517219311 \tabularnewline
1010.30888596683 \tabularnewline
-2143.96935697404 \tabularnewline
1139.83697866762 \tabularnewline
-1441.07691193469 \tabularnewline
769.354673483113 \tabularnewline
-526.789735614925 \tabularnewline
211.908869934017 \tabularnewline
953.833869782457 \tabularnewline
-459.768326188681 \tabularnewline
-2291.75864701721 \tabularnewline
340.558324654599 \tabularnewline
998.40628396675 \tabularnewline
-263.620180083793 \tabularnewline
-244.880527171718 \tabularnewline
1406.82138016604 \tabularnewline
20.957234144898 \tabularnewline
1351.3359889748 \tabularnewline
-1141.39999647380 \tabularnewline
-1135.92726199104 \tabularnewline
1496.25241872859 \tabularnewline
653.564443850763 \tabularnewline
-1084.31354358057 \tabularnewline
1003.37690517463 \tabularnewline
868.442139436211 \tabularnewline
-1602.9732022947 \tabularnewline
2423.17311126526 \tabularnewline
-834.295697677006 \tabularnewline
1216.61513960290 \tabularnewline
-694.129727803405 \tabularnewline
-408.240064984138 \tabularnewline
-99.9492474239783 \tabularnewline
-1153.11877729499 \tabularnewline
-3740.47670856810 \tabularnewline
-2572.95208527842 \tabularnewline
-1735.40041064847 \tabularnewline
695.41105526812 \tabularnewline
-220.478725208386 \tabularnewline
\hline
\end{tabular}
%Source: https://freestatistics.org/blog/index.php?pk=67048&T=2

[TABLE]
[ROW][C]Estimated ARIMA Residuals[/C][/ROW]
[ROW][C]Value[/C][/ROW]
[ROW][C]-51.1810530981849[/C][/ROW]
[ROW][C]173.053424263638[/C][/ROW]
[ROW][C]674.867076576601[/C][/ROW]
[ROW][C]-757.453113215312[/C][/ROW]
[ROW][C]-1007.57884478662[/C][/ROW]
[ROW][C]319.375523717437[/C][/ROW]
[ROW][C]1113.10054432797[/C][/ROW]
[ROW][C]-1180.16164203243[/C][/ROW]
[ROW][C]1141.70457726196[/C][/ROW]
[ROW][C]807.479048487757[/C][/ROW]
[ROW][C]693.039880599724[/C][/ROW]
[ROW][C]-1542.50517219311[/C][/ROW]
[ROW][C]1010.30888596683[/C][/ROW]
[ROW][C]-2143.96935697404[/C][/ROW]
[ROW][C]1139.83697866762[/C][/ROW]
[ROW][C]-1441.07691193469[/C][/ROW]
[ROW][C]769.354673483113[/C][/ROW]
[ROW][C]-526.789735614925[/C][/ROW]
[ROW][C]211.908869934017[/C][/ROW]
[ROW][C]953.833869782457[/C][/ROW]
[ROW][C]-459.768326188681[/C][/ROW]
[ROW][C]-2291.75864701721[/C][/ROW]
[ROW][C]340.558324654599[/C][/ROW]
[ROW][C]998.40628396675[/C][/ROW]
[ROW][C]-263.620180083793[/C][/ROW]
[ROW][C]-244.880527171718[/C][/ROW]
[ROW][C]1406.82138016604[/C][/ROW]
[ROW][C]20.957234144898[/C][/ROW]
[ROW][C]1351.3359889748[/C][/ROW]
[ROW][C]-1141.39999647380[/C][/ROW]
[ROW][C]-1135.92726199104[/C][/ROW]
[ROW][C]1496.25241872859[/C][/ROW]
[ROW][C]653.564443850763[/C][/ROW]
[ROW][C]-1084.31354358057[/C][/ROW]
[ROW][C]1003.37690517463[/C][/ROW]
[ROW][C]868.442139436211[/C][/ROW]
[ROW][C]-1602.9732022947[/C][/ROW]
[ROW][C]2423.17311126526[/C][/ROW]
[ROW][C]-834.295697677006[/C][/ROW]
[ROW][C]1216.61513960290[/C][/ROW]
[ROW][C]-694.129727803405[/C][/ROW]
[ROW][C]-408.240064984138[/C][/ROW]
[ROW][C]-99.9492474239783[/C][/ROW]
[ROW][C]-1153.11877729499[/C][/ROW]
[ROW][C]-3740.47670856810[/C][/ROW]
[ROW][C]-2572.95208527842[/C][/ROW]
[ROW][C]-1735.40041064847[/C][/ROW]
[ROW][C]695.41105526812[/C][/ROW]
[ROW][C]-220.478725208386[/C][/ROW]
[/TABLE]
Source: https://freestatistics.org/blog/index.php?pk=67048&T=2

Globally Unique Identifier (entire table): ba.freestatistics.org/blog/index.php?pk=67048&T=2

As an alternative you can also use a QR Code:  

The GUIDs for individual cells are displayed in the table below:

Estimated ARIMA Residuals
Value
-51.1810530981849
173.053424263638
674.867076576601
-757.453113215312
-1007.57884478662
319.375523717437
1113.10054432797
-1180.16164203243
1141.70457726196
807.479048487757
693.039880599724
-1542.50517219311
1010.30888596683
-2143.96935697404
1139.83697866762
-1441.07691193469
769.354673483113
-526.789735614925
211.908869934017
953.833869782457
-459.768326188681
-2291.75864701721
340.558324654599
998.40628396675
-263.620180083793
-244.880527171718
1406.82138016604
20.957234144898
1351.3359889748
-1141.39999647380
-1135.92726199104
1496.25241872859
653.564443850763
-1084.31354358057
1003.37690517463
868.442139436211
-1602.9732022947
2423.17311126526
-834.295697677006
1216.61513960290
-694.129727803405
-408.240064984138
-99.9492474239783
-1153.11877729499
-3740.47670856810
-2572.95208527842
-1735.40041064847
695.41105526812
-220.478725208386


Parameters (Session):
par1 = FALSE ; par2 = 1 ; par3 = 1 ; par4 = 1 ; par5 = 12 ; par6 = 3 ; par7 = 1 ; par8 = 2 ; par9 = 1 ;
Parameters (R input):
par1 = FALSE ; par2 = 1 ; par3 = 1 ; par4 = 1 ; par5 = 12 ; par6 = 3 ; par7 = 1 ; par8 = 2 ; par9 = 1 ;
R code (references can be found in the software module):
library(lattice)
if (par1 == 'TRUE') par1 <- TRUE
if (par1 == 'FALSE') par1 <- FALSE
par2 <- as.numeric(par2) #Box-Cox lambda transformation parameter
par3 <- as.numeric(par3) #degree of non-seasonal differencing
par4 <- as.numeric(par4) #degree of seasonal differencing
par5 <- as.numeric(par5) #seasonal period
par6 <- as.numeric(par6) #degree (p) of the non-seasonal AR(p) polynomial
par7 <- as.numeric(par7) #degree (q) of the non-seasonal MA(q) polynomial
par8 <- as.numeric(par8) #degree (P) of the seasonal AR(P) polynomial
par9 <- as.numeric(par9) #degree (Q) of the seasonal MA(Q) polynomial
armaGR <- function(arima.out, names, n){
try1 <- arima.out$coef
try2 <- sqrt(diag(arima.out$var.coef))
try.data.frame <- data.frame(matrix(NA,ncol=4,nrow=length(names)))
dimnames(try.data.frame) <- list(names,c('coef','std','tstat','pv'))
try.data.frame[,1] <- try1
for(i in 1:length(try2)) try.data.frame[which(rownames(try.data.frame)==names(try2)[i]),2] <- try2[i]
try.data.frame[,3] <- try.data.frame[,1] / try.data.frame[,2]
try.data.frame[,4] <- round((1-pt(abs(try.data.frame[,3]),df=n-(length(try2)+1)))*2,5)
vector <- rep(NA,length(names))
vector[is.na(try.data.frame[,4])] <- 0
maxi <- which.max(try.data.frame[,4])
continue <- max(try.data.frame[,4],na.rm=TRUE) > .05
vector[maxi] <- 0
list(summary=try.data.frame,next.vector=vector,continue=continue)
}
arimaSelect <- function(series, order=c(13,0,0), seasonal=list(order=c(2,0,0),period=12), include.mean=F){
nrc <- order[1]+order[3]+seasonal$order[1]+seasonal$order[3]
coeff <- matrix(NA, nrow=nrc*2, ncol=nrc)
pval <- matrix(NA, nrow=nrc*2, ncol=nrc)
mylist <- rep(list(NULL), nrc)
names <- NULL
if(order[1] > 0) names <- paste('ar',1:order[1],sep='')
if(order[3] > 0) names <- c( names , paste('ma',1:order[3],sep='') )
if(seasonal$order[1] > 0) names <- c(names, paste('sar',1:seasonal$order[1],sep=''))
if(seasonal$order[3] > 0) names <- c(names, paste('sma',1:seasonal$order[3],sep=''))
arima.out <- arima(series, order=order, seasonal=seasonal, include.mean=include.mean, method='ML')
mylist[[1]] <- arima.out
last.arma <- armaGR(arima.out, names, length(series))
mystop <- FALSE
i <- 1
coeff[i,] <- last.arma[[1]][,1]
pval [i,] <- last.arma[[1]][,4]
i <- 2
aic <- arima.out$aic
while(!mystop){
mylist[[i]] <- arima.out
arima.out <- arima(series, order=order, seasonal=seasonal, include.mean=include.mean, method='ML', fixed=last.arma$next.vector)
aic <- c(aic, arima.out$aic)
last.arma <- armaGR(arima.out, names, length(series))
mystop <- !last.arma$continue
coeff[i,] <- last.arma[[1]][,1]
pval [i,] <- last.arma[[1]][,4]
i <- i+1
}
list(coeff, pval, mylist, aic=aic)
}
arimaSelectplot <- function(arimaSelect.out,noms,choix){
noms <- names(arimaSelect.out[[3]][[1]]$coef)
coeff <- arimaSelect.out[[1]]
k <- min(which(is.na(coeff[,1])))-1
coeff <- coeff[1:k,]
pval <- arimaSelect.out[[2]][1:k,]
aic <- arimaSelect.out$aic[1:k]
coeff[coeff==0] <- NA
n <- ncol(coeff)
if(missing(choix)) choix <- k
layout(matrix(c(1,1,1,2,
3,3,3,2,
3,3,3,4,
5,6,7,7),nr=4),
widths=c(10,35,45,15),
heights=c(30,30,15,15))
couleurs <- rainbow(75)[1:50]#(50)
ticks <- pretty(coeff)
par(mar=c(1,1,3,1))
plot(aic,k:1-.5,type='o',pch=21,bg='blue',cex=2,axes=F,lty=2,xpd=NA)
points(aic[choix],k-choix+.5,pch=21,cex=4,bg=2,xpd=NA)
title('aic',line=2)
par(mar=c(3,0,0,0))
plot(0,axes=F,xlab='',ylab='',xlim=range(ticks),ylim=c(.1,1))
rect(xleft = min(ticks) + (0:49)/50*(max(ticks)-min(ticks)),
xright = min(ticks) + (1:50)/50*(max(ticks)-min(ticks)),
ytop = rep(1,50),
ybottom= rep(0,50),col=couleurs,border=NA)
axis(1,ticks)
rect(xleft=min(ticks),xright=max(ticks),ytop=1,ybottom=0)
text(mean(coeff,na.rm=T),.5,'coefficients',cex=2,font=2)
par(mar=c(1,1,3,1))
image(1:n,1:k,t(coeff[k:1,]),axes=F,col=couleurs,zlim=range(ticks))
for(i in 1:n) for(j in 1:k) if(!is.na(coeff[j,i])) {
if(pval[j,i]<.01) symb = 'green'
else if( (pval[j,i]<.05) & (pval[j,i]>=.01)) symb = 'orange'
else if( (pval[j,i]<.1) & (pval[j,i]>=.05)) symb = 'red'
else symb = 'black'
polygon(c(i+.5 ,i+.2 ,i+.5 ,i+.5),
c(k-j+0.5,k-j+0.5,k-j+0.8,k-j+0.5),
col=symb)
if(j==choix) {
rect(xleft=i-.5,
xright=i+.5,
ybottom=k-j+1.5,
ytop=k-j+.5,
lwd=4)
text(i,
k-j+1,
round(coeff[j,i],2),
cex=1.2,
font=2)
}
else{
rect(xleft=i-.5,xright=i+.5,ybottom=k-j+1.5,ytop=k-j+.5)
text(i,k-j+1,round(coeff[j,i],2),cex=1.2,font=1)
}
}
axis(3,1:n,noms)
par(mar=c(0.5,0,0,0.5))
plot(0,axes=F,xlab='',ylab='',type='n',xlim=c(0,8),ylim=c(-.2,.8))
cols <- c('green','orange','red','black')
niv <- c('0','0.01','0.05','0.1')
for(i in 0:3){
polygon(c(1+2*i ,1+2*i ,1+2*i-.5 ,1+2*i),
c(.4 ,.7 , .4 , .4),
col=cols[i+1])
text(2*i,0.5,niv[i+1],cex=1.5)
}
text(8,.5,1,cex=1.5)
text(4,0,'p-value',cex=2)
box()
residus <- arimaSelect.out[[3]][[choix]]$res
par(mar=c(1,2,4,1))
acf(residus,main='')
title('acf',line=.5)
par(mar=c(1,2,4,1))
pacf(residus,main='')
title('pacf',line=.5)
par(mar=c(2,2,4,1))
qqnorm(residus,main='')
title('qq-norm',line=.5)
qqline(residus)
residus
}
if (par2 == 0) x <- log(x)
if (par2 != 0) x <- x^par2
(selection <- arimaSelect(x, order=c(par6,par3,par7), seasonal=list(order=c(par8,par4,par9), period=par5)))
bitmap(file='test1.png')
resid <- arimaSelectplot(selection)
dev.off()
resid
bitmap(file='test2.png')
acf(resid,length(resid)/2, main='Residual Autocorrelation Function')
dev.off()
bitmap(file='test3.png')
pacf(resid,length(resid)/2, main='Residual Partial Autocorrelation Function')
dev.off()
bitmap(file='test4.png')
cpgram(resid, main='Residual Cumulative Periodogram')
dev.off()
bitmap(file='test5.png')
hist(resid, main='Residual Histogram', xlab='values of Residuals')
dev.off()
bitmap(file='test6.png')
densityplot(~resid,col='black',main='Residual Density Plot', xlab='values of Residuals')
dev.off()
bitmap(file='test7.png')
qqnorm(resid, main='Residual Normal Q-Q Plot')
qqline(resid)
dev.off()
ncols <- length(selection[[1]][1,])
nrows <- length(selection[[2]][,1])-1
load(file='createtable')
a<-table.start()
a<-table.row.start(a)
a<-table.element(a,'ARIMA Parameter Estimation and Backward Selection', ncols+1,TRUE)
a<-table.row.end(a)
a<-table.row.start(a)
a<-table.element(a,'Iteration', header=TRUE)
for (i in 1:ncols) {
a<-table.element(a,names(selection[[3]][[1]]$coef)[i],header=TRUE)
}
a<-table.row.end(a)
for (j in 1:nrows) {
a<-table.row.start(a)
mydum <- 'Estimates ('
mydum <- paste(mydum,j)
mydum <- paste(mydum,')')
a<-table.element(a,mydum, header=TRUE)
for (i in 1:ncols) {
a<-table.element(a,round(selection[[1]][j,i],4))
}
a<-table.row.end(a)
a<-table.row.start(a)
a<-table.element(a,'(p-val)', header=TRUE)
for (i in 1:ncols) {
mydum <- '('
mydum <- paste(mydum,round(selection[[2]][j,i],4),sep='')
mydum <- paste(mydum,')')
a<-table.element(a,mydum)
}
a<-table.row.end(a)
}
a<-table.end(a)
table.save(a,file='mytable.tab')
a<-table.start()
a<-table.row.start(a)
a<-table.element(a,'Estimated ARIMA Residuals', 1,TRUE)
a<-table.row.end(a)
a<-table.row.start(a)
a<-table.element(a,'Value', 1,TRUE)
a<-table.row.end(a)
for (i in (par4*par5+par3):length(resid)) {
a<-table.row.start(a)
a<-table.element(a,resid[i])
a<-table.row.end(a)
}
a<-table.end(a)
table.save(a,file='mytable1.tab')