| Multiple Linear Regression - Estimated Regression Equation |
| y[t] = + 13885.4782857143 -5222.53071428571x[t] + 3300.83403571430M1[t] + 3383.94492857143M2[t] + 3312.40196428572M3[t] + 1479.29285714285M4[t] + 1972.46375000000M5[t] + 2104.89464285714M6[t] + 4025.66553571428M7[t] + 2430.13642857143M8[t] + 2487.58732142857M9[t] + 3855.41821428571M10[t] + 2161.90910714286M11[t] + 105.269107142857t + e[t] |
| Multiple Linear Regression - Ordinary Least Squares | |||||
| Variable | Parameter | S.D. | T-STAT H0: parameter = 0 | 2-tail p-value | 1-tail p-value |
| (Intercept) | 13885.4782857143 | 459.748416 | 30.2023 | 0 | 0 |
| x | -5222.53071428571 | 392.312604 | -13.3122 | 0 | 0 |
| M1 | 3300.83403571430 | 540.98956 | 6.1015 | 0 | 0 |
| M2 | 3383.94492857143 | 540.396536 | 6.262 | 0 | 0 |
| M3 | 3312.40196428572 | 541.358225 | 6.1187 | 0 | 0 |
| M4 | 1479.29285714285 | 540.238286 | 2.7382 | 0.008756 | 0.004378 |
| M5 | 1972.46375000000 | 539.248173 | 3.6578 | 0.000652 | 0.000326 |
| M6 | 2104.89464285714 | 538.388602 | 3.9096 | 0.000302 | 0.000151 |
| M7 | 4025.66553571428 | 537.6602 | 7.4874 | 0 | 0 |
| M8 | 2430.13642857143 | 537.063499 | 4.5249 | 4.2e-05 | 2.1e-05 |
| M9 | 2487.58732142857 | 536.59894 | 4.6358 | 3e-05 | 1.5e-05 |
| M10 | 3855.41821428571 | 536.266865 | 7.1894 | 0 | 0 |
| M11 | 2161.90910714286 | 536.067522 | 4.0329 | 0.000206 | 0.000103 |
| t | 105.269107142857 | 8.441223 | 12.4708 | 0 | 0 |
| Multiple Linear Regression - Regression Statistics | |
| Multiple R | 0.932532816632137 |
| R-squared | 0.869617454095868 |
| Adjusted R-squared | 0.832770212862091 |
| F-TEST (value) | 23.6006122840676 |
| F-TEST (DF numerator) | 13 |
| F-TEST (DF denominator) | 46 |
| p-value | 4.44089209850063e-16 |
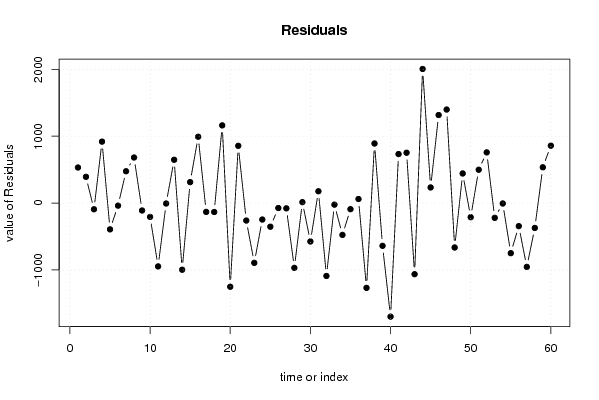
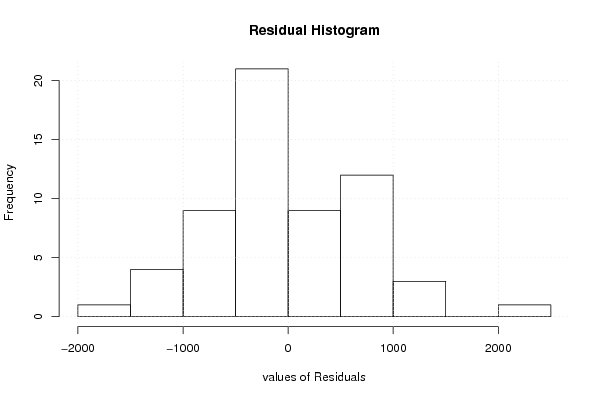
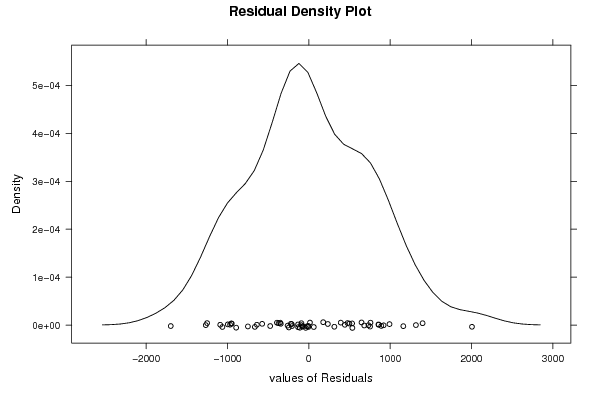
| Multiple Linear Regression - Residual Statistics | |
| Residual Standard Deviation | 847.492085553841 |
| Sum Squared Residuals | 33039170.4135144 |
| Multiple Linear Regression - Actuals, Interpolation, and Residuals | |||
| Time or Index | Actuals | Interpolation Forecast | Residuals Prediction Error |
| 1 | 17823.2 | 17291.5814285714 | 531.618571428623 |
| 2 | 17872 | 17479.9614285714 | 392.038571428562 |
| 3 | 17420.4 | 17513.6875714286 | -93.287571428569 |
| 4 | 16704.4 | 15785.8475714286 | 918.552428571425 |
| 5 | 15991.2 | 16384.2875714286 | -393.087571428578 |
| 6 | 16583.6 | 16621.9875714286 | -38.3875714285738 |
| 7 | 19123.5 | 18648.0275714286 | 475.472428571427 |
| 8 | 17838.7 | 17157.7675714286 | 680.932428571427 |
| 9 | 17209.4 | 17320.4875714286 | -111.087571428570 |
| 10 | 18586.5 | 18793.5875714286 | -207.087571428575 |
| 11 | 16258.1 | 17205.3475714286 | -947.247571428577 |
| 12 | 15141.6 | 15148.7075714286 | -7.10757142857226 |
| 13 | 19202.1 | 18554.8107142857 | 647.289285714269 |
| 14 | 17746.5 | 18743.1907142857 | -996.690714285716 |
| 15 | 19090.1 | 18776.9168571429 | 313.183142857139 |
| 16 | 18040.3 | 17049.0768571429 | 991.22314285714 |
| 17 | 17515.5 | 17647.5168571429 | -132.016857142857 |
| 18 | 17751.8 | 17885.2168571429 | -133.416857142858 |
| 19 | 21072.4 | 19911.2568571429 | 1161.14314285714 |
| 20 | 17170 | 18420.9968571429 | -1250.99685714286 |
| 21 | 19439.5 | 18583.7168571429 | 855.783142857141 |
| 22 | 19795.4 | 20056.8168571429 | -261.416857142857 |
| 23 | 17574.9 | 18468.5768571429 | -893.676857142858 |
| 24 | 16165.4 | 16411.9368571429 | -246.536857142859 |
| 25 | 19464.6 | 19818.04 | -353.440000000014 |
| 26 | 19932.1 | 20006.42 | -74.3199999999989 |
| 27 | 19961.2 | 20040.1461428571 | -78.9461428571426 |
| 28 | 17343.4 | 18312.3061428571 | -968.906142857141 |
| 29 | 18924.2 | 18910.7461428571 | 13.4538571428598 |
| 30 | 18574.1 | 19148.4461428571 | -574.346142857143 |
| 31 | 21350.6 | 21174.4861428571 | 176.113857142855 |
| 32 | 18594.6 | 19684.2261428571 | -1089.62614285714 |
| 33 | 19823.1 | 19846.9461428571 | -23.8461428571441 |
| 34 | 20844.4 | 21320.0461428571 | -475.646142857141 |
| 35 | 19640.2 | 19731.8061428571 | -91.606142857142 |
| 36 | 17735.4 | 17675.1661428571 | 60.233857142859 |
| 37 | 19813.6 | 21081.2692857143 | -1267.66928571430 |
| 38 | 22160 | 21269.6492857143 | 890.350714285718 |
| 39 | 20664.3 | 21303.3754285714 | -639.075428571428 |
| 40 | 17877.4 | 19575.5354285714 | -1698.13542857142 |
| 41 | 20906.5 | 20173.9754285714 | 732.524571428576 |
| 42 | 21164.1 | 20411.6754285714 | 752.424571428574 |
| 43 | 21374.4 | 22437.7154285714 | -1063.31542857142 |
| 44 | 22952.3 | 20947.4554285714 | 2004.84457142857 |
| 45 | 21343.5 | 21110.1754285714 | 233.324571428574 |
| 46 | 23899.3 | 22583.2754285714 | 1316.02457142857 |
| 47 | 22392.9 | 20995.0354285714 | 1397.86457142857 |
| 48 | 18274.1 | 18938.3954285714 | -664.295428571428 |
| 49 | 22786.7 | 22344.4985714286 | 442.201428571421 |
| 50 | 22321.5 | 22532.8785714286 | -211.378571428566 |
| 51 | 17842.2 | 17344.074 | 498.126 |
| 52 | 16373.5 | 15616.234 | 757.266 |
| 53 | 15993.8 | 16214.674 | -220.873999999998 |
| 54 | 16446.1 | 16452.374 | -6.27399999999999 |
| 55 | 17729 | 18478.414 | -749.414 |
| 56 | 16643 | 16988.154 | -345.154 |
| 57 | 16196.7 | 17150.874 | -954.174 |
| 58 | 18252.1 | 18623.974 | -371.874000000001 |
| 59 | 17570.4 | 17035.734 | 534.666000000001 |
| 60 | 15836.8 | 14979.094 | 857.706 |
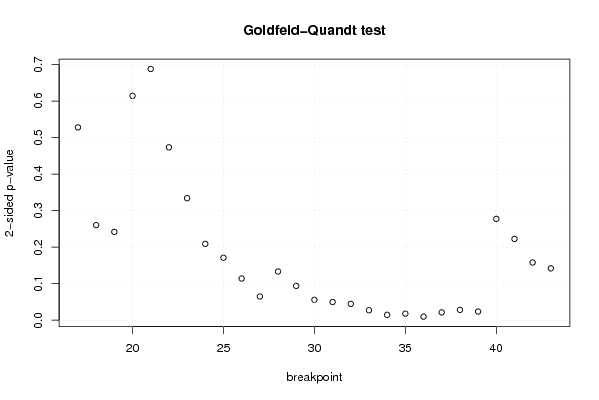
| Goldfeld-Quandt test for Heteroskedasticity | |||
| p-values | Alternative Hypothesis | ||
| breakpoint index | greater | 2-sided | less |
| 17 | 0.263978226984574 | 0.527956453969148 | 0.736021773015426 |
| 18 | 0.130170854301685 | 0.260341708603369 | 0.869829145698315 |
| 19 | 0.120962216140878 | 0.241924432281755 | 0.879037783859122 |
| 20 | 0.307166303240842 | 0.614332606481684 | 0.692833696759158 |
| 21 | 0.343955574412707 | 0.687911148825414 | 0.656044425587293 |
| 22 | 0.236692948738663 | 0.473385897477326 | 0.763307051261337 |
| 23 | 0.167070463452561 | 0.334140926905121 | 0.832929536547439 |
| 24 | 0.104590270935149 | 0.209180541870299 | 0.89540972906485 |
| 25 | 0.0855582692634885 | 0.171116538526977 | 0.914441730736511 |
| 26 | 0.0571023601980193 | 0.114204720396039 | 0.94289763980198 |
| 27 | 0.0324893425166943 | 0.0649786850333886 | 0.967510657483306 |
| 28 | 0.066664048310132 | 0.133328096620264 | 0.933335951689868 |
| 29 | 0.0470669607733143 | 0.0941339215466286 | 0.952933039226686 |
| 30 | 0.0279640412501427 | 0.0559280825002854 | 0.972035958749857 |
| 31 | 0.0249083341640035 | 0.0498166683280071 | 0.975091665835996 |
| 32 | 0.0224489060758926 | 0.0448978121517853 | 0.977551093924107 |
| 33 | 0.0136674374803500 | 0.0273348749606999 | 0.98633256251965 |
| 34 | 0.00740607119974195 | 0.0148121423994839 | 0.992593928800258 |
| 35 | 0.00903411893295755 | 0.0180682378659151 | 0.990965881067043 |
| 36 | 0.00490164241674041 | 0.00980328483348083 | 0.99509835758326 |
| 37 | 0.0107791622217323 | 0.0215583244434646 | 0.989220837778268 |
| 38 | 0.0141818039287866 | 0.0283636078575731 | 0.985818196071213 |
| 39 | 0.0118860294186950 | 0.0237720588373901 | 0.988113970581305 |
| 40 | 0.138737756053352 | 0.277475512106704 | 0.861262243946648 |
| 41 | 0.111307123704572 | 0.222614247409144 | 0.888692876295428 |
| 42 | 0.079021168107202 | 0.158042336214404 | 0.920978831892798 |
| 43 | 0.070990839699788 | 0.141981679399576 | 0.929009160300212 |
| Meta Analysis of Goldfeld-Quandt test for Heteroskedasticity | |||
| Description | # significant tests | % significant tests | OK/NOK |
| 1% type I error level | 1 | 0.0370370370370370 | NOK |
| 5% type I error level | 9 | 0.333333333333333 | NOK |
| 10% type I error level | 12 | 0.444444444444444 | NOK |