Free Statistics

of Irreproducible Research!

Author's title

Author*The author of this computation has been verified*
R Software Modulerwasp_autocorrelation.wasp
Title produced by software(Partial) Autocorrelation Function
Date of computationSat, 12 Dec 2009 07:21:43 -0700
Cite this page as followsStatistical Computations at FreeStatistics.org, Office for Research Development and Education, URL https://freestatistics.org/blog/index.php?v=date/2009/Dec/12/t1260627862au54qiib4hul94v.htm/, Retrieved Mon, 29 Apr 2024 11:50:41 +0000
Statistical Computations at FreeStatistics.org, Office for Research Development and Education, URL https://freestatistics.org/blog/index.php?pk=66982, Retrieved Mon, 29 Apr 2024 11:50:41 +0000
QR Codes:

Original text written by user:
IsPrivate?No (this computation is public)
User-defined keywords
Estimated Impact132
Family? (F = Feedback message, R = changed R code, M = changed R Module, P = changed Parameters, D = changed Data)
-       [(Partial) Autocorrelation Function] [Bruto Industriële...] [2009-12-12 14:21:43] [efdfe680cd785c4af09f858b30f777ec] [Current]
Feedback Forum

Post a new message
Dataseries X:
98.8
100.5
110.4
96.4
101.9
106.2
81
94.7
101
109.4
102.3
90.7
96.2
96.1
106
103.1
102
104.7
86
92.1
106.9
112.6
101.7
92
97.4
97
105.4
102.7
98.1
104.5
87.4
89.9
109.8
111.7
98.6
96.9
95.1
97
112.7
102.9
97.4
111.4
87.4
96.8
114.1
110.3
103.9
101.6
94.6
95.9
104.7
102.8
98.1
113.9
80.9
95.7
113.2
105.9
108.8
102.3
99
100.7
115.5
100.7
109.9
114.6
85.4
100.5
114.8
116.5
112.9
102
106
105.3
118.8
106.1
109.3
117.2
92.5
104.2
112.5
122.4
113.3
100
110.7
112.8
109.8
117.3
109.1
115.9
96
99.8
116.8
115.7
99.4
94.3
91
93.2
103.1
94.1
91.8
102.7
82.6
89.1
104.5


Summary of computational transaction
Raw Inputview raw input (R code)
Raw Outputview raw output of R engine
Computing time2 seconds
R Server'Gwilym Jenkins' @ 72.249.127.135

\begin{tabular}{lllllllll}
\hline
Summary of computational transaction \tabularnewline
Raw Input & view raw input (R code)  \tabularnewline
Raw Output & view raw output of R engine  \tabularnewline
Computing time & 2 seconds \tabularnewline
R Server & 'Gwilym Jenkins' @ 72.249.127.135 \tabularnewline
\hline
\end{tabular}
%Source: https://freestatistics.org/blog/index.php?pk=66982&T=0

[TABLE]
[ROW][C]Summary of computational transaction[/C][/ROW]
[ROW][C]Raw Input[/C][C]view raw input (R code) [/C][/ROW]
[ROW][C]Raw Output[/C][C]view raw output of R engine [/C][/ROW]
[ROW][C]Computing time[/C][C]2 seconds[/C][/ROW]
[ROW][C]R Server[/C][C]'Gwilym Jenkins' @ 72.249.127.135[/C][/ROW]
[/TABLE]
Source: https://freestatistics.org/blog/index.php?pk=66982&T=0

Globally Unique Identifier (entire table): ba.freestatistics.org/blog/index.php?pk=66982&T=0

As an alternative you can also use a QR Code:  

The GUIDs for individual cells are displayed in the table below:

Summary of computational transaction
Raw Inputview raw input (R code)
Raw Outputview raw output of R engine
Computing time2 seconds
R Server'Gwilym Jenkins' @ 72.249.127.135


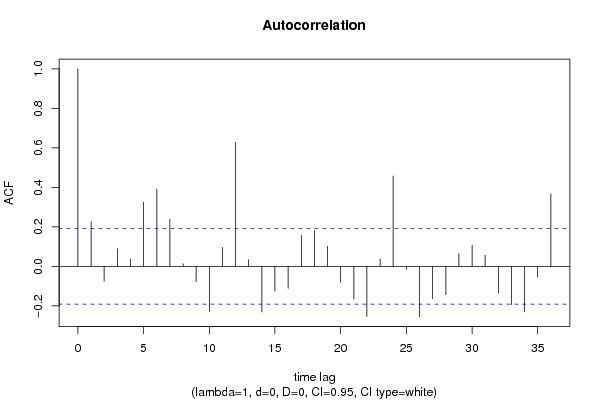
Autocorrelation Function
Time lag kACF(k)T-STATP-value
10.2271262.32730.010933
2-0.074756-0.7660.222692
30.0893580.91560.180976
40.0367970.37710.353445
50.3247863.32810.000603
60.3922964.01985.5e-05
70.2377682.43640.008258
80.012960.13280.447302
9-0.07802-0.79950.212911
10-0.228001-2.33630.010687
110.0959290.9830.16394
120.6287216.44250
130.0338440.34680.364719
14-0.230599-2.36290.009986
15-0.126442-1.29560.09897
16-0.1112-1.13950.128551
170.1566711.60540.055704
180.1808581.85320.033328
190.1023711.0490.148295
20-0.081495-0.83510.202786
21-0.164842-1.68910.047082
22-0.254102-2.60380.005278
230.0369570.37870.352839
240.4573024.6864e-06
25-0.015365-0.15740.437599
26-0.254682-2.60970.005192
27-0.164244-1.6830.047674
28-0.143122-1.46660.072742
290.0639430.65520.256881
300.1069841.09630.137737
310.0568880.58290.280594
32-0.135073-1.38410.084633
33-0.194786-1.9960.024264
34-0.230049-2.35730.010131
35-0.053885-0.55220.291007
360.3675173.76590.000137

\begin{tabular}{lllllllll}
\hline
Autocorrelation Function \tabularnewline
Time lag k & ACF(k) & T-STAT & P-value \tabularnewline
1 & 0.227126 & 2.3273 & 0.010933 \tabularnewline
2 & -0.074756 & -0.766 & 0.222692 \tabularnewline
3 & 0.089358 & 0.9156 & 0.180976 \tabularnewline
4 & 0.036797 & 0.3771 & 0.353445 \tabularnewline
5 & 0.324786 & 3.3281 & 0.000603 \tabularnewline
6 & 0.392296 & 4.0198 & 5.5e-05 \tabularnewline
7 & 0.237768 & 2.4364 & 0.008258 \tabularnewline
8 & 0.01296 & 0.1328 & 0.447302 \tabularnewline
9 & -0.07802 & -0.7995 & 0.212911 \tabularnewline
10 & -0.228001 & -2.3363 & 0.010687 \tabularnewline
11 & 0.095929 & 0.983 & 0.16394 \tabularnewline
12 & 0.628721 & 6.4425 & 0 \tabularnewline
13 & 0.033844 & 0.3468 & 0.364719 \tabularnewline
14 & -0.230599 & -2.3629 & 0.009986 \tabularnewline
15 & -0.126442 & -1.2956 & 0.09897 \tabularnewline
16 & -0.1112 & -1.1395 & 0.128551 \tabularnewline
17 & 0.156671 & 1.6054 & 0.055704 \tabularnewline
18 & 0.180858 & 1.8532 & 0.033328 \tabularnewline
19 & 0.102371 & 1.049 & 0.148295 \tabularnewline
20 & -0.081495 & -0.8351 & 0.202786 \tabularnewline
21 & -0.164842 & -1.6891 & 0.047082 \tabularnewline
22 & -0.254102 & -2.6038 & 0.005278 \tabularnewline
23 & 0.036957 & 0.3787 & 0.352839 \tabularnewline
24 & 0.457302 & 4.686 & 4e-06 \tabularnewline
25 & -0.015365 & -0.1574 & 0.437599 \tabularnewline
26 & -0.254682 & -2.6097 & 0.005192 \tabularnewline
27 & -0.164244 & -1.683 & 0.047674 \tabularnewline
28 & -0.143122 & -1.4666 & 0.072742 \tabularnewline
29 & 0.063943 & 0.6552 & 0.256881 \tabularnewline
30 & 0.106984 & 1.0963 & 0.137737 \tabularnewline
31 & 0.056888 & 0.5829 & 0.280594 \tabularnewline
32 & -0.135073 & -1.3841 & 0.084633 \tabularnewline
33 & -0.194786 & -1.996 & 0.024264 \tabularnewline
34 & -0.230049 & -2.3573 & 0.010131 \tabularnewline
35 & -0.053885 & -0.5522 & 0.291007 \tabularnewline
36 & 0.367517 & 3.7659 & 0.000137 \tabularnewline
\hline
\end{tabular}
%Source: https://freestatistics.org/blog/index.php?pk=66982&T=1

[TABLE]
[ROW][C]Autocorrelation Function[/C][/ROW]
[ROW][C]Time lag k[/C][C]ACF(k)[/C][C]T-STAT[/C][C]P-value[/C][/ROW]
[ROW][C]1[/C][C]0.227126[/C][C]2.3273[/C][C]0.010933[/C][/ROW]
[ROW][C]2[/C][C]-0.074756[/C][C]-0.766[/C][C]0.222692[/C][/ROW]
[ROW][C]3[/C][C]0.089358[/C][C]0.9156[/C][C]0.180976[/C][/ROW]
[ROW][C]4[/C][C]0.036797[/C][C]0.3771[/C][C]0.353445[/C][/ROW]
[ROW][C]5[/C][C]0.324786[/C][C]3.3281[/C][C]0.000603[/C][/ROW]
[ROW][C]6[/C][C]0.392296[/C][C]4.0198[/C][C]5.5e-05[/C][/ROW]
[ROW][C]7[/C][C]0.237768[/C][C]2.4364[/C][C]0.008258[/C][/ROW]
[ROW][C]8[/C][C]0.01296[/C][C]0.1328[/C][C]0.447302[/C][/ROW]
[ROW][C]9[/C][C]-0.07802[/C][C]-0.7995[/C][C]0.212911[/C][/ROW]
[ROW][C]10[/C][C]-0.228001[/C][C]-2.3363[/C][C]0.010687[/C][/ROW]
[ROW][C]11[/C][C]0.095929[/C][C]0.983[/C][C]0.16394[/C][/ROW]
[ROW][C]12[/C][C]0.628721[/C][C]6.4425[/C][C]0[/C][/ROW]
[ROW][C]13[/C][C]0.033844[/C][C]0.3468[/C][C]0.364719[/C][/ROW]
[ROW][C]14[/C][C]-0.230599[/C][C]-2.3629[/C][C]0.009986[/C][/ROW]
[ROW][C]15[/C][C]-0.126442[/C][C]-1.2956[/C][C]0.09897[/C][/ROW]
[ROW][C]16[/C][C]-0.1112[/C][C]-1.1395[/C][C]0.128551[/C][/ROW]
[ROW][C]17[/C][C]0.156671[/C][C]1.6054[/C][C]0.055704[/C][/ROW]
[ROW][C]18[/C][C]0.180858[/C][C]1.8532[/C][C]0.033328[/C][/ROW]
[ROW][C]19[/C][C]0.102371[/C][C]1.049[/C][C]0.148295[/C][/ROW]
[ROW][C]20[/C][C]-0.081495[/C][C]-0.8351[/C][C]0.202786[/C][/ROW]
[ROW][C]21[/C][C]-0.164842[/C][C]-1.6891[/C][C]0.047082[/C][/ROW]
[ROW][C]22[/C][C]-0.254102[/C][C]-2.6038[/C][C]0.005278[/C][/ROW]
[ROW][C]23[/C][C]0.036957[/C][C]0.3787[/C][C]0.352839[/C][/ROW]
[ROW][C]24[/C][C]0.457302[/C][C]4.686[/C][C]4e-06[/C][/ROW]
[ROW][C]25[/C][C]-0.015365[/C][C]-0.1574[/C][C]0.437599[/C][/ROW]
[ROW][C]26[/C][C]-0.254682[/C][C]-2.6097[/C][C]0.005192[/C][/ROW]
[ROW][C]27[/C][C]-0.164244[/C][C]-1.683[/C][C]0.047674[/C][/ROW]
[ROW][C]28[/C][C]-0.143122[/C][C]-1.4666[/C][C]0.072742[/C][/ROW]
[ROW][C]29[/C][C]0.063943[/C][C]0.6552[/C][C]0.256881[/C][/ROW]
[ROW][C]30[/C][C]0.106984[/C][C]1.0963[/C][C]0.137737[/C][/ROW]
[ROW][C]31[/C][C]0.056888[/C][C]0.5829[/C][C]0.280594[/C][/ROW]
[ROW][C]32[/C][C]-0.135073[/C][C]-1.3841[/C][C]0.084633[/C][/ROW]
[ROW][C]33[/C][C]-0.194786[/C][C]-1.996[/C][C]0.024264[/C][/ROW]
[ROW][C]34[/C][C]-0.230049[/C][C]-2.3573[/C][C]0.010131[/C][/ROW]
[ROW][C]35[/C][C]-0.053885[/C][C]-0.5522[/C][C]0.291007[/C][/ROW]
[ROW][C]36[/C][C]0.367517[/C][C]3.7659[/C][C]0.000137[/C][/ROW]
[/TABLE]
Source: https://freestatistics.org/blog/index.php?pk=66982&T=1

Globally Unique Identifier (entire table): ba.freestatistics.org/blog/index.php?pk=66982&T=1

As an alternative you can also use a QR Code:  

The GUIDs for individual cells are displayed in the table below:

Autocorrelation Function
Time lag kACF(k)T-STATP-value
10.2271262.32730.010933
2-0.074756-0.7660.222692
30.0893580.91560.180976
40.0367970.37710.353445
50.3247863.32810.000603
60.3922964.01985.5e-05
70.2377682.43640.008258
80.012960.13280.447302
9-0.07802-0.79950.212911
10-0.228001-2.33630.010687
110.0959290.9830.16394
120.6287216.44250
130.0338440.34680.364719
14-0.230599-2.36290.009986
15-0.126442-1.29560.09897
16-0.1112-1.13950.128551
170.1566711.60540.055704
180.1808581.85320.033328
190.1023711.0490.148295
20-0.081495-0.83510.202786
21-0.164842-1.68910.047082
22-0.254102-2.60380.005278
230.0369570.37870.352839
240.4573024.6864e-06
25-0.015365-0.15740.437599
26-0.254682-2.60970.005192
27-0.164244-1.6830.047674
28-0.143122-1.46660.072742
290.0639430.65520.256881
300.1069841.09630.137737
310.0568880.58290.280594
32-0.135073-1.38410.084633
33-0.194786-1.9960.024264
34-0.230049-2.35730.010131
35-0.053885-0.55220.291007
360.3675173.76590.000137


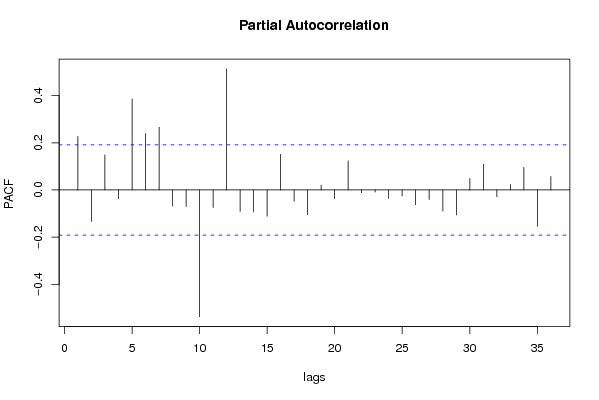
Partial Autocorrelation Function
Time lag kPACF(k)T-STATP-value
10.2271262.32730.010933
2-0.133214-1.3650.08758
30.1490521.52730.064843
4-0.038047-0.38990.348714
50.3857473.95277e-05
60.2395272.45440.007878
70.2663782.72960.003719
8-0.068435-0.70130.242348
9-0.070269-0.720.236548
10-0.537095-5.50360
11-0.074805-0.76650.222542
120.5130335.2570
13-0.09117-0.93420.176167
14-0.092911-0.95210.171628
15-0.11125-1.140.128446
160.150911.54640.062513
17-0.048179-0.49370.311277
18-0.105331-1.07930.141458
190.0201290.20630.418494
20-0.036568-0.37470.354318
210.1232021.26240.104793
22-0.011913-0.12210.451539
23-0.009017-0.09240.463281
24-0.035838-0.36720.357095
25-0.025609-0.26240.396758
26-0.062431-0.63970.261872
27-0.040558-0.41560.339279
28-0.089671-0.91890.180138
29-0.105804-1.08420.140387
300.0486930.4990.309427
310.1094591.12160.13229
32-0.029014-0.29730.383409
330.023460.24040.405249
340.0955030.97860.165011
35-0.154049-1.57850.058725
360.0574670.58890.278609

\begin{tabular}{lllllllll}
\hline
Partial Autocorrelation Function \tabularnewline
Time lag k & PACF(k) & T-STAT & P-value \tabularnewline
1 & 0.227126 & 2.3273 & 0.010933 \tabularnewline
2 & -0.133214 & -1.365 & 0.08758 \tabularnewline
3 & 0.149052 & 1.5273 & 0.064843 \tabularnewline
4 & -0.038047 & -0.3899 & 0.348714 \tabularnewline
5 & 0.385747 & 3.9527 & 7e-05 \tabularnewline
6 & 0.239527 & 2.4544 & 0.007878 \tabularnewline
7 & 0.266378 & 2.7296 & 0.003719 \tabularnewline
8 & -0.068435 & -0.7013 & 0.242348 \tabularnewline
9 & -0.070269 & -0.72 & 0.236548 \tabularnewline
10 & -0.537095 & -5.5036 & 0 \tabularnewline
11 & -0.074805 & -0.7665 & 0.222542 \tabularnewline
12 & 0.513033 & 5.257 & 0 \tabularnewline
13 & -0.09117 & -0.9342 & 0.176167 \tabularnewline
14 & -0.092911 & -0.9521 & 0.171628 \tabularnewline
15 & -0.11125 & -1.14 & 0.128446 \tabularnewline
16 & 0.15091 & 1.5464 & 0.062513 \tabularnewline
17 & -0.048179 & -0.4937 & 0.311277 \tabularnewline
18 & -0.105331 & -1.0793 & 0.141458 \tabularnewline
19 & 0.020129 & 0.2063 & 0.418494 \tabularnewline
20 & -0.036568 & -0.3747 & 0.354318 \tabularnewline
21 & 0.123202 & 1.2624 & 0.104793 \tabularnewline
22 & -0.011913 & -0.1221 & 0.451539 \tabularnewline
23 & -0.009017 & -0.0924 & 0.463281 \tabularnewline
24 & -0.035838 & -0.3672 & 0.357095 \tabularnewline
25 & -0.025609 & -0.2624 & 0.396758 \tabularnewline
26 & -0.062431 & -0.6397 & 0.261872 \tabularnewline
27 & -0.040558 & -0.4156 & 0.339279 \tabularnewline
28 & -0.089671 & -0.9189 & 0.180138 \tabularnewline
29 & -0.105804 & -1.0842 & 0.140387 \tabularnewline
30 & 0.048693 & 0.499 & 0.309427 \tabularnewline
31 & 0.109459 & 1.1216 & 0.13229 \tabularnewline
32 & -0.029014 & -0.2973 & 0.383409 \tabularnewline
33 & 0.02346 & 0.2404 & 0.405249 \tabularnewline
34 & 0.095503 & 0.9786 & 0.165011 \tabularnewline
35 & -0.154049 & -1.5785 & 0.058725 \tabularnewline
36 & 0.057467 & 0.5889 & 0.278609 \tabularnewline
\hline
\end{tabular}
%Source: https://freestatistics.org/blog/index.php?pk=66982&T=2

[TABLE]
[ROW][C]Partial Autocorrelation Function[/C][/ROW]
[ROW][C]Time lag k[/C][C]PACF(k)[/C][C]T-STAT[/C][C]P-value[/C][/ROW]
[ROW][C]1[/C][C]0.227126[/C][C]2.3273[/C][C]0.010933[/C][/ROW]
[ROW][C]2[/C][C]-0.133214[/C][C]-1.365[/C][C]0.08758[/C][/ROW]
[ROW][C]3[/C][C]0.149052[/C][C]1.5273[/C][C]0.064843[/C][/ROW]
[ROW][C]4[/C][C]-0.038047[/C][C]-0.3899[/C][C]0.348714[/C][/ROW]
[ROW][C]5[/C][C]0.385747[/C][C]3.9527[/C][C]7e-05[/C][/ROW]
[ROW][C]6[/C][C]0.239527[/C][C]2.4544[/C][C]0.007878[/C][/ROW]
[ROW][C]7[/C][C]0.266378[/C][C]2.7296[/C][C]0.003719[/C][/ROW]
[ROW][C]8[/C][C]-0.068435[/C][C]-0.7013[/C][C]0.242348[/C][/ROW]
[ROW][C]9[/C][C]-0.070269[/C][C]-0.72[/C][C]0.236548[/C][/ROW]
[ROW][C]10[/C][C]-0.537095[/C][C]-5.5036[/C][C]0[/C][/ROW]
[ROW][C]11[/C][C]-0.074805[/C][C]-0.7665[/C][C]0.222542[/C][/ROW]
[ROW][C]12[/C][C]0.513033[/C][C]5.257[/C][C]0[/C][/ROW]
[ROW][C]13[/C][C]-0.09117[/C][C]-0.9342[/C][C]0.176167[/C][/ROW]
[ROW][C]14[/C][C]-0.092911[/C][C]-0.9521[/C][C]0.171628[/C][/ROW]
[ROW][C]15[/C][C]-0.11125[/C][C]-1.14[/C][C]0.128446[/C][/ROW]
[ROW][C]16[/C][C]0.15091[/C][C]1.5464[/C][C]0.062513[/C][/ROW]
[ROW][C]17[/C][C]-0.048179[/C][C]-0.4937[/C][C]0.311277[/C][/ROW]
[ROW][C]18[/C][C]-0.105331[/C][C]-1.0793[/C][C]0.141458[/C][/ROW]
[ROW][C]19[/C][C]0.020129[/C][C]0.2063[/C][C]0.418494[/C][/ROW]
[ROW][C]20[/C][C]-0.036568[/C][C]-0.3747[/C][C]0.354318[/C][/ROW]
[ROW][C]21[/C][C]0.123202[/C][C]1.2624[/C][C]0.104793[/C][/ROW]
[ROW][C]22[/C][C]-0.011913[/C][C]-0.1221[/C][C]0.451539[/C][/ROW]
[ROW][C]23[/C][C]-0.009017[/C][C]-0.0924[/C][C]0.463281[/C][/ROW]
[ROW][C]24[/C][C]-0.035838[/C][C]-0.3672[/C][C]0.357095[/C][/ROW]
[ROW][C]25[/C][C]-0.025609[/C][C]-0.2624[/C][C]0.396758[/C][/ROW]
[ROW][C]26[/C][C]-0.062431[/C][C]-0.6397[/C][C]0.261872[/C][/ROW]
[ROW][C]27[/C][C]-0.040558[/C][C]-0.4156[/C][C]0.339279[/C][/ROW]
[ROW][C]28[/C][C]-0.089671[/C][C]-0.9189[/C][C]0.180138[/C][/ROW]
[ROW][C]29[/C][C]-0.105804[/C][C]-1.0842[/C][C]0.140387[/C][/ROW]
[ROW][C]30[/C][C]0.048693[/C][C]0.499[/C][C]0.309427[/C][/ROW]
[ROW][C]31[/C][C]0.109459[/C][C]1.1216[/C][C]0.13229[/C][/ROW]
[ROW][C]32[/C][C]-0.029014[/C][C]-0.2973[/C][C]0.383409[/C][/ROW]
[ROW][C]33[/C][C]0.02346[/C][C]0.2404[/C][C]0.405249[/C][/ROW]
[ROW][C]34[/C][C]0.095503[/C][C]0.9786[/C][C]0.165011[/C][/ROW]
[ROW][C]35[/C][C]-0.154049[/C][C]-1.5785[/C][C]0.058725[/C][/ROW]
[ROW][C]36[/C][C]0.057467[/C][C]0.5889[/C][C]0.278609[/C][/ROW]
[/TABLE]
Source: https://freestatistics.org/blog/index.php?pk=66982&T=2

Globally Unique Identifier (entire table): ba.freestatistics.org/blog/index.php?pk=66982&T=2

As an alternative you can also use a QR Code:  

The GUIDs for individual cells are displayed in the table below:

Partial Autocorrelation Function
Time lag kPACF(k)T-STATP-value
10.2271262.32730.010933
2-0.133214-1.3650.08758
30.1490521.52730.064843
4-0.038047-0.38990.348714
50.3857473.95277e-05
60.2395272.45440.007878
70.2663782.72960.003719
8-0.068435-0.70130.242348
9-0.070269-0.720.236548
10-0.537095-5.50360
11-0.074805-0.76650.222542
120.5130335.2570
13-0.09117-0.93420.176167
14-0.092911-0.95210.171628
15-0.11125-1.140.128446
160.150911.54640.062513
17-0.048179-0.49370.311277
18-0.105331-1.07930.141458
190.0201290.20630.418494
20-0.036568-0.37470.354318
210.1232021.26240.104793
22-0.011913-0.12210.451539
23-0.009017-0.09240.463281
24-0.035838-0.36720.357095
25-0.025609-0.26240.396758
26-0.062431-0.63970.261872
27-0.040558-0.41560.339279
28-0.089671-0.91890.180138
29-0.105804-1.08420.140387
300.0486930.4990.309427
310.1094591.12160.13229
32-0.029014-0.29730.383409
330.023460.24040.405249
340.0955030.97860.165011
35-0.154049-1.57850.058725
360.0574670.58890.278609


Parameters (Session):
par1 = 36 ; par2 = 1 ; par3 = 0 ; par4 = 0 ; par5 = 12 ; par6 = White Noise ; par7 = 0.95 ;
Parameters (R input):
par1 = 36 ; par2 = 1 ; par3 = 0 ; par4 = 0 ; par5 = 12 ; par6 = White Noise ; par7 = 0.95 ;
R code (references can be found in the software module):
if (par1 == 'Default') {
par1 = 10*log10(length(x))
} else {
par1 <- as.numeric(par1)
}
par2 <- as.numeric(par2)
par3 <- as.numeric(par3)
par4 <- as.numeric(par4)
par5 <- as.numeric(par5)
if (par6 == 'White Noise') par6 <- 'white' else par6 <- 'ma'
par7 <- as.numeric(par7)
if (par2 == 0) {
x <- log(x)
} else {
x <- (x ^ par2 - 1) / par2
}
if (par3 > 0) x <- diff(x,lag=1,difference=par3)
if (par4 > 0) x <- diff(x,lag=par5,difference=par4)
bitmap(file='pic1.png')
racf <- acf(x, par1, main='Autocorrelation', xlab='time lag', ylab='ACF', ci.type=par6, ci=par7, sub=paste('(lambda=',par2,', d=',par3,', D=',par4,', CI=', par7, ', CI type=',par6,')',sep=''))
dev.off()
bitmap(file='pic2.png')
rpacf <- pacf(x,par1,main='Partial Autocorrelation',xlab='lags',ylab='PACF')
dev.off()
(myacf <- c(racf$acf))
(mypacf <- c(rpacf$acf))
lengthx <- length(x)
sqrtn <- sqrt(lengthx)
load(file='createtable')
a<-table.start()
a<-table.row.start(a)
a<-table.element(a,'Autocorrelation Function',4,TRUE)
a<-table.row.end(a)
a<-table.row.start(a)
a<-table.element(a,'Time lag k',header=TRUE)
a<-table.element(a,hyperlink('basics.htm','ACF(k)','click here for more information about the Autocorrelation Function'),header=TRUE)
a<-table.element(a,'T-STAT',header=TRUE)
a<-table.element(a,'P-value',header=TRUE)
a<-table.row.end(a)
for (i in 2:(par1+1)) {
a<-table.row.start(a)
a<-table.element(a,i-1,header=TRUE)
a<-table.element(a,round(myacf[i],6))
mytstat <- myacf[i]*sqrtn
a<-table.element(a,round(mytstat,4))
a<-table.element(a,round(1-pt(abs(mytstat),lengthx),6))
a<-table.row.end(a)
}
a<-table.end(a)
table.save(a,file='mytable.tab')
a<-table.start()
a<-table.row.start(a)
a<-table.element(a,'Partial Autocorrelation Function',4,TRUE)
a<-table.row.end(a)
a<-table.row.start(a)
a<-table.element(a,'Time lag k',header=TRUE)
a<-table.element(a,hyperlink('basics.htm','PACF(k)','click here for more information about the Partial Autocorrelation Function'),header=TRUE)
a<-table.element(a,'T-STAT',header=TRUE)
a<-table.element(a,'P-value',header=TRUE)
a<-table.row.end(a)
for (i in 1:par1) {
a<-table.row.start(a)
a<-table.element(a,i,header=TRUE)
a<-table.element(a,round(mypacf[i],6))
mytstat <- mypacf[i]*sqrtn
a<-table.element(a,round(mytstat,4))
a<-table.element(a,round(1-pt(abs(mytstat),lengthx),6))
a<-table.row.end(a)
}
a<-table.end(a)
table.save(a,file='mytable1.tab')