Free Statistics

of Irreproducible Research!

Author's title

Author*The author of this computation has been verified*
R Software Modulerwasp_autocorrelation.wasp
Title produced by software(Partial) Autocorrelation Function
Date of computationSat, 12 Dec 2009 06:22:37 -0700
Cite this page as followsStatistical Computations at FreeStatistics.org, Office for Research Development and Education, URL https://freestatistics.org/blog/index.php?v=date/2009/Dec/12/t1260624495dnwsspstp5wwmzc.htm/, Retrieved Mon, 29 Apr 2024 08:38:56 +0000
Statistical Computations at FreeStatistics.org, Office for Research Development and Education, URL https://freestatistics.org/blog/index.php?pk=66940, Retrieved Mon, 29 Apr 2024 08:38:56 +0000
QR Codes:

Original text written by user:
IsPrivate?No (this computation is public)
User-defined keywords
Estimated Impact100
Family? (F = Feedback message, R = changed R code, M = changed R Module, P = changed Parameters, D = changed Data)
-     [Univariate Data Series] [data set] [2008-12-01 19:54:57] [b98453cac15ba1066b407e146608df68]
- RMP   [(Partial) Autocorrelation Function] [] [2009-11-27 14:46:03] [b98453cac15ba1066b407e146608df68]
- R PD    [(Partial) Autocorrelation Function] [Partial correlation] [2009-12-08 19:01:11] [03557919bc1ce1475f4920f6a43c36b0]
-   P         [(Partial) Autocorrelation Function] [] [2009-12-12 13:22:37] [d41d8cd98f00b204e9800998ecf8427e] [Current]
Feedback Forum

Post a new message
Dataseries X:
130.7
117.2
110.8
111.4
108.2
108.8
110.2
109.5
109.5
116
111.2
112.1
114
119.1
114.1
115.1
115.4
110.8
116
119.2
126.5
127.8
131.3
140.3
137.3
143
134.5
139.9
159.3
170.4
175
175.8
180.9
180.3
169.6
172.3
184.8
177.7
184.6
211.4
215.3
215.9
244.7
259.3
289
310.9
321
315.1
333.2
314.1
284.7
273.9
216
196.4
190.9
206.4
196.3
199.5
198.9
214.4


Summary of computational transaction
Raw Inputview raw input (R code)
Raw Outputview raw output of R engine
Computing time1 seconds
R Server'Gwilym Jenkins' @ 72.249.127.135

\begin{tabular}{lllllllll}
\hline
Summary of computational transaction \tabularnewline
Raw Input & view raw input (R code)  \tabularnewline
Raw Output & view raw output of R engine  \tabularnewline
Computing time & 1 seconds \tabularnewline
R Server & 'Gwilym Jenkins' @ 72.249.127.135 \tabularnewline
\hline
\end{tabular}
%Source: https://freestatistics.org/blog/index.php?pk=66940&T=0

[TABLE]
[ROW][C]Summary of computational transaction[/C][/ROW]
[ROW][C]Raw Input[/C][C]view raw input (R code) [/C][/ROW]
[ROW][C]Raw Output[/C][C]view raw output of R engine [/C][/ROW]
[ROW][C]Computing time[/C][C]1 seconds[/C][/ROW]
[ROW][C]R Server[/C][C]'Gwilym Jenkins' @ 72.249.127.135[/C][/ROW]
[/TABLE]
Source: https://freestatistics.org/blog/index.php?pk=66940&T=0

Globally Unique Identifier (entire table): ba.freestatistics.org/blog/index.php?pk=66940&T=0

As an alternative you can also use a QR Code:  

The GUIDs for individual cells are displayed in the table below:

Summary of computational transaction
Raw Inputview raw input (R code)
Raw Outputview raw output of R engine
Computing time1 seconds
R Server'Gwilym Jenkins' @ 72.249.127.135


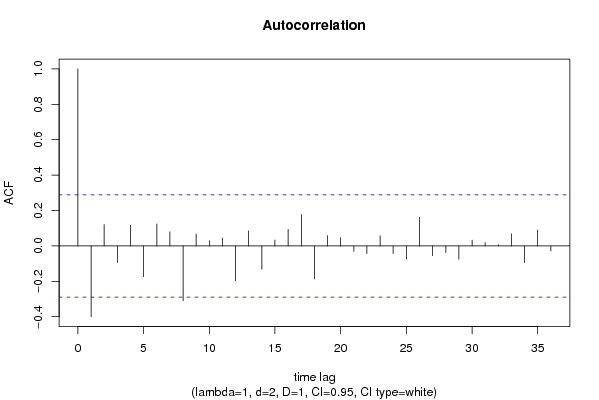
Autocorrelation Function
Time lag kACF(k)T-STATP-value
1-0.399843-2.71190.004689
20.1205170.81740.208961
3-0.09434-0.63980.262725
40.1164020.78950.216941
5-0.174372-1.18260.121513
60.1238050.83970.202714
70.0793610.53820.2965
8-0.310185-2.10380.020447
90.0670470.45470.325719
100.0287410.19490.423152
110.0442780.30030.382648
12-0.197039-1.33640.093999
130.0845510.57350.284566
14-0.131561-0.89230.18844
150.0330210.2240.411891
160.0928420.62970.266008
170.1773831.20310.117553
18-0.187051-1.26860.105476
190.0587910.39870.345965
200.0470060.31880.375656
21-0.030281-0.20540.419092
22-0.043296-0.29360.385175
230.0573440.38890.349563
24-0.042276-0.28670.387804
25-0.073423-0.4980.310437
260.1616141.09610.139365
27-0.055675-0.37760.353731
28-0.037824-0.25650.39934
29-0.075314-0.51080.305966
300.03260.22110.412996
310.0186670.12660.449903
320.0066580.04520.482088
330.0686690.46570.321801
34-0.094187-0.63880.263059
350.0895460.60730.27331
36-0.028304-0.1920.424306

\begin{tabular}{lllllllll}
\hline
Autocorrelation Function \tabularnewline
Time lag k & ACF(k) & T-STAT & P-value \tabularnewline
1 & -0.399843 & -2.7119 & 0.004689 \tabularnewline
2 & 0.120517 & 0.8174 & 0.208961 \tabularnewline
3 & -0.09434 & -0.6398 & 0.262725 \tabularnewline
4 & 0.116402 & 0.7895 & 0.216941 \tabularnewline
5 & -0.174372 & -1.1826 & 0.121513 \tabularnewline
6 & 0.123805 & 0.8397 & 0.202714 \tabularnewline
7 & 0.079361 & 0.5382 & 0.2965 \tabularnewline
8 & -0.310185 & -2.1038 & 0.020447 \tabularnewline
9 & 0.067047 & 0.4547 & 0.325719 \tabularnewline
10 & 0.028741 & 0.1949 & 0.423152 \tabularnewline
11 & 0.044278 & 0.3003 & 0.382648 \tabularnewline
12 & -0.197039 & -1.3364 & 0.093999 \tabularnewline
13 & 0.084551 & 0.5735 & 0.284566 \tabularnewline
14 & -0.131561 & -0.8923 & 0.18844 \tabularnewline
15 & 0.033021 & 0.224 & 0.411891 \tabularnewline
16 & 0.092842 & 0.6297 & 0.266008 \tabularnewline
17 & 0.177383 & 1.2031 & 0.117553 \tabularnewline
18 & -0.187051 & -1.2686 & 0.105476 \tabularnewline
19 & 0.058791 & 0.3987 & 0.345965 \tabularnewline
20 & 0.047006 & 0.3188 & 0.375656 \tabularnewline
21 & -0.030281 & -0.2054 & 0.419092 \tabularnewline
22 & -0.043296 & -0.2936 & 0.385175 \tabularnewline
23 & 0.057344 & 0.3889 & 0.349563 \tabularnewline
24 & -0.042276 & -0.2867 & 0.387804 \tabularnewline
25 & -0.073423 & -0.498 & 0.310437 \tabularnewline
26 & 0.161614 & 1.0961 & 0.139365 \tabularnewline
27 & -0.055675 & -0.3776 & 0.353731 \tabularnewline
28 & -0.037824 & -0.2565 & 0.39934 \tabularnewline
29 & -0.075314 & -0.5108 & 0.305966 \tabularnewline
30 & 0.0326 & 0.2211 & 0.412996 \tabularnewline
31 & 0.018667 & 0.1266 & 0.449903 \tabularnewline
32 & 0.006658 & 0.0452 & 0.482088 \tabularnewline
33 & 0.068669 & 0.4657 & 0.321801 \tabularnewline
34 & -0.094187 & -0.6388 & 0.263059 \tabularnewline
35 & 0.089546 & 0.6073 & 0.27331 \tabularnewline
36 & -0.028304 & -0.192 & 0.424306 \tabularnewline
\hline
\end{tabular}
%Source: https://freestatistics.org/blog/index.php?pk=66940&T=1

[TABLE]
[ROW][C]Autocorrelation Function[/C][/ROW]
[ROW][C]Time lag k[/C][C]ACF(k)[/C][C]T-STAT[/C][C]P-value[/C][/ROW]
[ROW][C]1[/C][C]-0.399843[/C][C]-2.7119[/C][C]0.004689[/C][/ROW]
[ROW][C]2[/C][C]0.120517[/C][C]0.8174[/C][C]0.208961[/C][/ROW]
[ROW][C]3[/C][C]-0.09434[/C][C]-0.6398[/C][C]0.262725[/C][/ROW]
[ROW][C]4[/C][C]0.116402[/C][C]0.7895[/C][C]0.216941[/C][/ROW]
[ROW][C]5[/C][C]-0.174372[/C][C]-1.1826[/C][C]0.121513[/C][/ROW]
[ROW][C]6[/C][C]0.123805[/C][C]0.8397[/C][C]0.202714[/C][/ROW]
[ROW][C]7[/C][C]0.079361[/C][C]0.5382[/C][C]0.2965[/C][/ROW]
[ROW][C]8[/C][C]-0.310185[/C][C]-2.1038[/C][C]0.020447[/C][/ROW]
[ROW][C]9[/C][C]0.067047[/C][C]0.4547[/C][C]0.325719[/C][/ROW]
[ROW][C]10[/C][C]0.028741[/C][C]0.1949[/C][C]0.423152[/C][/ROW]
[ROW][C]11[/C][C]0.044278[/C][C]0.3003[/C][C]0.382648[/C][/ROW]
[ROW][C]12[/C][C]-0.197039[/C][C]-1.3364[/C][C]0.093999[/C][/ROW]
[ROW][C]13[/C][C]0.084551[/C][C]0.5735[/C][C]0.284566[/C][/ROW]
[ROW][C]14[/C][C]-0.131561[/C][C]-0.8923[/C][C]0.18844[/C][/ROW]
[ROW][C]15[/C][C]0.033021[/C][C]0.224[/C][C]0.411891[/C][/ROW]
[ROW][C]16[/C][C]0.092842[/C][C]0.6297[/C][C]0.266008[/C][/ROW]
[ROW][C]17[/C][C]0.177383[/C][C]1.2031[/C][C]0.117553[/C][/ROW]
[ROW][C]18[/C][C]-0.187051[/C][C]-1.2686[/C][C]0.105476[/C][/ROW]
[ROW][C]19[/C][C]0.058791[/C][C]0.3987[/C][C]0.345965[/C][/ROW]
[ROW][C]20[/C][C]0.047006[/C][C]0.3188[/C][C]0.375656[/C][/ROW]
[ROW][C]21[/C][C]-0.030281[/C][C]-0.2054[/C][C]0.419092[/C][/ROW]
[ROW][C]22[/C][C]-0.043296[/C][C]-0.2936[/C][C]0.385175[/C][/ROW]
[ROW][C]23[/C][C]0.057344[/C][C]0.3889[/C][C]0.349563[/C][/ROW]
[ROW][C]24[/C][C]-0.042276[/C][C]-0.2867[/C][C]0.387804[/C][/ROW]
[ROW][C]25[/C][C]-0.073423[/C][C]-0.498[/C][C]0.310437[/C][/ROW]
[ROW][C]26[/C][C]0.161614[/C][C]1.0961[/C][C]0.139365[/C][/ROW]
[ROW][C]27[/C][C]-0.055675[/C][C]-0.3776[/C][C]0.353731[/C][/ROW]
[ROW][C]28[/C][C]-0.037824[/C][C]-0.2565[/C][C]0.39934[/C][/ROW]
[ROW][C]29[/C][C]-0.075314[/C][C]-0.5108[/C][C]0.305966[/C][/ROW]
[ROW][C]30[/C][C]0.0326[/C][C]0.2211[/C][C]0.412996[/C][/ROW]
[ROW][C]31[/C][C]0.018667[/C][C]0.1266[/C][C]0.449903[/C][/ROW]
[ROW][C]32[/C][C]0.006658[/C][C]0.0452[/C][C]0.482088[/C][/ROW]
[ROW][C]33[/C][C]0.068669[/C][C]0.4657[/C][C]0.321801[/C][/ROW]
[ROW][C]34[/C][C]-0.094187[/C][C]-0.6388[/C][C]0.263059[/C][/ROW]
[ROW][C]35[/C][C]0.089546[/C][C]0.6073[/C][C]0.27331[/C][/ROW]
[ROW][C]36[/C][C]-0.028304[/C][C]-0.192[/C][C]0.424306[/C][/ROW]
[/TABLE]
Source: https://freestatistics.org/blog/index.php?pk=66940&T=1

Globally Unique Identifier (entire table): ba.freestatistics.org/blog/index.php?pk=66940&T=1

As an alternative you can also use a QR Code:  

The GUIDs for individual cells are displayed in the table below:

Autocorrelation Function
Time lag kACF(k)T-STATP-value
1-0.399843-2.71190.004689
20.1205170.81740.208961
3-0.09434-0.63980.262725
40.1164020.78950.216941
5-0.174372-1.18260.121513
60.1238050.83970.202714
70.0793610.53820.2965
8-0.310185-2.10380.020447
90.0670470.45470.325719
100.0287410.19490.423152
110.0442780.30030.382648
12-0.197039-1.33640.093999
130.0845510.57350.284566
14-0.131561-0.89230.18844
150.0330210.2240.411891
160.0928420.62970.266008
170.1773831.20310.117553
18-0.187051-1.26860.105476
190.0587910.39870.345965
200.0470060.31880.375656
21-0.030281-0.20540.419092
22-0.043296-0.29360.385175
230.0573440.38890.349563
24-0.042276-0.28670.387804
25-0.073423-0.4980.310437
260.1616141.09610.139365
27-0.055675-0.37760.353731
28-0.037824-0.25650.39934
29-0.075314-0.51080.305966
300.03260.22110.412996
310.0186670.12660.449903
320.0066580.04520.482088
330.0686690.46570.321801
34-0.094187-0.63880.263059
350.0895460.60730.27331
36-0.028304-0.1920.424306


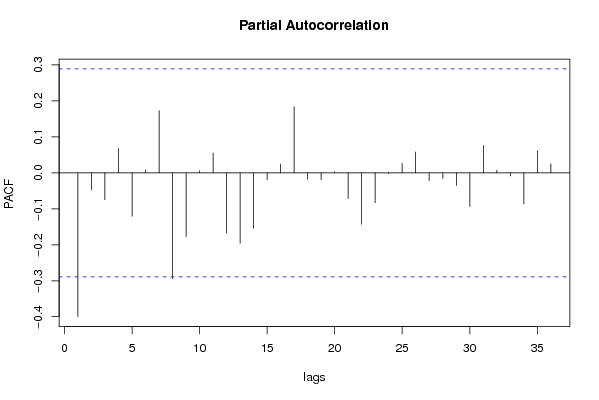
Partial Autocorrelation Function
Time lag kPACF(k)T-STATP-value
1-0.399843-2.71190.004689
2-0.046847-0.31770.376063
3-0.074707-0.50670.307397
40.0673310.45670.325032
5-0.120748-0.8190.208517
60.0074730.05070.479899
70.1728871.17260.123502
8-0.294737-1.9990.025768
9-0.177509-1.20390.117389
100.0056590.03840.484776
110.0550880.37360.3552
12-0.167268-1.13450.131239
13-0.195531-1.32620.095668
14-0.153899-1.04380.151017
15-0.019276-0.13070.448276
160.0245550.16650.434231
170.1841731.24910.10897
18-0.017774-0.12050.452286
19-0.018984-0.12880.449057
200.0028430.01930.492348
21-0.071495-0.48490.315024
22-0.142551-0.96680.169342
23-0.082843-0.56190.288466
24-0.001904-0.01290.494877
250.0265930.18040.428829
260.0581430.39430.347574
27-0.021931-0.14870.441204
28-0.015833-0.10740.457476
29-0.034953-0.23710.40683
30-0.093612-0.63490.264316
310.0763230.51770.303591
320.0072930.04950.480382
33-0.008656-0.05870.476719
34-0.086317-0.58540.28056
350.0617880.41910.338559
360.0252140.1710.432482

\begin{tabular}{lllllllll}
\hline
Partial Autocorrelation Function \tabularnewline
Time lag k & PACF(k) & T-STAT & P-value \tabularnewline
1 & -0.399843 & -2.7119 & 0.004689 \tabularnewline
2 & -0.046847 & -0.3177 & 0.376063 \tabularnewline
3 & -0.074707 & -0.5067 & 0.307397 \tabularnewline
4 & 0.067331 & 0.4567 & 0.325032 \tabularnewline
5 & -0.120748 & -0.819 & 0.208517 \tabularnewline
6 & 0.007473 & 0.0507 & 0.479899 \tabularnewline
7 & 0.172887 & 1.1726 & 0.123502 \tabularnewline
8 & -0.294737 & -1.999 & 0.025768 \tabularnewline
9 & -0.177509 & -1.2039 & 0.117389 \tabularnewline
10 & 0.005659 & 0.0384 & 0.484776 \tabularnewline
11 & 0.055088 & 0.3736 & 0.3552 \tabularnewline
12 & -0.167268 & -1.1345 & 0.131239 \tabularnewline
13 & -0.195531 & -1.3262 & 0.095668 \tabularnewline
14 & -0.153899 & -1.0438 & 0.151017 \tabularnewline
15 & -0.019276 & -0.1307 & 0.448276 \tabularnewline
16 & 0.024555 & 0.1665 & 0.434231 \tabularnewline
17 & 0.184173 & 1.2491 & 0.10897 \tabularnewline
18 & -0.017774 & -0.1205 & 0.452286 \tabularnewline
19 & -0.018984 & -0.1288 & 0.449057 \tabularnewline
20 & 0.002843 & 0.0193 & 0.492348 \tabularnewline
21 & -0.071495 & -0.4849 & 0.315024 \tabularnewline
22 & -0.142551 & -0.9668 & 0.169342 \tabularnewline
23 & -0.082843 & -0.5619 & 0.288466 \tabularnewline
24 & -0.001904 & -0.0129 & 0.494877 \tabularnewline
25 & 0.026593 & 0.1804 & 0.428829 \tabularnewline
26 & 0.058143 & 0.3943 & 0.347574 \tabularnewline
27 & -0.021931 & -0.1487 & 0.441204 \tabularnewline
28 & -0.015833 & -0.1074 & 0.457476 \tabularnewline
29 & -0.034953 & -0.2371 & 0.40683 \tabularnewline
30 & -0.093612 & -0.6349 & 0.264316 \tabularnewline
31 & 0.076323 & 0.5177 & 0.303591 \tabularnewline
32 & 0.007293 & 0.0495 & 0.480382 \tabularnewline
33 & -0.008656 & -0.0587 & 0.476719 \tabularnewline
34 & -0.086317 & -0.5854 & 0.28056 \tabularnewline
35 & 0.061788 & 0.4191 & 0.338559 \tabularnewline
36 & 0.025214 & 0.171 & 0.432482 \tabularnewline
\hline
\end{tabular}
%Source: https://freestatistics.org/blog/index.php?pk=66940&T=2

[TABLE]
[ROW][C]Partial Autocorrelation Function[/C][/ROW]
[ROW][C]Time lag k[/C][C]PACF(k)[/C][C]T-STAT[/C][C]P-value[/C][/ROW]
[ROW][C]1[/C][C]-0.399843[/C][C]-2.7119[/C][C]0.004689[/C][/ROW]
[ROW][C]2[/C][C]-0.046847[/C][C]-0.3177[/C][C]0.376063[/C][/ROW]
[ROW][C]3[/C][C]-0.074707[/C][C]-0.5067[/C][C]0.307397[/C][/ROW]
[ROW][C]4[/C][C]0.067331[/C][C]0.4567[/C][C]0.325032[/C][/ROW]
[ROW][C]5[/C][C]-0.120748[/C][C]-0.819[/C][C]0.208517[/C][/ROW]
[ROW][C]6[/C][C]0.007473[/C][C]0.0507[/C][C]0.479899[/C][/ROW]
[ROW][C]7[/C][C]0.172887[/C][C]1.1726[/C][C]0.123502[/C][/ROW]
[ROW][C]8[/C][C]-0.294737[/C][C]-1.999[/C][C]0.025768[/C][/ROW]
[ROW][C]9[/C][C]-0.177509[/C][C]-1.2039[/C][C]0.117389[/C][/ROW]
[ROW][C]10[/C][C]0.005659[/C][C]0.0384[/C][C]0.484776[/C][/ROW]
[ROW][C]11[/C][C]0.055088[/C][C]0.3736[/C][C]0.3552[/C][/ROW]
[ROW][C]12[/C][C]-0.167268[/C][C]-1.1345[/C][C]0.131239[/C][/ROW]
[ROW][C]13[/C][C]-0.195531[/C][C]-1.3262[/C][C]0.095668[/C][/ROW]
[ROW][C]14[/C][C]-0.153899[/C][C]-1.0438[/C][C]0.151017[/C][/ROW]
[ROW][C]15[/C][C]-0.019276[/C][C]-0.1307[/C][C]0.448276[/C][/ROW]
[ROW][C]16[/C][C]0.024555[/C][C]0.1665[/C][C]0.434231[/C][/ROW]
[ROW][C]17[/C][C]0.184173[/C][C]1.2491[/C][C]0.10897[/C][/ROW]
[ROW][C]18[/C][C]-0.017774[/C][C]-0.1205[/C][C]0.452286[/C][/ROW]
[ROW][C]19[/C][C]-0.018984[/C][C]-0.1288[/C][C]0.449057[/C][/ROW]
[ROW][C]20[/C][C]0.002843[/C][C]0.0193[/C][C]0.492348[/C][/ROW]
[ROW][C]21[/C][C]-0.071495[/C][C]-0.4849[/C][C]0.315024[/C][/ROW]
[ROW][C]22[/C][C]-0.142551[/C][C]-0.9668[/C][C]0.169342[/C][/ROW]
[ROW][C]23[/C][C]-0.082843[/C][C]-0.5619[/C][C]0.288466[/C][/ROW]
[ROW][C]24[/C][C]-0.001904[/C][C]-0.0129[/C][C]0.494877[/C][/ROW]
[ROW][C]25[/C][C]0.026593[/C][C]0.1804[/C][C]0.428829[/C][/ROW]
[ROW][C]26[/C][C]0.058143[/C][C]0.3943[/C][C]0.347574[/C][/ROW]
[ROW][C]27[/C][C]-0.021931[/C][C]-0.1487[/C][C]0.441204[/C][/ROW]
[ROW][C]28[/C][C]-0.015833[/C][C]-0.1074[/C][C]0.457476[/C][/ROW]
[ROW][C]29[/C][C]-0.034953[/C][C]-0.2371[/C][C]0.40683[/C][/ROW]
[ROW][C]30[/C][C]-0.093612[/C][C]-0.6349[/C][C]0.264316[/C][/ROW]
[ROW][C]31[/C][C]0.076323[/C][C]0.5177[/C][C]0.303591[/C][/ROW]
[ROW][C]32[/C][C]0.007293[/C][C]0.0495[/C][C]0.480382[/C][/ROW]
[ROW][C]33[/C][C]-0.008656[/C][C]-0.0587[/C][C]0.476719[/C][/ROW]
[ROW][C]34[/C][C]-0.086317[/C][C]-0.5854[/C][C]0.28056[/C][/ROW]
[ROW][C]35[/C][C]0.061788[/C][C]0.4191[/C][C]0.338559[/C][/ROW]
[ROW][C]36[/C][C]0.025214[/C][C]0.171[/C][C]0.432482[/C][/ROW]
[/TABLE]
Source: https://freestatistics.org/blog/index.php?pk=66940&T=2

Globally Unique Identifier (entire table): ba.freestatistics.org/blog/index.php?pk=66940&T=2

As an alternative you can also use a QR Code:  

The GUIDs for individual cells are displayed in the table below:

Partial Autocorrelation Function
Time lag kPACF(k)T-STATP-value
1-0.399843-2.71190.004689
2-0.046847-0.31770.376063
3-0.074707-0.50670.307397
40.0673310.45670.325032
5-0.120748-0.8190.208517
60.0074730.05070.479899
70.1728871.17260.123502
8-0.294737-1.9990.025768
9-0.177509-1.20390.117389
100.0056590.03840.484776
110.0550880.37360.3552
12-0.167268-1.13450.131239
13-0.195531-1.32620.095668
14-0.153899-1.04380.151017
15-0.019276-0.13070.448276
160.0245550.16650.434231
170.1841731.24910.10897
18-0.017774-0.12050.452286
19-0.018984-0.12880.449057
200.0028430.01930.492348
21-0.071495-0.48490.315024
22-0.142551-0.96680.169342
23-0.082843-0.56190.288466
24-0.001904-0.01290.494877
250.0265930.18040.428829
260.0581430.39430.347574
27-0.021931-0.14870.441204
28-0.015833-0.10740.457476
29-0.034953-0.23710.40683
30-0.093612-0.63490.264316
310.0763230.51770.303591
320.0072930.04950.480382
33-0.008656-0.05870.476719
34-0.086317-0.58540.28056
350.0617880.41910.338559
360.0252140.1710.432482


Parameters (Session):
par1 = 36 ; par2 = 1 ; par3 = 2 ; par4 = 1 ; par5 = 12 ; par6 = White Noise ; par7 = 0.95 ;
Parameters (R input):
par1 = 36 ; par2 = 1 ; par3 = 2 ; par4 = 1 ; par5 = 12 ; par6 = White Noise ; par7 = 0.95 ;
R code (references can be found in the software module):
if (par1 == 'Default') {
par1 = 10*log10(length(x))
} else {
par1 <- as.numeric(par1)
}
par2 <- as.numeric(par2)
par3 <- as.numeric(par3)
par4 <- as.numeric(par4)
par5 <- as.numeric(par5)
if (par6 == 'White Noise') par6 <- 'white' else par6 <- 'ma'
par7 <- as.numeric(par7)
if (par2 == 0) {
x <- log(x)
} else {
x <- (x ^ par2 - 1) / par2
}
if (par3 > 0) x <- diff(x,lag=1,difference=par3)
if (par4 > 0) x <- diff(x,lag=par5,difference=par4)
bitmap(file='pic1.png')
racf <- acf(x, par1, main='Autocorrelation', xlab='time lag', ylab='ACF', ci.type=par6, ci=par7, sub=paste('(lambda=',par2,', d=',par3,', D=',par4,', CI=', par7, ', CI type=',par6,')',sep=''))
dev.off()
bitmap(file='pic2.png')
rpacf <- pacf(x,par1,main='Partial Autocorrelation',xlab='lags',ylab='PACF')
dev.off()
(myacf <- c(racf$acf))
(mypacf <- c(rpacf$acf))
lengthx <- length(x)
sqrtn <- sqrt(lengthx)
load(file='createtable')
a<-table.start()
a<-table.row.start(a)
a<-table.element(a,'Autocorrelation Function',4,TRUE)
a<-table.row.end(a)
a<-table.row.start(a)
a<-table.element(a,'Time lag k',header=TRUE)
a<-table.element(a,hyperlink('basics.htm','ACF(k)','click here for more information about the Autocorrelation Function'),header=TRUE)
a<-table.element(a,'T-STAT',header=TRUE)
a<-table.element(a,'P-value',header=TRUE)
a<-table.row.end(a)
for (i in 2:(par1+1)) {
a<-table.row.start(a)
a<-table.element(a,i-1,header=TRUE)
a<-table.element(a,round(myacf[i],6))
mytstat <- myacf[i]*sqrtn
a<-table.element(a,round(mytstat,4))
a<-table.element(a,round(1-pt(abs(mytstat),lengthx),6))
a<-table.row.end(a)
}
a<-table.end(a)
table.save(a,file='mytable.tab')
a<-table.start()
a<-table.row.start(a)
a<-table.element(a,'Partial Autocorrelation Function',4,TRUE)
a<-table.row.end(a)
a<-table.row.start(a)
a<-table.element(a,'Time lag k',header=TRUE)
a<-table.element(a,hyperlink('basics.htm','PACF(k)','click here for more information about the Partial Autocorrelation Function'),header=TRUE)
a<-table.element(a,'T-STAT',header=TRUE)
a<-table.element(a,'P-value',header=TRUE)
a<-table.row.end(a)
for (i in 1:par1) {
a<-table.row.start(a)
a<-table.element(a,i,header=TRUE)
a<-table.element(a,round(mypacf[i],6))
mytstat <- mypacf[i]*sqrtn
a<-table.element(a,round(mytstat,4))
a<-table.element(a,round(1-pt(abs(mytstat),lengthx),6))
a<-table.row.end(a)
}
a<-table.end(a)
table.save(a,file='mytable1.tab')