| Multiple Linear Regression - Estimated Regression Equation |
| Invoer[t] = + 14662.8712459016 + 649.502540983608Dummy[t] + 2134.04735519127M1[t] + 1185.18154644809M2[t] + 1015.16744262295M3[t] + 2634.65333879781M4[t] + 325.499234972678M5[t] -322.674868852462M6[t] + 1807.75102732240M7[t] + 2087.65692349727M8[t] + 1533.04281967213M9[t] + 514.008715846994M10[t] + 470.594103825136M11[t] + 85.0741038251365t + e[t] |
| Multiple Linear Regression - Ordinary Least Squares | |||||
| Variable | Parameter | S.D. | T-STAT H0: parameter = 0 | 2-tail p-value | 1-tail p-value |
| (Intercept) | 14662.8712459016 | 874.69592 | 16.7634 | 0 | 0 |
| Dummy | 649.502540983608 | 749.613386 | 0.8665 | 0.390645 | 0.195323 |
| M1 | 2134.04735519127 | 994.864285 | 2.1451 | 0.037147 | 0.018573 |
| M2 | 1185.18154644809 | 1044.110171 | 1.1351 | 0.262084 | 0.131042 |
| M3 | 1015.16744262295 | 1043.034819 | 0.9733 | 0.335396 | 0.167698 |
| M4 | 2634.65333879781 | 1042.279454 | 2.5278 | 0.014899 | 0.00745 |
| M5 | 325.499234972678 | 1041.844774 | 0.3124 | 0.756099 | 0.378049 |
| M6 | -322.674868852462 | 1041.731179 | -0.3097 | 0.758121 | 0.379061 |
| M7 | 1807.75102732240 | 1041.938774 | 1.735 | 0.089297 | 0.044648 |
| M8 | 2087.65692349727 | 1042.467368 | 2.0026 | 0.051007 | 0.025503 |
| M9 | 1533.04281967213 | 1043.316473 | 1.4694 | 0.148388 | 0.074194 |
| M10 | 514.008715846994 | 1044.485306 | 0.4921 | 0.624928 | 0.312464 |
| M11 | 470.594103825136 | 1037.157503 | 0.4537 | 0.652108 | 0.326054 |
| t | 85.0741038251365 | 18.292678 | 4.6507 | 2.7e-05 | 1.4e-05 |
| Multiple Linear Regression - Regression Statistics | |
| Multiple R | 0.796759760684484 |
| R-squared | 0.634826116245995 |
| Adjusted R-squared | 0.533820573931058 |
| F-TEST (value) | 6.28506220249374 |
| F-TEST (DF numerator) | 13 |
| F-TEST (DF denominator) | 47 |
| p-value | 1.19807218634804e-06 |
| Multiple Linear Regression - Residual Statistics | |
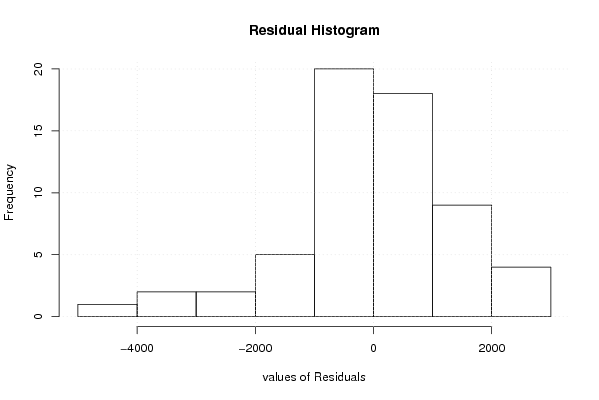
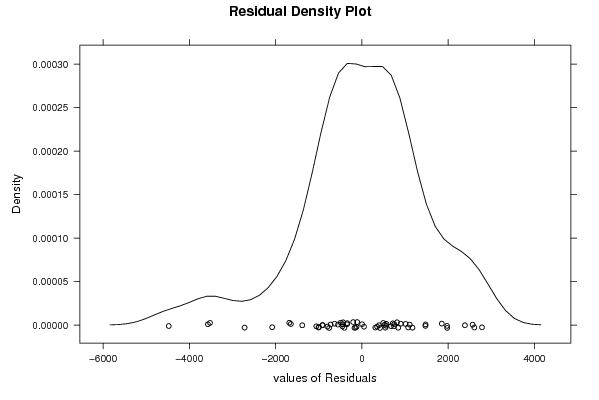
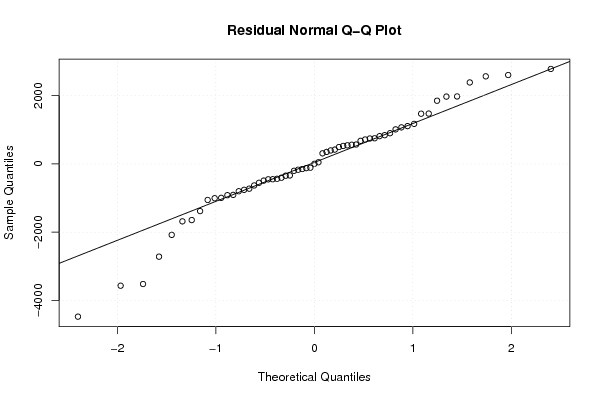
| Residual Standard Deviation | 1639.6349161624 |
| Sum Squared Residuals | 126354924.940048 |
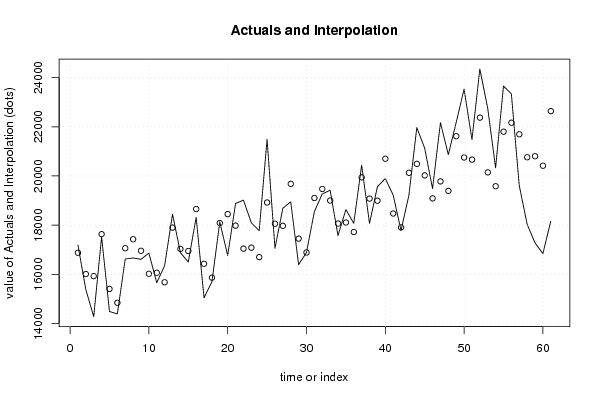
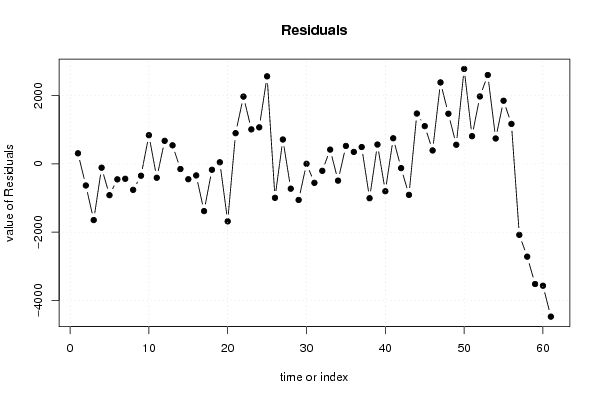
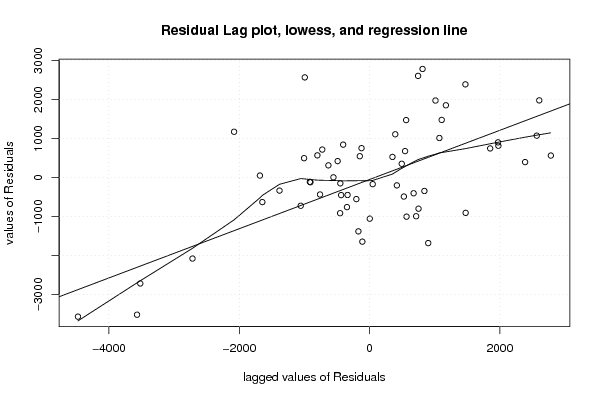
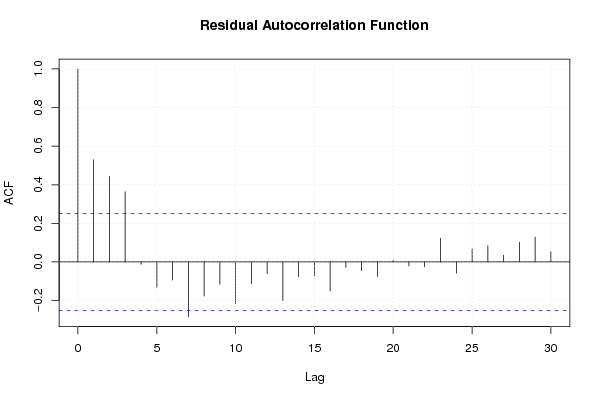
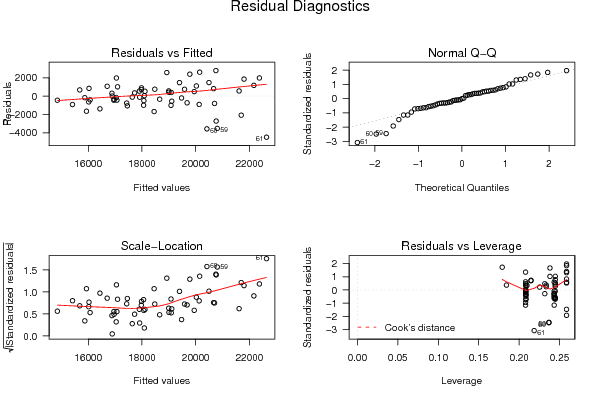
| Multiple Linear Regression - Actuals, Interpolation, and Residuals | |||
| Time or Index | Actuals | Interpolation Forecast | Residuals Prediction Error |
| 1 | 17192.4 | 16881.992704918 | 310.407295082008 |
| 2 | 15386.1 | 16018.201 | -632.101000000004 |
| 3 | 14287.1 | 15933.261 | -1646.16100000000 |
| 4 | 17526.6 | 17637.821 | -111.221000000008 |
| 5 | 14497 | 15413.741 | -916.740999999999 |
| 6 | 14398.3 | 14850.641 | -452.341000000005 |
| 7 | 16629.6 | 17066.141 | -436.541000000004 |
| 8 | 16670.7 | 17431.121 | -760.421000000002 |
| 9 | 16614.8 | 16961.581 | -346.781000000002 |
| 10 | 16869.2 | 16027.621 | 841.579 |
| 11 | 15663.9 | 16069.2804918033 | -405.380491803281 |
| 12 | 16359.9 | 15683.7604918033 | 676.139508196718 |
| 13 | 18447.7 | 17902.8819508197 | 544.818049180318 |
| 14 | 16889 | 17039.0902459016 | -150.090245901640 |
| 15 | 16505 | 16954.1502459016 | -449.15024590164 |
| 16 | 18320.9 | 18658.7102459016 | -337.810245901638 |
| 17 | 15052.1 | 16434.6302459016 | -1382.53024590164 |
| 18 | 15699.8 | 15871.5302459016 | -171.730245901640 |
| 19 | 18135.3 | 18087.0302459016 | 48.2697540983598 |
| 20 | 16768.7 | 18452.0102459016 | -1683.31024590164 |
| 21 | 18883 | 17982.4702459016 | 900.52975409836 |
| 22 | 19021 | 17048.5102459016 | 1972.48975409836 |
| 23 | 18101.9 | 17090.1697377049 | 1011.73026229508 |
| 24 | 17776.1 | 16704.6497377049 | 1071.45026229508 |
| 25 | 21489.9 | 18923.7711967213 | 2566.12880327868 |
| 26 | 17065.3 | 18059.9794918033 | -994.679491803278 |
| 27 | 18690 | 17975.0394918033 | 714.960508196722 |
| 28 | 18953.1 | 19679.5994918033 | -726.499491803279 |
| 29 | 16398.9 | 17455.5194918033 | -1056.61949180328 |
| 30 | 16895.6 | 16892.4194918033 | 3.18050819672222 |
| 31 | 18553 | 19107.9194918033 | -554.919491803277 |
| 32 | 19270 | 19472.8994918033 | -202.899491803279 |
| 33 | 19422.1 | 19003.3594918033 | 418.74050819672 |
| 34 | 17579.4 | 18069.3994918033 | -489.999491803277 |
| 35 | 18637.3 | 18111.0589836066 | 526.241016393441 |
| 36 | 18076.7 | 17725.5389836066 | 351.161016393443 |
| 37 | 20438.6 | 19944.6604426230 | 493.93955737704 |
| 38 | 18075.2 | 19080.8687377049 | -1005.66873770491 |
| 39 | 19563 | 18995.9287377049 | 567.071262295085 |
| 40 | 19899.2 | 20700.4887377049 | -801.288737704914 |
| 41 | 19227.5 | 18476.4087377049 | 751.091262295082 |
| 42 | 17789.6 | 17913.3087377049 | -123.708737704916 |
| 43 | 19220.8 | 20128.8087377049 | -908.008737704917 |
| 44 | 21968.9 | 20493.7887377049 | 1475.11126229509 |
| 45 | 21131.5 | 20024.2487377049 | 1107.25126229508 |
| 46 | 19484.6 | 19090.2887377049 | 394.311262295082 |
| 47 | 22168.7 | 19781.4507704918 | 2387.2492295082 |
| 48 | 20866.8 | 19395.9307704918 | 1470.86922950820 |
| 49 | 22176.2 | 21615.0522295082 | 561.147770491796 |
| 50 | 23533.8 | 20751.2605245902 | 2782.53947540984 |
| 51 | 21479.6 | 20666.3205245902 | 813.279475409836 |
| 52 | 24347.7 | 22370.8805245902 | 1976.81947540984 |
| 53 | 22751.6 | 20146.8005245902 | 2604.79947540983 |
| 54 | 20328.3 | 19583.7005245902 | 744.599475409839 |
| 55 | 23650.4 | 21799.2005245902 | 1851.19947540984 |
| 56 | 23335.7 | 22164.1805245902 | 1171.51947540984 |
| 57 | 19614.9 | 21694.6405245902 | -2079.74052459016 |
| 58 | 18042.3 | 20760.6805245902 | -2718.38052459016 |
| 59 | 17282.5 | 20802.3400163934 | -3519.84001639344 |
| 60 | 16847.2 | 20416.8200163934 | -3569.62001639344 |
| 61 | 18159.5 | 22635.9414754098 | -4476.44147540984 |
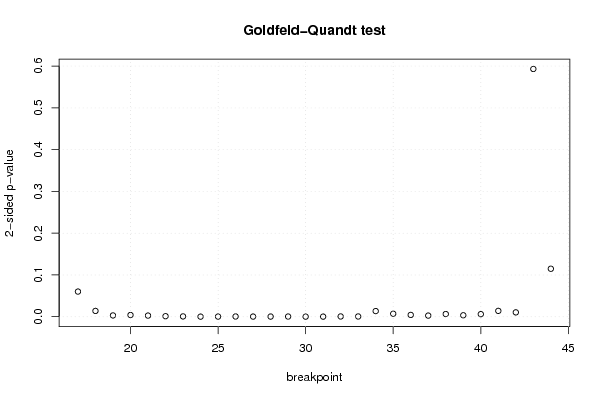
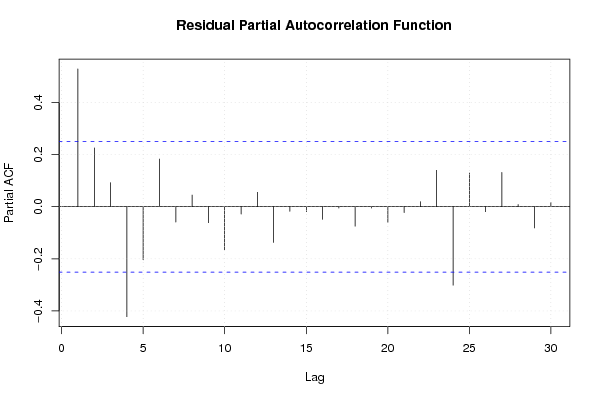
| Goldfeld-Quandt test for Heteroskedasticity | |||
| p-values | Alternative Hypothesis | ||
| breakpoint index | greater | 2-sided | less |
| 17 | 0.030107764554522 | 0.060215529109044 | 0.969892235445478 |
| 18 | 0.00696450882045687 | 0.0139290176409137 | 0.993035491179543 |
| 19 | 0.00154911865385187 | 0.00309823730770375 | 0.998450881346148 |
| 20 | 0.00204415422158258 | 0.00408830844316517 | 0.997955845778417 |
| 21 | 0.00138036628027631 | 0.00276073256055262 | 0.998619633719724 |
| 22 | 0.00064331889340712 | 0.00128663778681424 | 0.999356681106593 |
| 23 | 0.000374189022780842 | 0.000748378045561685 | 0.99962581097722 |
| 24 | 0.000100350508808642 | 0.000200701017617284 | 0.999899649491191 |
| 25 | 0.000181724036926885 | 0.000363448073853769 | 0.999818275963073 |
| 26 | 0.000305450394537932 | 0.000610900789075864 | 0.999694549605462 |
| 27 | 0.000186469338092348 | 0.000372938676184696 | 0.999813530661908 |
| 28 | 0.000199850984894159 | 0.000399701969788319 | 0.999800149015106 |
| 29 | 0.000219443581057527 | 0.000438887162115054 | 0.999780556418942 |
| 30 | 0.000107126155933114 | 0.000214252311866229 | 0.999892873844067 |
| 31 | 0.000129813101182350 | 0.000259626202364700 | 0.999870186898818 |
| 32 | 0.000330309978159995 | 0.00066061995631999 | 0.99966969002184 |
| 33 | 0.000301379362712603 | 0.000602758725425206 | 0.999698620637287 |
| 34 | 0.00676527101762989 | 0.0135305420352598 | 0.99323472898237 |
| 35 | 0.00358275254587115 | 0.0071655050917423 | 0.996417247454129 |
| 36 | 0.00218169684976053 | 0.00436339369952105 | 0.99781830315024 |
| 37 | 0.00136866723137229 | 0.00273733446274458 | 0.998631332768628 |
| 38 | 0.00324235199631999 | 0.00648470399263998 | 0.99675764800368 |
| 39 | 0.00174555097266997 | 0.00349110194533995 | 0.99825444902733 |
| 40 | 0.00308056917888291 | 0.00616113835776582 | 0.996919430821117 |
| 41 | 0.00701544133473669 | 0.0140308826694734 | 0.992984558665263 |
| 42 | 0.00523962243877023 | 0.0104792448775405 | 0.99476037756123 |
| 43 | 0.296607247610690 | 0.593214495221379 | 0.70339275238931 |
| 44 | 0.942559346608787 | 0.114881306782426 | 0.057440653391213 |
| Meta Analysis of Goldfeld-Quandt test for Heteroskedasticity | |||
| Description | # significant tests | % significant tests | OK/NOK |
| 1% type I error level | 21 | 0.75 | NOK |
| 5% type I error level | 25 | 0.892857142857143 | NOK |
| 10% type I error level | 26 | 0.928571428571429 | NOK |