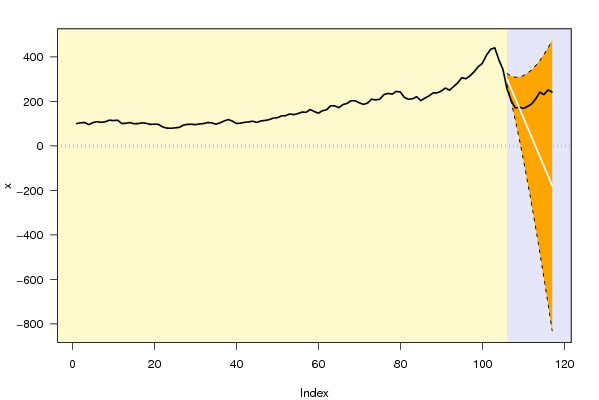
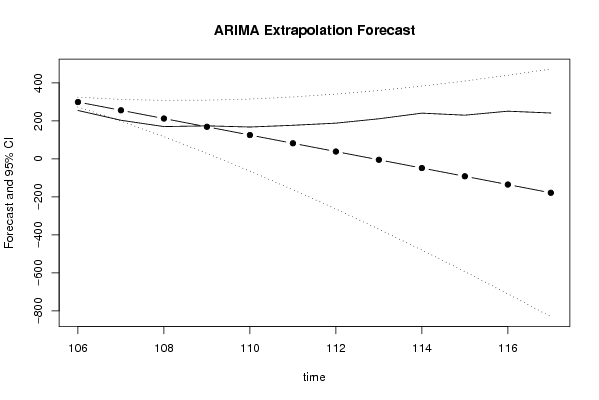
| Univariate ARIMA Extrapolation Forecast | ||||||||
| time | Y[t] | F[t] | 95% LB | 95% UB | p-value (H0: Y[t] = F[t]) | P(F[t]>Y[t-1]) | P(F[t]>Y[t-s]) | P(F[t]>Y[105]) |
| 93 | 266.48 | - | - | - | - | - | - | - |
| 94 | 282.98 | - | - | - | - | - | - | - |
| 95 | 306.31 | - | - | - | - | - | - | - |
| 96 | 301.73 | - | - | - | - | - | - | - |
| 97 | 314.62 | - | - | - | - | - | - | - |
| 98 | 332.62 | - | - | - | - | - | - | - |
| 99 | 355.51 | - | - | - | - | - | - | - |
| 100 | 370.32 | - | - | - | - | - | - | - |
| 101 | 408.13 | - | - | - | - | - | - | - |
| 102 | 433.58 | - | - | - | - | - | - | - |
| 103 | 440.51 | - | - | - | - | - | - | - |
| 104 | 386.29 | - | - | - | - | - | - | - |
| 105 | 342.84 | - | - | - | - | - | - | - |
| 106 | 254.97 | 299.39 | 273.8088 | 324.9712 | 3e-04 | 4e-04 | 0.8957 | 4e-04 |
| 107 | 203.42 | 255.94 | 198.7386 | 313.1414 | 0.036 | 0.5133 | 0.0422 | 0.0015 |
| 108 | 170.09 | 212.49 | 116.7738 | 308.2062 | 0.1926 | 0.5737 | 0.0338 | 0.0038 |
| 109 | 174.03 | 169.04 | 28.9258 | 309.1542 | 0.4722 | 0.4941 | 0.0209 | 0.0075 |
| 110 | 167.85 | 125.59 | -64.1256 | 315.3056 | 0.3312 | 0.3084 | 0.0162 | 0.0124 |
| 111 | 177.01 | 82.14 | -161.8895 | 326.1695 | 0.223 | 0.2456 | 0.0141 | 0.0181 |
| 112 | 188.19 | 38.69 | -263.9913 | 341.3713 | 0.1665 | 0.1852 | 0.0159 | 0.0244 |
| 113 | 211.2 | -4.76 | -370.1332 | 360.6132 | 0.1233 | 0.1503 | 0.0134 | 0.0311 |
| 114 | 240.91 | -48.21 | -480.0711 | 383.6511 | 0.0947 | 0.1195 | 0.0144 | 0.038 |
| 115 | 230.26 | -91.66 | -593.6002 | 410.2802 | 0.1044 | 0.097 | 0.0189 | 0.0449 |
| 116 | 251.25 | -135.11 | -710.5458 | 440.3258 | 0.0941 | 0.1067 | 0.0379 | 0.0518 |
| 117 | 241.66 | -178.56 | -830.7562 | 473.6362 | 0.1033 | 0.0982 | 0.0586 | 0.0586 |
| Univariate ARIMA Extrapolation Forecast Performance | ||||||
| time | % S.E. | PE | MAPE | Sq.E | MSE | RMSE |
| 106 | 0.0436 | -0.1484 | 0.0124 | 1973.1364 | 164.428 | 12.8229 |
| 107 | 0.114 | -0.2052 | 0.0171 | 2758.3504 | 229.8625 | 15.1612 |
| 108 | 0.2298 | -0.1995 | 0.0166 | 1797.76 | 149.8133 | 12.2398 |
| 109 | 0.4229 | 0.0295 | 0.0025 | 24.9001 | 2.075 | 1.4405 |
| 110 | 0.7707 | 0.3365 | 0.028 | 1785.9076 | 148.8256 | 12.1994 |
| 111 | 1.5158 | 1.155 | 0.0962 | 9000.3169 | 750.0264 | 27.3866 |
| 112 | 3.9915 | 3.864 | 0.322 | 22350.25 | 1862.5208 | 43.1569 |
| 113 | -39.1628 | -45.3697 | 3.7808 | 46638.7216 | 3886.5601 | 62.3423 |
| 114 | -4.5704 | -5.9971 | 0.4998 | 83590.3744 | 6965.8645 | 83.4618 |
| 115 | -2.7939 | -3.5121 | 0.2927 | 103632.4864 | 8636.0405 | 92.9303 |
| 116 | -2.173 | -2.8596 | 0.2383 | 149274.0496 | 12439.5041 | 111.5325 |
| 117 | -1.8635 | -2.3534 | 0.1961 | 176584.8484 | 14715.404 | 121.3071 |