Free Statistics

of Irreproducible Research!

Author's title

Author*The author of this computation has been verified*
R Software Modulerwasp_arimaforecasting.wasp
Title produced by softwareARIMA Forecasting
Date of computationFri, 11 Dec 2009 13:49:56 -0700
Cite this page as followsStatistical Computations at FreeStatistics.org, Office for Research Development and Education, URL https://freestatistics.org/blog/index.php?v=date/2009/Dec/11/t12605647684gnf02eho2yg2i7.htm/, Retrieved Mon, 29 Apr 2024 06:08:28 +0000
Statistical Computations at FreeStatistics.org, Office for Research Development and Education, URL https://freestatistics.org/blog/index.php?pk=66784, Retrieved Mon, 29 Apr 2024 06:08:28 +0000
QR Codes:

Original text written by user:
IsPrivate?No (this computation is public)
User-defined keywordsKVN WS10
Estimated Impact177
Family? (F = Feedback message, R = changed R code, M = changed R Module, P = changed Parameters, D = changed Data)
-     [ARIMA Forecasting] [] [2009-12-07 09:54:52] [b98453cac15ba1066b407e146608df68]
- R PD  [ARIMA Forecasting] [ws10] [2009-12-09 16:10:11] [757146c69eaf0537be37c7b0c18216d8]
-   P     [ARIMA Forecasting] [ws10] [2009-12-10 18:16:04] [03c44f58d7d4de05d4cfabfda8c46d2c]
-   PD        [ARIMA Forecasting] [Arima forecast Ge...] [2009-12-11 20:49:56] [f1100e00818182135823a11ccbd0f3b9] [Current]
Feedback Forum

Post a new message
Dataseries X:
9487
8700
9627
8947
9283
8829
9947
9628
9318
9605
8640
9214
9567
8547
9185
9470
9123
9278
10170
9434
9655
9429
8739
9552
9687
9019
9672
9206
9069
9788
10312
10105
9863
9656
9295
9946
9701
9049
10190
9706
9765
9893
9994
10433
10073
10112
9266
9820
10097
9115
10411
9678
10408
10153
10368
10581
10597
10680
9738
9556


Summary of computational transaction
Raw Inputview raw input (R code)
Raw Outputview raw output of R engine
Computing time3 seconds
R Server'Gwilym Jenkins' @ 72.249.127.135

\begin{tabular}{lllllllll}
\hline
Summary of computational transaction \tabularnewline
Raw Input & view raw input (R code)  \tabularnewline
Raw Output & view raw output of R engine  \tabularnewline
Computing time & 3 seconds \tabularnewline
R Server & 'Gwilym Jenkins' @ 72.249.127.135 \tabularnewline
\hline
\end{tabular}
%Source: https://freestatistics.org/blog/index.php?pk=66784&T=0

[TABLE]
[ROW][C]Summary of computational transaction[/C][/ROW]
[ROW][C]Raw Input[/C][C]view raw input (R code) [/C][/ROW]
[ROW][C]Raw Output[/C][C]view raw output of R engine [/C][/ROW]
[ROW][C]Computing time[/C][C]3 seconds[/C][/ROW]
[ROW][C]R Server[/C][C]'Gwilym Jenkins' @ 72.249.127.135[/C][/ROW]
[/TABLE]
Source: https://freestatistics.org/blog/index.php?pk=66784&T=0

Globally Unique Identifier (entire table): ba.freestatistics.org/blog/index.php?pk=66784&T=0

As an alternative you can also use a QR Code:  

The GUIDs for individual cells are displayed in the table below:

Summary of computational transaction
Raw Inputview raw input (R code)
Raw Outputview raw output of R engine
Computing time3 seconds
R Server'Gwilym Jenkins' @ 72.249.127.135


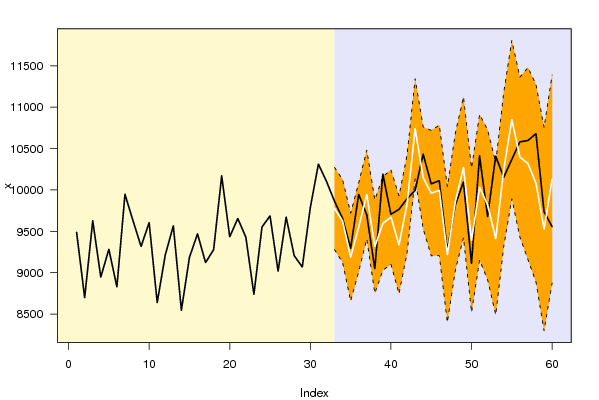
Univariate ARIMA Extrapolation Forecast
timeY[t]F[t]95% LB95% UBp-value(H0: Y[t] = F[t])P(F[t]>Y[t-1])P(F[t]>Y[t-s])P(F[t]>Y[32])
209434-------
219655-------
229429-------
238739-------
249552-------
259687-------
269019-------
279672-------
289206-------
299069-------
309788-------
3110312-------
3210105-------
3398639774.87339278.080410271.66630.3640.09640.68190.0964
3496569624.61339123.114510126.11210.45120.17580.77770.0302
3592959188.30448657.18739719.42160.34690.04220.95134e-04
3699469551.42969015.836210087.02290.07440.8260.49920.0214
3797019944.56219407.47710481.64710.1870.49790.82640.2791
3890499315.68118751.14429880.2180.17730.09050.84850.0031
39101909595.69219030.030710161.35350.01970.97090.39570.0388
4097069671.66319100.993110242.3330.45310.03750.94510.0683
4197659336.75228745.66029927.84420.07780.11040.81270.0054
4298939832.36099240.976210423.74560.42040.58830.55840.1831
43999410739.239410134.850811343.6280.00780.9970.91710.9801
441043310145.62149530.303510760.93940.180.68540.55150.5515
45100739961.10439202.747310719.46140.38620.11130.60010.355
46101129994.47699206.369810782.58410.3850.42260.80.3917
4792669219.15578399.936510038.37490.45540.01630.4280.017
4898209863.27849035.369910691.18690.45920.92130.42240.2836
491009710273.2599422.383311124.13470.34240.85180.90630.6508
5091159392.43348520.78410264.08280.26640.05660.780.0545
511041110033.07449152.952810913.19590.20.97950.36340.4364
5296789818.80388912.535810725.07180.38040.10010.59640.268
53104089411.4458491.224810331.66530.01690.28510.22570.0698
541015310251.42969320.544911182.31440.41790.37080.77480.6211
551036810849.74829893.303511806.1930.16180.92330.96030.9365
561058110396.34219430.145811362.53830.3540.52290.47040.7227
571059710318.68159158.618111478.74480.31910.32880.6610.641
581068010078.73648886.109911271.36290.16150.19720.47820.4828
5997389526.76898298.611210754.92660.3680.03290.66140.1781
60955610132.76228875.372211390.15230.18430.73080.68710.5173

\begin{tabular}{lllllllll}
\hline
Univariate ARIMA Extrapolation Forecast \tabularnewline
time & Y[t] & F[t] & 95% LB & 95% UB & p-value(H0: Y[t] = F[t]) & P(F[t]>Y[t-1]) & P(F[t]>Y[t-s]) & P(F[t]>Y[32]) \tabularnewline
20 & 9434 & - & - & - & - & - & - & - \tabularnewline
21 & 9655 & - & - & - & - & - & - & - \tabularnewline
22 & 9429 & - & - & - & - & - & - & - \tabularnewline
23 & 8739 & - & - & - & - & - & - & - \tabularnewline
24 & 9552 & - & - & - & - & - & - & - \tabularnewline
25 & 9687 & - & - & - & - & - & - & - \tabularnewline
26 & 9019 & - & - & - & - & - & - & - \tabularnewline
27 & 9672 & - & - & - & - & - & - & - \tabularnewline
28 & 9206 & - & - & - & - & - & - & - \tabularnewline
29 & 9069 & - & - & - & - & - & - & - \tabularnewline
30 & 9788 & - & - & - & - & - & - & - \tabularnewline
31 & 10312 & - & - & - & - & - & - & - \tabularnewline
32 & 10105 & - & - & - & - & - & - & - \tabularnewline
33 & 9863 & 9774.8733 & 9278.0804 & 10271.6663 & 0.364 & 0.0964 & 0.6819 & 0.0964 \tabularnewline
34 & 9656 & 9624.6133 & 9123.1145 & 10126.1121 & 0.4512 & 0.1758 & 0.7777 & 0.0302 \tabularnewline
35 & 9295 & 9188.3044 & 8657.1873 & 9719.4216 & 0.3469 & 0.0422 & 0.9513 & 4e-04 \tabularnewline
36 & 9946 & 9551.4296 & 9015.8362 & 10087.0229 & 0.0744 & 0.826 & 0.4992 & 0.0214 \tabularnewline
37 & 9701 & 9944.5621 & 9407.477 & 10481.6471 & 0.187 & 0.4979 & 0.8264 & 0.2791 \tabularnewline
38 & 9049 & 9315.6811 & 8751.1442 & 9880.218 & 0.1773 & 0.0905 & 0.8485 & 0.0031 \tabularnewline
39 & 10190 & 9595.6921 & 9030.0307 & 10161.3535 & 0.0197 & 0.9709 & 0.3957 & 0.0388 \tabularnewline
40 & 9706 & 9671.6631 & 9100.9931 & 10242.333 & 0.4531 & 0.0375 & 0.9451 & 0.0683 \tabularnewline
41 & 9765 & 9336.7522 & 8745.6602 & 9927.8442 & 0.0778 & 0.1104 & 0.8127 & 0.0054 \tabularnewline
42 & 9893 & 9832.3609 & 9240.9762 & 10423.7456 & 0.4204 & 0.5883 & 0.5584 & 0.1831 \tabularnewline
43 & 9994 & 10739.2394 & 10134.8508 & 11343.628 & 0.0078 & 0.997 & 0.9171 & 0.9801 \tabularnewline
44 & 10433 & 10145.6214 & 9530.3035 & 10760.9394 & 0.18 & 0.6854 & 0.5515 & 0.5515 \tabularnewline
45 & 10073 & 9961.1043 & 9202.7473 & 10719.4614 & 0.3862 & 0.1113 & 0.6001 & 0.355 \tabularnewline
46 & 10112 & 9994.4769 & 9206.3698 & 10782.5841 & 0.385 & 0.4226 & 0.8 & 0.3917 \tabularnewline
47 & 9266 & 9219.1557 & 8399.9365 & 10038.3749 & 0.4554 & 0.0163 & 0.428 & 0.017 \tabularnewline
48 & 9820 & 9863.2784 & 9035.3699 & 10691.1869 & 0.4592 & 0.9213 & 0.4224 & 0.2836 \tabularnewline
49 & 10097 & 10273.259 & 9422.3833 & 11124.1347 & 0.3424 & 0.8518 & 0.9063 & 0.6508 \tabularnewline
50 & 9115 & 9392.4334 & 8520.784 & 10264.0828 & 0.2664 & 0.0566 & 0.78 & 0.0545 \tabularnewline
51 & 10411 & 10033.0744 & 9152.9528 & 10913.1959 & 0.2 & 0.9795 & 0.3634 & 0.4364 \tabularnewline
52 & 9678 & 9818.8038 & 8912.5358 & 10725.0718 & 0.3804 & 0.1001 & 0.5964 & 0.268 \tabularnewline
53 & 10408 & 9411.445 & 8491.2248 & 10331.6653 & 0.0169 & 0.2851 & 0.2257 & 0.0698 \tabularnewline
54 & 10153 & 10251.4296 & 9320.5449 & 11182.3144 & 0.4179 & 0.3708 & 0.7748 & 0.6211 \tabularnewline
55 & 10368 & 10849.7482 & 9893.3035 & 11806.193 & 0.1618 & 0.9233 & 0.9603 & 0.9365 \tabularnewline
56 & 10581 & 10396.3421 & 9430.1458 & 11362.5383 & 0.354 & 0.5229 & 0.4704 & 0.7227 \tabularnewline
57 & 10597 & 10318.6815 & 9158.6181 & 11478.7448 & 0.3191 & 0.3288 & 0.661 & 0.641 \tabularnewline
58 & 10680 & 10078.7364 & 8886.1099 & 11271.3629 & 0.1615 & 0.1972 & 0.4782 & 0.4828 \tabularnewline
59 & 9738 & 9526.7689 & 8298.6112 & 10754.9266 & 0.368 & 0.0329 & 0.6614 & 0.1781 \tabularnewline
60 & 9556 & 10132.7622 & 8875.3722 & 11390.1523 & 0.1843 & 0.7308 & 0.6871 & 0.5173 \tabularnewline
\hline
\end{tabular}
%Source: https://freestatistics.org/blog/index.php?pk=66784&T=1

[TABLE]
[ROW][C]Univariate ARIMA Extrapolation Forecast[/C][/ROW]
[ROW][C]time[/C][C]Y[t][/C][C]F[t][/C][C]95% LB[/C][C]95% UB[/C][C]p-value(H0: Y[t] = F[t])[/C][C]P(F[t]>Y[t-1])[/C][C]P(F[t]>Y[t-s])[/C][C]P(F[t]>Y[32])[/C][/ROW]
[ROW][C]20[/C][C]9434[/C][C]-[/C][C]-[/C][C]-[/C][C]-[/C][C]-[/C][C]-[/C][C]-[/C][/ROW]
[ROW][C]21[/C][C]9655[/C][C]-[/C][C]-[/C][C]-[/C][C]-[/C][C]-[/C][C]-[/C][C]-[/C][/ROW]
[ROW][C]22[/C][C]9429[/C][C]-[/C][C]-[/C][C]-[/C][C]-[/C][C]-[/C][C]-[/C][C]-[/C][/ROW]
[ROW][C]23[/C][C]8739[/C][C]-[/C][C]-[/C][C]-[/C][C]-[/C][C]-[/C][C]-[/C][C]-[/C][/ROW]
[ROW][C]24[/C][C]9552[/C][C]-[/C][C]-[/C][C]-[/C][C]-[/C][C]-[/C][C]-[/C][C]-[/C][/ROW]
[ROW][C]25[/C][C]9687[/C][C]-[/C][C]-[/C][C]-[/C][C]-[/C][C]-[/C][C]-[/C][C]-[/C][/ROW]
[ROW][C]26[/C][C]9019[/C][C]-[/C][C]-[/C][C]-[/C][C]-[/C][C]-[/C][C]-[/C][C]-[/C][/ROW]
[ROW][C]27[/C][C]9672[/C][C]-[/C][C]-[/C][C]-[/C][C]-[/C][C]-[/C][C]-[/C][C]-[/C][/ROW]
[ROW][C]28[/C][C]9206[/C][C]-[/C][C]-[/C][C]-[/C][C]-[/C][C]-[/C][C]-[/C][C]-[/C][/ROW]
[ROW][C]29[/C][C]9069[/C][C]-[/C][C]-[/C][C]-[/C][C]-[/C][C]-[/C][C]-[/C][C]-[/C][/ROW]
[ROW][C]30[/C][C]9788[/C][C]-[/C][C]-[/C][C]-[/C][C]-[/C][C]-[/C][C]-[/C][C]-[/C][/ROW]
[ROW][C]31[/C][C]10312[/C][C]-[/C][C]-[/C][C]-[/C][C]-[/C][C]-[/C][C]-[/C][C]-[/C][/ROW]
[ROW][C]32[/C][C]10105[/C][C]-[/C][C]-[/C][C]-[/C][C]-[/C][C]-[/C][C]-[/C][C]-[/C][/ROW]
[ROW][C]33[/C][C]9863[/C][C]9774.8733[/C][C]9278.0804[/C][C]10271.6663[/C][C]0.364[/C][C]0.0964[/C][C]0.6819[/C][C]0.0964[/C][/ROW]
[ROW][C]34[/C][C]9656[/C][C]9624.6133[/C][C]9123.1145[/C][C]10126.1121[/C][C]0.4512[/C][C]0.1758[/C][C]0.7777[/C][C]0.0302[/C][/ROW]
[ROW][C]35[/C][C]9295[/C][C]9188.3044[/C][C]8657.1873[/C][C]9719.4216[/C][C]0.3469[/C][C]0.0422[/C][C]0.9513[/C][C]4e-04[/C][/ROW]
[ROW][C]36[/C][C]9946[/C][C]9551.4296[/C][C]9015.8362[/C][C]10087.0229[/C][C]0.0744[/C][C]0.826[/C][C]0.4992[/C][C]0.0214[/C][/ROW]
[ROW][C]37[/C][C]9701[/C][C]9944.5621[/C][C]9407.477[/C][C]10481.6471[/C][C]0.187[/C][C]0.4979[/C][C]0.8264[/C][C]0.2791[/C][/ROW]
[ROW][C]38[/C][C]9049[/C][C]9315.6811[/C][C]8751.1442[/C][C]9880.218[/C][C]0.1773[/C][C]0.0905[/C][C]0.8485[/C][C]0.0031[/C][/ROW]
[ROW][C]39[/C][C]10190[/C][C]9595.6921[/C][C]9030.0307[/C][C]10161.3535[/C][C]0.0197[/C][C]0.9709[/C][C]0.3957[/C][C]0.0388[/C][/ROW]
[ROW][C]40[/C][C]9706[/C][C]9671.6631[/C][C]9100.9931[/C][C]10242.333[/C][C]0.4531[/C][C]0.0375[/C][C]0.9451[/C][C]0.0683[/C][/ROW]
[ROW][C]41[/C][C]9765[/C][C]9336.7522[/C][C]8745.6602[/C][C]9927.8442[/C][C]0.0778[/C][C]0.1104[/C][C]0.8127[/C][C]0.0054[/C][/ROW]
[ROW][C]42[/C][C]9893[/C][C]9832.3609[/C][C]9240.9762[/C][C]10423.7456[/C][C]0.4204[/C][C]0.5883[/C][C]0.5584[/C][C]0.1831[/C][/ROW]
[ROW][C]43[/C][C]9994[/C][C]10739.2394[/C][C]10134.8508[/C][C]11343.628[/C][C]0.0078[/C][C]0.997[/C][C]0.9171[/C][C]0.9801[/C][/ROW]
[ROW][C]44[/C][C]10433[/C][C]10145.6214[/C][C]9530.3035[/C][C]10760.9394[/C][C]0.18[/C][C]0.6854[/C][C]0.5515[/C][C]0.5515[/C][/ROW]
[ROW][C]45[/C][C]10073[/C][C]9961.1043[/C][C]9202.7473[/C][C]10719.4614[/C][C]0.3862[/C][C]0.1113[/C][C]0.6001[/C][C]0.355[/C][/ROW]
[ROW][C]46[/C][C]10112[/C][C]9994.4769[/C][C]9206.3698[/C][C]10782.5841[/C][C]0.385[/C][C]0.4226[/C][C]0.8[/C][C]0.3917[/C][/ROW]
[ROW][C]47[/C][C]9266[/C][C]9219.1557[/C][C]8399.9365[/C][C]10038.3749[/C][C]0.4554[/C][C]0.0163[/C][C]0.428[/C][C]0.017[/C][/ROW]
[ROW][C]48[/C][C]9820[/C][C]9863.2784[/C][C]9035.3699[/C][C]10691.1869[/C][C]0.4592[/C][C]0.9213[/C][C]0.4224[/C][C]0.2836[/C][/ROW]
[ROW][C]49[/C][C]10097[/C][C]10273.259[/C][C]9422.3833[/C][C]11124.1347[/C][C]0.3424[/C][C]0.8518[/C][C]0.9063[/C][C]0.6508[/C][/ROW]
[ROW][C]50[/C][C]9115[/C][C]9392.4334[/C][C]8520.784[/C][C]10264.0828[/C][C]0.2664[/C][C]0.0566[/C][C]0.78[/C][C]0.0545[/C][/ROW]
[ROW][C]51[/C][C]10411[/C][C]10033.0744[/C][C]9152.9528[/C][C]10913.1959[/C][C]0.2[/C][C]0.9795[/C][C]0.3634[/C][C]0.4364[/C][/ROW]
[ROW][C]52[/C][C]9678[/C][C]9818.8038[/C][C]8912.5358[/C][C]10725.0718[/C][C]0.3804[/C][C]0.1001[/C][C]0.5964[/C][C]0.268[/C][/ROW]
[ROW][C]53[/C][C]10408[/C][C]9411.445[/C][C]8491.2248[/C][C]10331.6653[/C][C]0.0169[/C][C]0.2851[/C][C]0.2257[/C][C]0.0698[/C][/ROW]
[ROW][C]54[/C][C]10153[/C][C]10251.4296[/C][C]9320.5449[/C][C]11182.3144[/C][C]0.4179[/C][C]0.3708[/C][C]0.7748[/C][C]0.6211[/C][/ROW]
[ROW][C]55[/C][C]10368[/C][C]10849.7482[/C][C]9893.3035[/C][C]11806.193[/C][C]0.1618[/C][C]0.9233[/C][C]0.9603[/C][C]0.9365[/C][/ROW]
[ROW][C]56[/C][C]10581[/C][C]10396.3421[/C][C]9430.1458[/C][C]11362.5383[/C][C]0.354[/C][C]0.5229[/C][C]0.4704[/C][C]0.7227[/C][/ROW]
[ROW][C]57[/C][C]10597[/C][C]10318.6815[/C][C]9158.6181[/C][C]11478.7448[/C][C]0.3191[/C][C]0.3288[/C][C]0.661[/C][C]0.641[/C][/ROW]
[ROW][C]58[/C][C]10680[/C][C]10078.7364[/C][C]8886.1099[/C][C]11271.3629[/C][C]0.1615[/C][C]0.1972[/C][C]0.4782[/C][C]0.4828[/C][/ROW]
[ROW][C]59[/C][C]9738[/C][C]9526.7689[/C][C]8298.6112[/C][C]10754.9266[/C][C]0.368[/C][C]0.0329[/C][C]0.6614[/C][C]0.1781[/C][/ROW]
[ROW][C]60[/C][C]9556[/C][C]10132.7622[/C][C]8875.3722[/C][C]11390.1523[/C][C]0.1843[/C][C]0.7308[/C][C]0.6871[/C][C]0.5173[/C][/ROW]
[/TABLE]
Source: https://freestatistics.org/blog/index.php?pk=66784&T=1

Globally Unique Identifier (entire table): ba.freestatistics.org/blog/index.php?pk=66784&T=1

As an alternative you can also use a QR Code:  

The GUIDs for individual cells are displayed in the table below:

Univariate ARIMA Extrapolation Forecast
timeY[t]F[t]95% LB95% UBp-value(H0: Y[t] = F[t])P(F[t]>Y[t-1])P(F[t]>Y[t-s])P(F[t]>Y[32])
209434-------
219655-------
229429-------
238739-------
249552-------
259687-------
269019-------
279672-------
289206-------
299069-------
309788-------
3110312-------
3210105-------
3398639774.87339278.080410271.66630.3640.09640.68190.0964
3496569624.61339123.114510126.11210.45120.17580.77770.0302
3592959188.30448657.18739719.42160.34690.04220.95134e-04
3699469551.42969015.836210087.02290.07440.8260.49920.0214
3797019944.56219407.47710481.64710.1870.49790.82640.2791
3890499315.68118751.14429880.2180.17730.09050.84850.0031
39101909595.69219030.030710161.35350.01970.97090.39570.0388
4097069671.66319100.993110242.3330.45310.03750.94510.0683
4197659336.75228745.66029927.84420.07780.11040.81270.0054
4298939832.36099240.976210423.74560.42040.58830.55840.1831
43999410739.239410134.850811343.6280.00780.9970.91710.9801
441043310145.62149530.303510760.93940.180.68540.55150.5515
45100739961.10439202.747310719.46140.38620.11130.60010.355
46101129994.47699206.369810782.58410.3850.42260.80.3917
4792669219.15578399.936510038.37490.45540.01630.4280.017
4898209863.27849035.369910691.18690.45920.92130.42240.2836
491009710273.2599422.383311124.13470.34240.85180.90630.6508
5091159392.43348520.78410264.08280.26640.05660.780.0545
511041110033.07449152.952810913.19590.20.97950.36340.4364
5296789818.80388912.535810725.07180.38040.10010.59640.268
53104089411.4458491.224810331.66530.01690.28510.22570.0698
541015310251.42969320.544911182.31440.41790.37080.77480.6211
551036810849.74829893.303511806.1930.16180.92330.96030.9365
561058110396.34219430.145811362.53830.3540.52290.47040.7227
571059710318.68159158.618111478.74480.31910.32880.6610.641
581068010078.73648886.109911271.36290.16150.19720.47820.4828
5997389526.76898298.611210754.92660.3680.03290.66140.1781
60955610132.76228875.372211390.15230.18430.73080.68710.5173


Univariate ARIMA Extrapolation Forecast Performance
time% S.E.PEMAPESq.EMSERMSE
330.02590.00907766.310500
340.02660.00330.0061985.12474375.717666.1492
350.02950.01160.00811383.94976711.79581.9255
360.02860.04130.0163155685.817843955.3007209.6552
370.0276-0.02450.017959322.483747028.7373216.8611
380.0309-0.02860.019771118.806551043.7488225.9286
390.03010.06190.0258353201.884694209.1968306.9352
400.03010.00360.0231179.02582580.4253287.3681
410.03230.04590.0255183396.168493782.1745306.2388
420.03070.00620.02363677.105284771.6676291.1557
430.0287-0.06940.0277555381.7081127554.3986357.1476
440.03090.02830.027882586.4327123807.0681351.8623
450.03880.01120.026512520.643115246.5738339.4799
460.04020.01180.025513811.6729108001.2238328.6354
470.04530.00510.02412194.3888100947.4348317.7223
480.0428-0.00440.02291873.019494755.2838307.8235
490.0423-0.01720.022531067.239791008.9283301.6769
500.0473-0.02950.022976969.295690228.9487300.3813
510.04480.03770.0237142827.772592997.3078304.9546
520.0471-0.01430.023219825.71789338.7283298.8958
530.04990.10590.0272993121.7705132376.016363.8351
540.0463-0.00960.02649688.39126799.3057356.0889
550.045-0.04440.0272232081.3685131376.7867362.4594
560.04740.01780.026834098.5523127323.527356.8242
570.05740.0270.026877461.1936125329.0336354.0184
580.06040.05970.028361517.9183134413.2215366.6241
590.06580.02220.027844618.5779131087.494362.0601
600.0633-0.05690.0289332654.6791138286.322371.8687

\begin{tabular}{lllllllll}
\hline
Univariate ARIMA Extrapolation Forecast Performance \tabularnewline
time & % S.E. & PE & MAPE & Sq.E & MSE & RMSE \tabularnewline
33 & 0.0259 & 0.009 & 0 & 7766.3105 & 0 & 0 \tabularnewline
34 & 0.0266 & 0.0033 & 0.0061 & 985.1247 & 4375.7176 & 66.1492 \tabularnewline
35 & 0.0295 & 0.0116 & 0.008 & 11383.9497 & 6711.795 & 81.9255 \tabularnewline
36 & 0.0286 & 0.0413 & 0.0163 & 155685.8178 & 43955.3007 & 209.6552 \tabularnewline
37 & 0.0276 & -0.0245 & 0.0179 & 59322.4837 & 47028.7373 & 216.8611 \tabularnewline
38 & 0.0309 & -0.0286 & 0.0197 & 71118.8065 & 51043.7488 & 225.9286 \tabularnewline
39 & 0.0301 & 0.0619 & 0.0258 & 353201.8846 & 94209.1968 & 306.9352 \tabularnewline
40 & 0.0301 & 0.0036 & 0.023 & 1179.025 & 82580.4253 & 287.3681 \tabularnewline
41 & 0.0323 & 0.0459 & 0.0255 & 183396.1684 & 93782.1745 & 306.2388 \tabularnewline
42 & 0.0307 & 0.0062 & 0.0236 & 3677.1052 & 84771.6676 & 291.1557 \tabularnewline
43 & 0.0287 & -0.0694 & 0.0277 & 555381.7081 & 127554.3986 & 357.1476 \tabularnewline
44 & 0.0309 & 0.0283 & 0.0278 & 82586.4327 & 123807.0681 & 351.8623 \tabularnewline
45 & 0.0388 & 0.0112 & 0.0265 & 12520.643 & 115246.5738 & 339.4799 \tabularnewline
46 & 0.0402 & 0.0118 & 0.0255 & 13811.6729 & 108001.2238 & 328.6354 \tabularnewline
47 & 0.0453 & 0.0051 & 0.0241 & 2194.3888 & 100947.4348 & 317.7223 \tabularnewline
48 & 0.0428 & -0.0044 & 0.0229 & 1873.0194 & 94755.2838 & 307.8235 \tabularnewline
49 & 0.0423 & -0.0172 & 0.0225 & 31067.2397 & 91008.9283 & 301.6769 \tabularnewline
50 & 0.0473 & -0.0295 & 0.0229 & 76969.2956 & 90228.9487 & 300.3813 \tabularnewline
51 & 0.0448 & 0.0377 & 0.0237 & 142827.7725 & 92997.3078 & 304.9546 \tabularnewline
52 & 0.0471 & -0.0143 & 0.0232 & 19825.717 & 89338.7283 & 298.8958 \tabularnewline
53 & 0.0499 & 0.1059 & 0.0272 & 993121.7705 & 132376.016 & 363.8351 \tabularnewline
54 & 0.0463 & -0.0096 & 0.0264 & 9688.39 & 126799.3057 & 356.0889 \tabularnewline
55 & 0.045 & -0.0444 & 0.0272 & 232081.3685 & 131376.7867 & 362.4594 \tabularnewline
56 & 0.0474 & 0.0178 & 0.0268 & 34098.5523 & 127323.527 & 356.8242 \tabularnewline
57 & 0.0574 & 0.027 & 0.0268 & 77461.1936 & 125329.0336 & 354.0184 \tabularnewline
58 & 0.0604 & 0.0597 & 0.028 & 361517.9183 & 134413.2215 & 366.6241 \tabularnewline
59 & 0.0658 & 0.0222 & 0.0278 & 44618.5779 & 131087.494 & 362.0601 \tabularnewline
60 & 0.0633 & -0.0569 & 0.0289 & 332654.6791 & 138286.322 & 371.8687 \tabularnewline
\hline
\end{tabular}
%Source: https://freestatistics.org/blog/index.php?pk=66784&T=2

[TABLE]
[ROW][C]Univariate ARIMA Extrapolation Forecast Performance[/C][/ROW]
[ROW][C]time[/C][C]% S.E.[/C][C]PE[/C][C]MAPE[/C][C]Sq.E[/C][C]MSE[/C][C]RMSE[/C][/ROW]
[ROW][C]33[/C][C]0.0259[/C][C]0.009[/C][C]0[/C][C]7766.3105[/C][C]0[/C][C]0[/C][/ROW]
[ROW][C]34[/C][C]0.0266[/C][C]0.0033[/C][C]0.0061[/C][C]985.1247[/C][C]4375.7176[/C][C]66.1492[/C][/ROW]
[ROW][C]35[/C][C]0.0295[/C][C]0.0116[/C][C]0.008[/C][C]11383.9497[/C][C]6711.795[/C][C]81.9255[/C][/ROW]
[ROW][C]36[/C][C]0.0286[/C][C]0.0413[/C][C]0.0163[/C][C]155685.8178[/C][C]43955.3007[/C][C]209.6552[/C][/ROW]
[ROW][C]37[/C][C]0.0276[/C][C]-0.0245[/C][C]0.0179[/C][C]59322.4837[/C][C]47028.7373[/C][C]216.8611[/C][/ROW]
[ROW][C]38[/C][C]0.0309[/C][C]-0.0286[/C][C]0.0197[/C][C]71118.8065[/C][C]51043.7488[/C][C]225.9286[/C][/ROW]
[ROW][C]39[/C][C]0.0301[/C][C]0.0619[/C][C]0.0258[/C][C]353201.8846[/C][C]94209.1968[/C][C]306.9352[/C][/ROW]
[ROW][C]40[/C][C]0.0301[/C][C]0.0036[/C][C]0.023[/C][C]1179.025[/C][C]82580.4253[/C][C]287.3681[/C][/ROW]
[ROW][C]41[/C][C]0.0323[/C][C]0.0459[/C][C]0.0255[/C][C]183396.1684[/C][C]93782.1745[/C][C]306.2388[/C][/ROW]
[ROW][C]42[/C][C]0.0307[/C][C]0.0062[/C][C]0.0236[/C][C]3677.1052[/C][C]84771.6676[/C][C]291.1557[/C][/ROW]
[ROW][C]43[/C][C]0.0287[/C][C]-0.0694[/C][C]0.0277[/C][C]555381.7081[/C][C]127554.3986[/C][C]357.1476[/C][/ROW]
[ROW][C]44[/C][C]0.0309[/C][C]0.0283[/C][C]0.0278[/C][C]82586.4327[/C][C]123807.0681[/C][C]351.8623[/C][/ROW]
[ROW][C]45[/C][C]0.0388[/C][C]0.0112[/C][C]0.0265[/C][C]12520.643[/C][C]115246.5738[/C][C]339.4799[/C][/ROW]
[ROW][C]46[/C][C]0.0402[/C][C]0.0118[/C][C]0.0255[/C][C]13811.6729[/C][C]108001.2238[/C][C]328.6354[/C][/ROW]
[ROW][C]47[/C][C]0.0453[/C][C]0.0051[/C][C]0.0241[/C][C]2194.3888[/C][C]100947.4348[/C][C]317.7223[/C][/ROW]
[ROW][C]48[/C][C]0.0428[/C][C]-0.0044[/C][C]0.0229[/C][C]1873.0194[/C][C]94755.2838[/C][C]307.8235[/C][/ROW]
[ROW][C]49[/C][C]0.0423[/C][C]-0.0172[/C][C]0.0225[/C][C]31067.2397[/C][C]91008.9283[/C][C]301.6769[/C][/ROW]
[ROW][C]50[/C][C]0.0473[/C][C]-0.0295[/C][C]0.0229[/C][C]76969.2956[/C][C]90228.9487[/C][C]300.3813[/C][/ROW]
[ROW][C]51[/C][C]0.0448[/C][C]0.0377[/C][C]0.0237[/C][C]142827.7725[/C][C]92997.3078[/C][C]304.9546[/C][/ROW]
[ROW][C]52[/C][C]0.0471[/C][C]-0.0143[/C][C]0.0232[/C][C]19825.717[/C][C]89338.7283[/C][C]298.8958[/C][/ROW]
[ROW][C]53[/C][C]0.0499[/C][C]0.1059[/C][C]0.0272[/C][C]993121.7705[/C][C]132376.016[/C][C]363.8351[/C][/ROW]
[ROW][C]54[/C][C]0.0463[/C][C]-0.0096[/C][C]0.0264[/C][C]9688.39[/C][C]126799.3057[/C][C]356.0889[/C][/ROW]
[ROW][C]55[/C][C]0.045[/C][C]-0.0444[/C][C]0.0272[/C][C]232081.3685[/C][C]131376.7867[/C][C]362.4594[/C][/ROW]
[ROW][C]56[/C][C]0.0474[/C][C]0.0178[/C][C]0.0268[/C][C]34098.5523[/C][C]127323.527[/C][C]356.8242[/C][/ROW]
[ROW][C]57[/C][C]0.0574[/C][C]0.027[/C][C]0.0268[/C][C]77461.1936[/C][C]125329.0336[/C][C]354.0184[/C][/ROW]
[ROW][C]58[/C][C]0.0604[/C][C]0.0597[/C][C]0.028[/C][C]361517.9183[/C][C]134413.2215[/C][C]366.6241[/C][/ROW]
[ROW][C]59[/C][C]0.0658[/C][C]0.0222[/C][C]0.0278[/C][C]44618.5779[/C][C]131087.494[/C][C]362.0601[/C][/ROW]
[ROW][C]60[/C][C]0.0633[/C][C]-0.0569[/C][C]0.0289[/C][C]332654.6791[/C][C]138286.322[/C][C]371.8687[/C][/ROW]
[/TABLE]
Source: https://freestatistics.org/blog/index.php?pk=66784&T=2

Globally Unique Identifier (entire table): ba.freestatistics.org/blog/index.php?pk=66784&T=2

As an alternative you can also use a QR Code:  

The GUIDs for individual cells are displayed in the table below:

Univariate ARIMA Extrapolation Forecast Performance
time% S.E.PEMAPESq.EMSERMSE
330.02590.00907766.310500
340.02660.00330.0061985.12474375.717666.1492
350.02950.01160.00811383.94976711.79581.9255
360.02860.04130.0163155685.817843955.3007209.6552
370.0276-0.02450.017959322.483747028.7373216.8611
380.0309-0.02860.019771118.806551043.7488225.9286
390.03010.06190.0258353201.884694209.1968306.9352
400.03010.00360.0231179.02582580.4253287.3681
410.03230.04590.0255183396.168493782.1745306.2388
420.03070.00620.02363677.105284771.6676291.1557
430.0287-0.06940.0277555381.7081127554.3986357.1476
440.03090.02830.027882586.4327123807.0681351.8623
450.03880.01120.026512520.643115246.5738339.4799
460.04020.01180.025513811.6729108001.2238328.6354
470.04530.00510.02412194.3888100947.4348317.7223
480.0428-0.00440.02291873.019494755.2838307.8235
490.0423-0.01720.022531067.239791008.9283301.6769
500.0473-0.02950.022976969.295690228.9487300.3813
510.04480.03770.0237142827.772592997.3078304.9546
520.0471-0.01430.023219825.71789338.7283298.8958
530.04990.10590.0272993121.7705132376.016363.8351
540.0463-0.00960.02649688.39126799.3057356.0889
550.045-0.04440.0272232081.3685131376.7867362.4594
560.04740.01780.026834098.5523127323.527356.8242
570.05740.0270.026877461.1936125329.0336354.0184
580.06040.05970.028361517.9183134413.2215366.6241
590.06580.02220.027844618.5779131087.494362.0601
600.0633-0.05690.0289332654.6791138286.322371.8687


Parameters (Session):
par1 = 12 ; par2 = 1 ; par3 = 1 ; par4 = 1 ; par5 = 12 ; par6 = 0 ; par7 = 1 ; par8 = 1 ; par9 = 1 ; par10 = FALSE ;
Parameters (R input):
par1 = 12 ; par2 = 1 ; par3 = 1 ; par4 = 1 ; par5 = 12 ; par6 = 0 ; par7 = 1 ; par8 = 1 ; par9 = 1 ; par10 = FALSE ;
R code (references can be found in the software module):
par1 <- as.numeric(par1) #cut off periods
par1 <- 28
par2 <- as.numeric(par2) #lambda
par3 <- as.numeric(par3) #degree of non-seasonal differencing
par4 <- as.numeric(par4) #degree of seasonal differencing
par5 <- as.numeric(par5) #seasonal period
par6 <- as.numeric(par6) #p
par6 <- 3
par7 <- as.numeric(par7) #q
par7 <- 3
par8 <- as.numeric(par8) #P
par9 <- as.numeric(par9) #Q
if (par10 == 'TRUE') par10 <- TRUE
if (par10 == 'FALSE') par10 <- FALSE
if (par2 == 0) x <- log(x)
if (par2 != 0) x <- x^par2
lx <- length(x)
first <- lx - 2*par1
nx <- lx - par1
nx1 <- nx + 1
fx <- lx - nx
if (fx < 1) {
fx <- par5
nx1 <- lx + fx - 1
first <- lx - 2*fx
}
first <- 1
if (fx < 3) fx <- round(lx/10,0)
(arima.out <- arima(x[1:nx], order=c(par6,par3,par7), seasonal=list(order=c(par8,par4,par9), period=par5), include.mean=par10, method='ML'))
(forecast <- predict(arima.out,par1))
(lb <- forecast$pred - 1.96 * forecast$se)
(ub <- forecast$pred + 1.96 * forecast$se)
if (par2 == 0) {
x <- exp(x)
forecast$pred <- exp(forecast$pred)
lb <- exp(lb)
ub <- exp(ub)
}
if (par2 != 0) {
x <- x^(1/par2)
forecast$pred <- forecast$pred^(1/par2)
lb <- lb^(1/par2)
ub <- ub^(1/par2)
}
if (par2 < 0) {
olb <- lb
lb <- ub
ub <- olb
}
(actandfor <- c(x[1:nx], forecast$pred))
(perc.se <- (ub-forecast$pred)/1.96/forecast$pred)
bitmap(file='test1.png')
opar <- par(mar=c(4,4,2,2),las=1)
ylim <- c( min(x[first:nx],lb), max(x[first:nx],ub))
plot(x,ylim=ylim,type='n',xlim=c(first,lx))
usr <- par('usr')
rect(usr[1],usr[3],nx+1,usr[4],border=NA,col='lemonchiffon')
rect(nx1,usr[3],usr[2],usr[4],border=NA,col='lavender')
abline(h= (-3:3)*2 , col ='gray', lty =3)
polygon( c(nx1:lx,lx:nx1), c(lb,rev(ub)), col = 'orange', lty=2,border=NA)
lines(nx1:lx, lb , lty=2)
lines(nx1:lx, ub , lty=2)
lines(x, lwd=2)
lines(nx1:lx, forecast$pred , lwd=2 , col ='white')
box()
par(opar)
dev.off()
prob.dec <- array(NA, dim=fx)
prob.sdec <- array(NA, dim=fx)
prob.ldec <- array(NA, dim=fx)
prob.pval <- array(NA, dim=fx)
perf.pe <- array(0, dim=fx)
perf.mape <- array(0, dim=fx)
perf.mape1 <- array(0, dim=fx)
perf.se <- array(0, dim=fx)
perf.mse <- array(0, dim=fx)
perf.mse1 <- array(0, dim=fx)
perf.rmse <- array(0, dim=fx)
for (i in 1:fx) {
locSD <- (ub[i] - forecast$pred[i]) / 1.96
perf.pe[i] = (x[nx+i] - forecast$pred[i]) / forecast$pred[i]
perf.se[i] = (x[nx+i] - forecast$pred[i])^2
prob.dec[i] = pnorm((x[nx+i-1] - forecast$pred[i]) / locSD)
prob.sdec[i] = pnorm((x[nx+i-par5] - forecast$pred[i]) / locSD)
prob.ldec[i] = pnorm((x[nx] - forecast$pred[i]) / locSD)
prob.pval[i] = pnorm(abs(x[nx+i] - forecast$pred[i]) / locSD)
}
perf.mape[1] = abs(perf.pe[1])
perf.mse[1] = abs(perf.se[1])
for (i in 2:fx) {
perf.mape[i] = perf.mape[i-1] + abs(perf.pe[i])
perf.mape1[i] = perf.mape[i] / i
perf.mse[i] = perf.mse[i-1] + perf.se[i]
perf.mse1[i] = perf.mse[i] / i
}
perf.rmse = sqrt(perf.mse1)
bitmap(file='test2.png')
plot(forecast$pred, pch=19, type='b',main='ARIMA Extrapolation Forecast', ylab='Forecast and 95% CI', xlab='time',ylim=c(min(lb),max(ub)))
dum <- forecast$pred
dum[1:par1] <- x[(nx+1):lx]
lines(dum, lty=1)
lines(ub,lty=3)
lines(lb,lty=3)
dev.off()
load(file='createtable')
a<-table.start()
a<-table.row.start(a)
a<-table.element(a,'Univariate ARIMA Extrapolation Forecast',9,TRUE)
a<-table.row.end(a)
a<-table.row.start(a)
a<-table.element(a,'time',1,header=TRUE)
a<-table.element(a,'Y[t]',1,header=TRUE)
a<-table.element(a,'F[t]',1,header=TRUE)
a<-table.element(a,'95% LB',1,header=TRUE)
a<-table.element(a,'95% UB',1,header=TRUE)
a<-table.element(a,'p-value
(H0: Y[t] = F[t])',1,header=TRUE)
a<-table.element(a,'P(F[t]>Y[t-1])',1,header=TRUE)
a<-table.element(a,'P(F[t]>Y[t-s])',1,header=TRUE)
mylab <- paste('P(F[t]>Y[',nx,sep='')
mylab <- paste(mylab,'])',sep='')
a<-table.element(a,mylab,1,header=TRUE)
a<-table.row.end(a)
for (i in (nx-par5):nx) {
a<-table.row.start(a)
a<-table.element(a,i,header=TRUE)
a<-table.element(a,x[i])
a<-table.element(a,'-')
a<-table.row.end(a)
}
for (i in 1:fx) {
a<-table.row.start(a)
a<-table.element(a,nx+i,header=TRUE)
a<-table.element(a,round(x[nx+i],4))
a<-table.element(a,round(forecast$pred[i],4))
a<-table.element(a,round(lb[i],4))
a<-table.element(a,round(ub[i],4))
a<-table.element(a,round((1-prob.pval[i]),4))
a<-table.element(a,round((1-prob.dec[i]),4))
a<-table.element(a,round((1-prob.sdec[i]),4))
a<-table.element(a,round((1-prob.ldec[i]),4))
a<-table.row.end(a)
}
a<-table.end(a)
table.save(a,file='mytable.tab')
a<-table.start()
a<-table.row.start(a)
a<-table.element(a,'Univariate ARIMA Extrapolation Forecast Performance',7,TRUE)
a<-table.row.end(a)
a<-table.row.start(a)
a<-table.element(a,'time',1,header=TRUE)
a<-table.element(a,'% S.E.',1,header=TRUE)
a<-table.element(a,'PE',1,header=TRUE)
a<-table.element(a,'MAPE',1,header=TRUE)
a<-table.element(a,'Sq.E',1,header=TRUE)
a<-table.element(a,'MSE',1,header=TRUE)
a<-table.element(a,'RMSE',1,header=TRUE)
a<-table.row.end(a)
for (i in 1:fx) {
a<-table.row.start(a)
a<-table.element(a,nx+i,header=TRUE)
a<-table.element(a,round(perc.se[i],4))
a<-table.element(a,round(perf.pe[i],4))
a<-table.element(a,round(perf.mape1[i],4))
a<-table.element(a,round(perf.se[i],4))
a<-table.element(a,round(perf.mse1[i],4))
a<-table.element(a,round(perf.rmse[i],4))
a<-table.row.end(a)
}
a<-table.end(a)
table.save(a,file='mytable1.tab')