Free Statistics

of Irreproducible Research!

Author's title

Author*The author of this computation has been verified*
R Software Modulerwasp_arimaforecasting.wasp
Title produced by softwareARIMA Forecasting
Date of computationFri, 11 Dec 2009 13:28:46 -0700
Cite this page as followsStatistical Computations at FreeStatistics.org, Office for Research Development and Education, URL https://freestatistics.org/blog/index.php?v=date/2009/Dec/11/t1260563392j3o65dvatxv7pm7.htm/, Retrieved Mon, 29 Apr 2024 00:35:44 +0000
Statistical Computations at FreeStatistics.org, Office for Research Development and Education, URL https://freestatistics.org/blog/index.php?pk=66769, Retrieved Mon, 29 Apr 2024 00:35:44 +0000
QR Codes:

Original text written by user:
IsPrivate?No (this computation is public)
User-defined keywordsWS 10
Estimated Impact164
Family? (F = Feedback message, R = changed R code, M = changed R Module, P = changed Parameters, D = changed Data)
-     [ARIMA Forecasting] [] [2009-12-07 09:54:52] [b98453cac15ba1066b407e146608df68]
-    D  [ARIMA Forecasting] [WS10 Forecasting] [2009-12-10 22:24:01] [5c968c05ca472afa314d272082b56b09]
F   PD      [ARIMA Forecasting] [Workshop 10] [2009-12-11 20:28:46] [e2f800c9186517d2e5c4a809848912a7] [Current]
-   P         [ARIMA Forecasting] [WS 10] [2009-12-15 08:18:50] [101f710c1bf3d900563184d79f7da6e1]
- R P         [ARIMA Forecasting] [WS 10 Review 1 1] [2009-12-17 10:05:16] [83058a88a37d754675a5cd22dab372fc]
Feedback Forum
2009-12-15 09:21:15 [Annelies Kenis] [reply
Bij de feedback message (peer review) had ik volgende verbetering aangegeven (voor de verbeterde forecasting met lambda =1 :http://www.freestatistics.org/blog/index.php?v=date/2009/Dec/15/t1260865212ny14yg1sp7rjcyx.htm/) 'Voor de volgende maanden moet de nulhypothese aanvaard worden: maand 33, 44, 45, 46, 49, 52, 53, 54, 55, 56' . Dit klopt uiteraard niet. Voor de aangegeven maanden zal de nulhypothes namelijk verworpen moeten worden en de alternatieve hypothese aanvaard moeten worden! (dit houdt in dat de je bij de meeste maanden de nulhypothese gaat aanvaarden)
2009-12-17 10:07:54 [Brecht Thijs] [reply
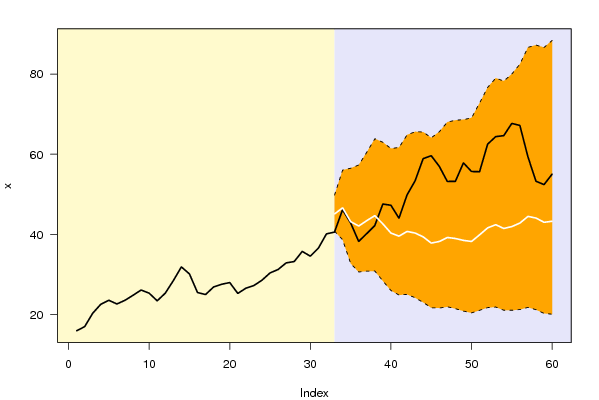
Wat me opvalt is dat de witte lijn bij de start eigenlijk een 'breuk'
vertoont met de reële waarden.Daarnaast geeft de voorspelling een (lichte) daling aan terwijl je dit niet zou verwachten als je de gekende waarden bekijkt.
Ik heb nog even de forecast uitgevoerd voor een testing period van 12.
Dit geeft volgend resultaat:
http://www.freestatistics.org/blog/index.php?v=date/2009/Dec/17/t1261044391wkyefgokgh5h0m1.htm/

Het 'vreemde' resultaat in de eerste forecast zou dus inderdaad
kunnen liggen aan de lange testing period ten opzichte van het aantal
periodes van de originele reeks.

Post a new message
Dataseries X:
15.89
16.93
20.28
22.52
23.51
22.59
23.51
24.76
26.08
25.29
23.38
25.29
28.42
31.85
30.1
25.45
24.95
26.84
27.52
27.94
25.23
26.53
27.21
28.53
30.35
31.21
32.86
33.2
35.73
34.53
36.54
40.1
40.56
46.14
42.85
38.22
40.18
42.19
47.56
47.26
44.03
49.83
53.35
58.9
59.64
56.99
53.2
53.24
57.85
55.69
55.64
62.52
64.4
64.65
67.71
67.21
59.37
53.26
52.42
55.03


Summary of computational transaction
Raw Inputview raw input (R code)
Raw Outputview raw output of R engine
Computing time3 seconds
R Server'Gwilym Jenkins' @ 72.249.127.135

\begin{tabular}{lllllllll}
\hline
Summary of computational transaction \tabularnewline
Raw Input & view raw input (R code)  \tabularnewline
Raw Output & view raw output of R engine  \tabularnewline
Computing time & 3 seconds \tabularnewline
R Server & 'Gwilym Jenkins' @ 72.249.127.135 \tabularnewline
\hline
\end{tabular}
%Source: https://freestatistics.org/blog/index.php?pk=66769&T=0

[TABLE]
[ROW][C]Summary of computational transaction[/C][/ROW]
[ROW][C]Raw Input[/C][C]view raw input (R code) [/C][/ROW]
[ROW][C]Raw Output[/C][C]view raw output of R engine [/C][/ROW]
[ROW][C]Computing time[/C][C]3 seconds[/C][/ROW]
[ROW][C]R Server[/C][C]'Gwilym Jenkins' @ 72.249.127.135[/C][/ROW]
[/TABLE]
Source: https://freestatistics.org/blog/index.php?pk=66769&T=0

Globally Unique Identifier (entire table): ba.freestatistics.org/blog/index.php?pk=66769&T=0

As an alternative you can also use a QR Code:  

The GUIDs for individual cells are displayed in the table below:

Summary of computational transaction
Raw Inputview raw input (R code)
Raw Outputview raw output of R engine
Computing time3 seconds
R Server'Gwilym Jenkins' @ 72.249.127.135


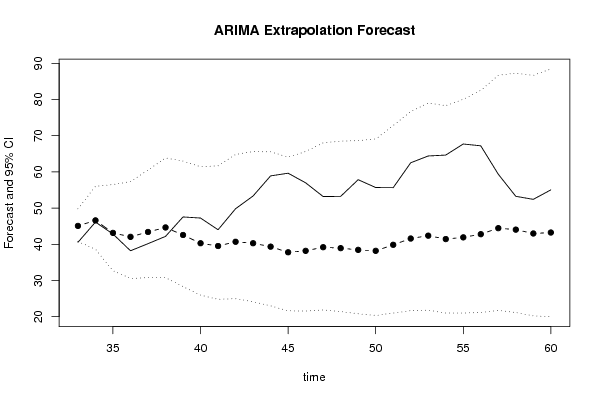
Univariate ARIMA Extrapolation Forecast
timeY[t]F[t]95% LB95% UBp-value(H0: Y[t] = F[t])P(F[t]>Y[t-1])P(F[t]>Y[t-s])P(F[t]>Y[32])
2027.94-------
2125.23-------
2226.53-------
2327.21-------
2428.53-------
2530.35-------
2631.21-------
2732.86-------
2833.2-------
2935.73-------
3034.53-------
3136.54-------
3240.1-------
3340.5645.079240.772349.79150.03010.980810.9808
3446.1446.607738.633456.03390.46130.895710.912
3542.8543.156332.717356.50270.48210.33060.99040.6732
3638.2242.064730.568257.3160.31060.45980.9590.5997
3740.1843.411730.800260.49430.35540.72430.9330.648
3842.1944.656330.810563.87030.40070.6760.91490.679
3947.5642.57828.33162.9770.31610.51490.82480.5941
4047.2640.298125.952261.4240.25920.25020.74490.5073
4144.0339.533624.814361.6920.34540.24720.63170.48
4249.8340.707824.992764.81640.22920.39350.69230.5197
4353.3540.302524.138765.62870.15630.23050.61450.5063
4458.939.350822.985765.54410.07180.14740.47760.4776
4559.6437.796521.637764.10490.05180.05790.41840.4319
4656.9938.202321.563365.61820.08960.06270.28520.446
4753.239.205121.878968.02910.17060.11330.40210.4757
4853.2438.94421.408268.48990.17150.17210.51920.4694
4957.8538.471820.808768.6410.1040.16870.45580.4579
5055.6938.203720.352869.08440.13350.10620.40010.4521
5155.6439.868521.006372.80260.1740.17320.32360.4945
5262.5241.597121.679876.69240.12130.21640.37590.5333
5364.442.392321.82179.01950.11950.14070.46510.5488
5464.6541.44921.017778.28550.10850.1110.32780.5286
5567.7141.92621.001180.03950.09240.12130.27840.5374
5667.2142.797821.196482.51620.11420.10950.21340.553
5759.3744.462521.735886.70540.24460.14560.24070.5802
5853.2644.055221.149687.27630.33820.24370.27870.5712
5952.4242.991820.224786.67880.33610.32250.32350.5516
6055.0343.257520.025288.43360.30480.34550.33250.5545

\begin{tabular}{lllllllll}
\hline
Univariate ARIMA Extrapolation Forecast \tabularnewline
time & Y[t] & F[t] & 95% LB & 95% UB & p-value(H0: Y[t] = F[t]) & P(F[t]>Y[t-1]) & P(F[t]>Y[t-s]) & P(F[t]>Y[32]) \tabularnewline
20 & 27.94 & - & - & - & - & - & - & - \tabularnewline
21 & 25.23 & - & - & - & - & - & - & - \tabularnewline
22 & 26.53 & - & - & - & - & - & - & - \tabularnewline
23 & 27.21 & - & - & - & - & - & - & - \tabularnewline
24 & 28.53 & - & - & - & - & - & - & - \tabularnewline
25 & 30.35 & - & - & - & - & - & - & - \tabularnewline
26 & 31.21 & - & - & - & - & - & - & - \tabularnewline
27 & 32.86 & - & - & - & - & - & - & - \tabularnewline
28 & 33.2 & - & - & - & - & - & - & - \tabularnewline
29 & 35.73 & - & - & - & - & - & - & - \tabularnewline
30 & 34.53 & - & - & - & - & - & - & - \tabularnewline
31 & 36.54 & - & - & - & - & - & - & - \tabularnewline
32 & 40.1 & - & - & - & - & - & - & - \tabularnewline
33 & 40.56 & 45.0792 & 40.7723 & 49.7915 & 0.0301 & 0.9808 & 1 & 0.9808 \tabularnewline
34 & 46.14 & 46.6077 & 38.6334 & 56.0339 & 0.4613 & 0.8957 & 1 & 0.912 \tabularnewline
35 & 42.85 & 43.1563 & 32.7173 & 56.5027 & 0.4821 & 0.3306 & 0.9904 & 0.6732 \tabularnewline
36 & 38.22 & 42.0647 & 30.5682 & 57.316 & 0.3106 & 0.4598 & 0.959 & 0.5997 \tabularnewline
37 & 40.18 & 43.4117 & 30.8002 & 60.4943 & 0.3554 & 0.7243 & 0.933 & 0.648 \tabularnewline
38 & 42.19 & 44.6563 & 30.8105 & 63.8703 & 0.4007 & 0.676 & 0.9149 & 0.679 \tabularnewline
39 & 47.56 & 42.578 & 28.331 & 62.977 & 0.3161 & 0.5149 & 0.8248 & 0.5941 \tabularnewline
40 & 47.26 & 40.2981 & 25.9522 & 61.424 & 0.2592 & 0.2502 & 0.7449 & 0.5073 \tabularnewline
41 & 44.03 & 39.5336 & 24.8143 & 61.692 & 0.3454 & 0.2472 & 0.6317 & 0.48 \tabularnewline
42 & 49.83 & 40.7078 & 24.9927 & 64.8164 & 0.2292 & 0.3935 & 0.6923 & 0.5197 \tabularnewline
43 & 53.35 & 40.3025 & 24.1387 & 65.6287 & 0.1563 & 0.2305 & 0.6145 & 0.5063 \tabularnewline
44 & 58.9 & 39.3508 & 22.9857 & 65.5441 & 0.0718 & 0.1474 & 0.4776 & 0.4776 \tabularnewline
45 & 59.64 & 37.7965 & 21.6377 & 64.1049 & 0.0518 & 0.0579 & 0.4184 & 0.4319 \tabularnewline
46 & 56.99 & 38.2023 & 21.5633 & 65.6182 & 0.0896 & 0.0627 & 0.2852 & 0.446 \tabularnewline
47 & 53.2 & 39.2051 & 21.8789 & 68.0291 & 0.1706 & 0.1133 & 0.4021 & 0.4757 \tabularnewline
48 & 53.24 & 38.944 & 21.4082 & 68.4899 & 0.1715 & 0.1721 & 0.5192 & 0.4694 \tabularnewline
49 & 57.85 & 38.4718 & 20.8087 & 68.641 & 0.104 & 0.1687 & 0.4558 & 0.4579 \tabularnewline
50 & 55.69 & 38.2037 & 20.3528 & 69.0844 & 0.1335 & 0.1062 & 0.4001 & 0.4521 \tabularnewline
51 & 55.64 & 39.8685 & 21.0063 & 72.8026 & 0.174 & 0.1732 & 0.3236 & 0.4945 \tabularnewline
52 & 62.52 & 41.5971 & 21.6798 & 76.6924 & 0.1213 & 0.2164 & 0.3759 & 0.5333 \tabularnewline
53 & 64.4 & 42.3923 & 21.821 & 79.0195 & 0.1195 & 0.1407 & 0.4651 & 0.5488 \tabularnewline
54 & 64.65 & 41.449 & 21.0177 & 78.2855 & 0.1085 & 0.111 & 0.3278 & 0.5286 \tabularnewline
55 & 67.71 & 41.926 & 21.0011 & 80.0395 & 0.0924 & 0.1213 & 0.2784 & 0.5374 \tabularnewline
56 & 67.21 & 42.7978 & 21.1964 & 82.5162 & 0.1142 & 0.1095 & 0.2134 & 0.553 \tabularnewline
57 & 59.37 & 44.4625 & 21.7358 & 86.7054 & 0.2446 & 0.1456 & 0.2407 & 0.5802 \tabularnewline
58 & 53.26 & 44.0552 & 21.1496 & 87.2763 & 0.3382 & 0.2437 & 0.2787 & 0.5712 \tabularnewline
59 & 52.42 & 42.9918 & 20.2247 & 86.6788 & 0.3361 & 0.3225 & 0.3235 & 0.5516 \tabularnewline
60 & 55.03 & 43.2575 & 20.0252 & 88.4336 & 0.3048 & 0.3455 & 0.3325 & 0.5545 \tabularnewline
\hline
\end{tabular}
%Source: https://freestatistics.org/blog/index.php?pk=66769&T=1

[TABLE]
[ROW][C]Univariate ARIMA Extrapolation Forecast[/C][/ROW]
[ROW][C]time[/C][C]Y[t][/C][C]F[t][/C][C]95% LB[/C][C]95% UB[/C][C]p-value(H0: Y[t] = F[t])[/C][C]P(F[t]>Y[t-1])[/C][C]P(F[t]>Y[t-s])[/C][C]P(F[t]>Y[32])[/C][/ROW]
[ROW][C]20[/C][C]27.94[/C][C]-[/C][C]-[/C][C]-[/C][C]-[/C][C]-[/C][C]-[/C][C]-[/C][/ROW]
[ROW][C]21[/C][C]25.23[/C][C]-[/C][C]-[/C][C]-[/C][C]-[/C][C]-[/C][C]-[/C][C]-[/C][/ROW]
[ROW][C]22[/C][C]26.53[/C][C]-[/C][C]-[/C][C]-[/C][C]-[/C][C]-[/C][C]-[/C][C]-[/C][/ROW]
[ROW][C]23[/C][C]27.21[/C][C]-[/C][C]-[/C][C]-[/C][C]-[/C][C]-[/C][C]-[/C][C]-[/C][/ROW]
[ROW][C]24[/C][C]28.53[/C][C]-[/C][C]-[/C][C]-[/C][C]-[/C][C]-[/C][C]-[/C][C]-[/C][/ROW]
[ROW][C]25[/C][C]30.35[/C][C]-[/C][C]-[/C][C]-[/C][C]-[/C][C]-[/C][C]-[/C][C]-[/C][/ROW]
[ROW][C]26[/C][C]31.21[/C][C]-[/C][C]-[/C][C]-[/C][C]-[/C][C]-[/C][C]-[/C][C]-[/C][/ROW]
[ROW][C]27[/C][C]32.86[/C][C]-[/C][C]-[/C][C]-[/C][C]-[/C][C]-[/C][C]-[/C][C]-[/C][/ROW]
[ROW][C]28[/C][C]33.2[/C][C]-[/C][C]-[/C][C]-[/C][C]-[/C][C]-[/C][C]-[/C][C]-[/C][/ROW]
[ROW][C]29[/C][C]35.73[/C][C]-[/C][C]-[/C][C]-[/C][C]-[/C][C]-[/C][C]-[/C][C]-[/C][/ROW]
[ROW][C]30[/C][C]34.53[/C][C]-[/C][C]-[/C][C]-[/C][C]-[/C][C]-[/C][C]-[/C][C]-[/C][/ROW]
[ROW][C]31[/C][C]36.54[/C][C]-[/C][C]-[/C][C]-[/C][C]-[/C][C]-[/C][C]-[/C][C]-[/C][/ROW]
[ROW][C]32[/C][C]40.1[/C][C]-[/C][C]-[/C][C]-[/C][C]-[/C][C]-[/C][C]-[/C][C]-[/C][/ROW]
[ROW][C]33[/C][C]40.56[/C][C]45.0792[/C][C]40.7723[/C][C]49.7915[/C][C]0.0301[/C][C]0.9808[/C][C]1[/C][C]0.9808[/C][/ROW]
[ROW][C]34[/C][C]46.14[/C][C]46.6077[/C][C]38.6334[/C][C]56.0339[/C][C]0.4613[/C][C]0.8957[/C][C]1[/C][C]0.912[/C][/ROW]
[ROW][C]35[/C][C]42.85[/C][C]43.1563[/C][C]32.7173[/C][C]56.5027[/C][C]0.4821[/C][C]0.3306[/C][C]0.9904[/C][C]0.6732[/C][/ROW]
[ROW][C]36[/C][C]38.22[/C][C]42.0647[/C][C]30.5682[/C][C]57.316[/C][C]0.3106[/C][C]0.4598[/C][C]0.959[/C][C]0.5997[/C][/ROW]
[ROW][C]37[/C][C]40.18[/C][C]43.4117[/C][C]30.8002[/C][C]60.4943[/C][C]0.3554[/C][C]0.7243[/C][C]0.933[/C][C]0.648[/C][/ROW]
[ROW][C]38[/C][C]42.19[/C][C]44.6563[/C][C]30.8105[/C][C]63.8703[/C][C]0.4007[/C][C]0.676[/C][C]0.9149[/C][C]0.679[/C][/ROW]
[ROW][C]39[/C][C]47.56[/C][C]42.578[/C][C]28.331[/C][C]62.977[/C][C]0.3161[/C][C]0.5149[/C][C]0.8248[/C][C]0.5941[/C][/ROW]
[ROW][C]40[/C][C]47.26[/C][C]40.2981[/C][C]25.9522[/C][C]61.424[/C][C]0.2592[/C][C]0.2502[/C][C]0.7449[/C][C]0.5073[/C][/ROW]
[ROW][C]41[/C][C]44.03[/C][C]39.5336[/C][C]24.8143[/C][C]61.692[/C][C]0.3454[/C][C]0.2472[/C][C]0.6317[/C][C]0.48[/C][/ROW]
[ROW][C]42[/C][C]49.83[/C][C]40.7078[/C][C]24.9927[/C][C]64.8164[/C][C]0.2292[/C][C]0.3935[/C][C]0.6923[/C][C]0.5197[/C][/ROW]
[ROW][C]43[/C][C]53.35[/C][C]40.3025[/C][C]24.1387[/C][C]65.6287[/C][C]0.1563[/C][C]0.2305[/C][C]0.6145[/C][C]0.5063[/C][/ROW]
[ROW][C]44[/C][C]58.9[/C][C]39.3508[/C][C]22.9857[/C][C]65.5441[/C][C]0.0718[/C][C]0.1474[/C][C]0.4776[/C][C]0.4776[/C][/ROW]
[ROW][C]45[/C][C]59.64[/C][C]37.7965[/C][C]21.6377[/C][C]64.1049[/C][C]0.0518[/C][C]0.0579[/C][C]0.4184[/C][C]0.4319[/C][/ROW]
[ROW][C]46[/C][C]56.99[/C][C]38.2023[/C][C]21.5633[/C][C]65.6182[/C][C]0.0896[/C][C]0.0627[/C][C]0.2852[/C][C]0.446[/C][/ROW]
[ROW][C]47[/C][C]53.2[/C][C]39.2051[/C][C]21.8789[/C][C]68.0291[/C][C]0.1706[/C][C]0.1133[/C][C]0.4021[/C][C]0.4757[/C][/ROW]
[ROW][C]48[/C][C]53.24[/C][C]38.944[/C][C]21.4082[/C][C]68.4899[/C][C]0.1715[/C][C]0.1721[/C][C]0.5192[/C][C]0.4694[/C][/ROW]
[ROW][C]49[/C][C]57.85[/C][C]38.4718[/C][C]20.8087[/C][C]68.641[/C][C]0.104[/C][C]0.1687[/C][C]0.4558[/C][C]0.4579[/C][/ROW]
[ROW][C]50[/C][C]55.69[/C][C]38.2037[/C][C]20.3528[/C][C]69.0844[/C][C]0.1335[/C][C]0.1062[/C][C]0.4001[/C][C]0.4521[/C][/ROW]
[ROW][C]51[/C][C]55.64[/C][C]39.8685[/C][C]21.0063[/C][C]72.8026[/C][C]0.174[/C][C]0.1732[/C][C]0.3236[/C][C]0.4945[/C][/ROW]
[ROW][C]52[/C][C]62.52[/C][C]41.5971[/C][C]21.6798[/C][C]76.6924[/C][C]0.1213[/C][C]0.2164[/C][C]0.3759[/C][C]0.5333[/C][/ROW]
[ROW][C]53[/C][C]64.4[/C][C]42.3923[/C][C]21.821[/C][C]79.0195[/C][C]0.1195[/C][C]0.1407[/C][C]0.4651[/C][C]0.5488[/C][/ROW]
[ROW][C]54[/C][C]64.65[/C][C]41.449[/C][C]21.0177[/C][C]78.2855[/C][C]0.1085[/C][C]0.111[/C][C]0.3278[/C][C]0.5286[/C][/ROW]
[ROW][C]55[/C][C]67.71[/C][C]41.926[/C][C]21.0011[/C][C]80.0395[/C][C]0.0924[/C][C]0.1213[/C][C]0.2784[/C][C]0.5374[/C][/ROW]
[ROW][C]56[/C][C]67.21[/C][C]42.7978[/C][C]21.1964[/C][C]82.5162[/C][C]0.1142[/C][C]0.1095[/C][C]0.2134[/C][C]0.553[/C][/ROW]
[ROW][C]57[/C][C]59.37[/C][C]44.4625[/C][C]21.7358[/C][C]86.7054[/C][C]0.2446[/C][C]0.1456[/C][C]0.2407[/C][C]0.5802[/C][/ROW]
[ROW][C]58[/C][C]53.26[/C][C]44.0552[/C][C]21.1496[/C][C]87.2763[/C][C]0.3382[/C][C]0.2437[/C][C]0.2787[/C][C]0.5712[/C][/ROW]
[ROW][C]59[/C][C]52.42[/C][C]42.9918[/C][C]20.2247[/C][C]86.6788[/C][C]0.3361[/C][C]0.3225[/C][C]0.3235[/C][C]0.5516[/C][/ROW]
[ROW][C]60[/C][C]55.03[/C][C]43.2575[/C][C]20.0252[/C][C]88.4336[/C][C]0.3048[/C][C]0.3455[/C][C]0.3325[/C][C]0.5545[/C][/ROW]
[/TABLE]
Source: https://freestatistics.org/blog/index.php?pk=66769&T=1

Globally Unique Identifier (entire table): ba.freestatistics.org/blog/index.php?pk=66769&T=1

As an alternative you can also use a QR Code:  

The GUIDs for individual cells are displayed in the table below:

Univariate ARIMA Extrapolation Forecast
timeY[t]F[t]95% LB95% UBp-value(H0: Y[t] = F[t])P(F[t]>Y[t-1])P(F[t]>Y[t-s])P(F[t]>Y[32])
2027.94-------
2125.23-------
2226.53-------
2327.21-------
2428.53-------
2530.35-------
2631.21-------
2732.86-------
2833.2-------
2935.73-------
3034.53-------
3136.54-------
3240.1-------
3340.5645.079240.772349.79150.03010.980810.9808
3446.1446.607738.633456.03390.46130.895710.912
3542.8543.156332.717356.50270.48210.33060.99040.6732
3638.2242.064730.568257.3160.31060.45980.9590.5997
3740.1843.411730.800260.49430.35540.72430.9330.648
3842.1944.656330.810563.87030.40070.6760.91490.679
3947.5642.57828.33162.9770.31610.51490.82480.5941
4047.2640.298125.952261.4240.25920.25020.74490.5073
4144.0339.533624.814361.6920.34540.24720.63170.48
4249.8340.707824.992764.81640.22920.39350.69230.5197
4353.3540.302524.138765.62870.15630.23050.61450.5063
4458.939.350822.985765.54410.07180.14740.47760.4776
4559.6437.796521.637764.10490.05180.05790.41840.4319
4656.9938.202321.563365.61820.08960.06270.28520.446
4753.239.205121.878968.02910.17060.11330.40210.4757
4853.2438.94421.408268.48990.17150.17210.51920.4694
4957.8538.471820.808768.6410.1040.16870.45580.4579
5055.6938.203720.352869.08440.13350.10620.40010.4521
5155.6439.868521.006372.80260.1740.17320.32360.4945
5262.5241.597121.679876.69240.12130.21640.37590.5333
5364.442.392321.82179.01950.11950.14070.46510.5488
5464.6541.44921.017778.28550.10850.1110.32780.5286
5567.7141.92621.001180.03950.09240.12130.27840.5374
5667.2142.797821.196482.51620.11420.10950.21340.553
5759.3744.462521.735886.70540.24460.14560.24070.5802
5853.2644.055221.149687.27630.33820.24370.27870.5712
5952.4242.991820.224786.67880.33610.32250.32350.5516
6055.0343.257520.025288.43360.30480.34550.33250.5545


Univariate ARIMA Extrapolation Forecast Performance
time% S.E.PEMAPESq.EMSERMSE
330.0533-0.1003020.423600
340.1032-0.010.05510.218710.32123.2127
350.1578-0.00710.03910.09386.9122.6291
360.185-0.09140.052214.78178.87942.9798
370.2008-0.07440.056610.44419.19243.0319
380.2195-0.05520.05646.08288.67412.9452
390.24440.1170.065124.820710.98083.3137
400.26750.17280.078548.468515.66673.9581
410.2860.11370.082420.217416.17244.0215
420.30220.22410.096683.215322.87674.783
430.32060.32370.1173170.236736.2736.0227
440.33960.49680.1489382.171965.09798.0683
450.35510.57790.1819477.138296.79339.8384
460.36610.49180.204352.9783115.092310.7281
470.37510.3570.2142195.8586120.476710.9762
480.38710.36710.2238204.375125.720311.2125
490.40010.50370.2402375.513140.41411.8496
500.41240.45770.2523305.7714149.600512.2311
510.42150.39560.2599248.7408154.818512.4426
520.43050.5030.272437.7681168.965912.9987
530.44080.51910.2838484.3368183.983613.5641
540.45340.55970.2963538.2874200.088314.1453
550.46380.6150.3102664.8125220.293714.8423
560.47350.57040.321595.9565235.946315.3605
570.48470.33530.3216222.2321235.397815.3427
580.50050.20890.317384.7283229.602815.1526
590.51850.21930.313688.8919224.391314.9797
600.53280.27210.3122138.591221.32714.8771

\begin{tabular}{lllllllll}
\hline
Univariate ARIMA Extrapolation Forecast Performance \tabularnewline
time & % S.E. & PE & MAPE & Sq.E & MSE & RMSE \tabularnewline
33 & 0.0533 & -0.1003 & 0 & 20.4236 & 0 & 0 \tabularnewline
34 & 0.1032 & -0.01 & 0.0551 & 0.2187 & 10.3212 & 3.2127 \tabularnewline
35 & 0.1578 & -0.0071 & 0.0391 & 0.0938 & 6.912 & 2.6291 \tabularnewline
36 & 0.185 & -0.0914 & 0.0522 & 14.7817 & 8.8794 & 2.9798 \tabularnewline
37 & 0.2008 & -0.0744 & 0.0566 & 10.4441 & 9.1924 & 3.0319 \tabularnewline
38 & 0.2195 & -0.0552 & 0.0564 & 6.0828 & 8.6741 & 2.9452 \tabularnewline
39 & 0.2444 & 0.117 & 0.0651 & 24.8207 & 10.9808 & 3.3137 \tabularnewline
40 & 0.2675 & 0.1728 & 0.0785 & 48.4685 & 15.6667 & 3.9581 \tabularnewline
41 & 0.286 & 0.1137 & 0.0824 & 20.2174 & 16.1724 & 4.0215 \tabularnewline
42 & 0.3022 & 0.2241 & 0.0966 & 83.2153 & 22.8767 & 4.783 \tabularnewline
43 & 0.3206 & 0.3237 & 0.1173 & 170.2367 & 36.273 & 6.0227 \tabularnewline
44 & 0.3396 & 0.4968 & 0.1489 & 382.1719 & 65.0979 & 8.0683 \tabularnewline
45 & 0.3551 & 0.5779 & 0.1819 & 477.1382 & 96.7933 & 9.8384 \tabularnewline
46 & 0.3661 & 0.4918 & 0.204 & 352.9783 & 115.0923 & 10.7281 \tabularnewline
47 & 0.3751 & 0.357 & 0.2142 & 195.8586 & 120.4767 & 10.9762 \tabularnewline
48 & 0.3871 & 0.3671 & 0.2238 & 204.375 & 125.7203 & 11.2125 \tabularnewline
49 & 0.4001 & 0.5037 & 0.2402 & 375.513 & 140.414 & 11.8496 \tabularnewline
50 & 0.4124 & 0.4577 & 0.2523 & 305.7714 & 149.6005 & 12.2311 \tabularnewline
51 & 0.4215 & 0.3956 & 0.2599 & 248.7408 & 154.8185 & 12.4426 \tabularnewline
52 & 0.4305 & 0.503 & 0.272 & 437.7681 & 168.9659 & 12.9987 \tabularnewline
53 & 0.4408 & 0.5191 & 0.2838 & 484.3368 & 183.9836 & 13.5641 \tabularnewline
54 & 0.4534 & 0.5597 & 0.2963 & 538.2874 & 200.0883 & 14.1453 \tabularnewline
55 & 0.4638 & 0.615 & 0.3102 & 664.8125 & 220.2937 & 14.8423 \tabularnewline
56 & 0.4735 & 0.5704 & 0.321 & 595.9565 & 235.9463 & 15.3605 \tabularnewline
57 & 0.4847 & 0.3353 & 0.3216 & 222.2321 & 235.3978 & 15.3427 \tabularnewline
58 & 0.5005 & 0.2089 & 0.3173 & 84.7283 & 229.6028 & 15.1526 \tabularnewline
59 & 0.5185 & 0.2193 & 0.3136 & 88.8919 & 224.3913 & 14.9797 \tabularnewline
60 & 0.5328 & 0.2721 & 0.3122 & 138.591 & 221.327 & 14.8771 \tabularnewline
\hline
\end{tabular}
%Source: https://freestatistics.org/blog/index.php?pk=66769&T=2

[TABLE]
[ROW][C]Univariate ARIMA Extrapolation Forecast Performance[/C][/ROW]
[ROW][C]time[/C][C]% S.E.[/C][C]PE[/C][C]MAPE[/C][C]Sq.E[/C][C]MSE[/C][C]RMSE[/C][/ROW]
[ROW][C]33[/C][C]0.0533[/C][C]-0.1003[/C][C]0[/C][C]20.4236[/C][C]0[/C][C]0[/C][/ROW]
[ROW][C]34[/C][C]0.1032[/C][C]-0.01[/C][C]0.0551[/C][C]0.2187[/C][C]10.3212[/C][C]3.2127[/C][/ROW]
[ROW][C]35[/C][C]0.1578[/C][C]-0.0071[/C][C]0.0391[/C][C]0.0938[/C][C]6.912[/C][C]2.6291[/C][/ROW]
[ROW][C]36[/C][C]0.185[/C][C]-0.0914[/C][C]0.0522[/C][C]14.7817[/C][C]8.8794[/C][C]2.9798[/C][/ROW]
[ROW][C]37[/C][C]0.2008[/C][C]-0.0744[/C][C]0.0566[/C][C]10.4441[/C][C]9.1924[/C][C]3.0319[/C][/ROW]
[ROW][C]38[/C][C]0.2195[/C][C]-0.0552[/C][C]0.0564[/C][C]6.0828[/C][C]8.6741[/C][C]2.9452[/C][/ROW]
[ROW][C]39[/C][C]0.2444[/C][C]0.117[/C][C]0.0651[/C][C]24.8207[/C][C]10.9808[/C][C]3.3137[/C][/ROW]
[ROW][C]40[/C][C]0.2675[/C][C]0.1728[/C][C]0.0785[/C][C]48.4685[/C][C]15.6667[/C][C]3.9581[/C][/ROW]
[ROW][C]41[/C][C]0.286[/C][C]0.1137[/C][C]0.0824[/C][C]20.2174[/C][C]16.1724[/C][C]4.0215[/C][/ROW]
[ROW][C]42[/C][C]0.3022[/C][C]0.2241[/C][C]0.0966[/C][C]83.2153[/C][C]22.8767[/C][C]4.783[/C][/ROW]
[ROW][C]43[/C][C]0.3206[/C][C]0.3237[/C][C]0.1173[/C][C]170.2367[/C][C]36.273[/C][C]6.0227[/C][/ROW]
[ROW][C]44[/C][C]0.3396[/C][C]0.4968[/C][C]0.1489[/C][C]382.1719[/C][C]65.0979[/C][C]8.0683[/C][/ROW]
[ROW][C]45[/C][C]0.3551[/C][C]0.5779[/C][C]0.1819[/C][C]477.1382[/C][C]96.7933[/C][C]9.8384[/C][/ROW]
[ROW][C]46[/C][C]0.3661[/C][C]0.4918[/C][C]0.204[/C][C]352.9783[/C][C]115.0923[/C][C]10.7281[/C][/ROW]
[ROW][C]47[/C][C]0.3751[/C][C]0.357[/C][C]0.2142[/C][C]195.8586[/C][C]120.4767[/C][C]10.9762[/C][/ROW]
[ROW][C]48[/C][C]0.3871[/C][C]0.3671[/C][C]0.2238[/C][C]204.375[/C][C]125.7203[/C][C]11.2125[/C][/ROW]
[ROW][C]49[/C][C]0.4001[/C][C]0.5037[/C][C]0.2402[/C][C]375.513[/C][C]140.414[/C][C]11.8496[/C][/ROW]
[ROW][C]50[/C][C]0.4124[/C][C]0.4577[/C][C]0.2523[/C][C]305.7714[/C][C]149.6005[/C][C]12.2311[/C][/ROW]
[ROW][C]51[/C][C]0.4215[/C][C]0.3956[/C][C]0.2599[/C][C]248.7408[/C][C]154.8185[/C][C]12.4426[/C][/ROW]
[ROW][C]52[/C][C]0.4305[/C][C]0.503[/C][C]0.272[/C][C]437.7681[/C][C]168.9659[/C][C]12.9987[/C][/ROW]
[ROW][C]53[/C][C]0.4408[/C][C]0.5191[/C][C]0.2838[/C][C]484.3368[/C][C]183.9836[/C][C]13.5641[/C][/ROW]
[ROW][C]54[/C][C]0.4534[/C][C]0.5597[/C][C]0.2963[/C][C]538.2874[/C][C]200.0883[/C][C]14.1453[/C][/ROW]
[ROW][C]55[/C][C]0.4638[/C][C]0.615[/C][C]0.3102[/C][C]664.8125[/C][C]220.2937[/C][C]14.8423[/C][/ROW]
[ROW][C]56[/C][C]0.4735[/C][C]0.5704[/C][C]0.321[/C][C]595.9565[/C][C]235.9463[/C][C]15.3605[/C][/ROW]
[ROW][C]57[/C][C]0.4847[/C][C]0.3353[/C][C]0.3216[/C][C]222.2321[/C][C]235.3978[/C][C]15.3427[/C][/ROW]
[ROW][C]58[/C][C]0.5005[/C][C]0.2089[/C][C]0.3173[/C][C]84.7283[/C][C]229.6028[/C][C]15.1526[/C][/ROW]
[ROW][C]59[/C][C]0.5185[/C][C]0.2193[/C][C]0.3136[/C][C]88.8919[/C][C]224.3913[/C][C]14.9797[/C][/ROW]
[ROW][C]60[/C][C]0.5328[/C][C]0.2721[/C][C]0.3122[/C][C]138.591[/C][C]221.327[/C][C]14.8771[/C][/ROW]
[/TABLE]
Source: https://freestatistics.org/blog/index.php?pk=66769&T=2

Globally Unique Identifier (entire table): ba.freestatistics.org/blog/index.php?pk=66769&T=2

As an alternative you can also use a QR Code:  

The GUIDs for individual cells are displayed in the table below:

Univariate ARIMA Extrapolation Forecast Performance
time% S.E.PEMAPESq.EMSERMSE
330.0533-0.1003020.423600
340.1032-0.010.05510.218710.32123.2127
350.1578-0.00710.03910.09386.9122.6291
360.185-0.09140.052214.78178.87942.9798
370.2008-0.07440.056610.44419.19243.0319
380.2195-0.05520.05646.08288.67412.9452
390.24440.1170.065124.820710.98083.3137
400.26750.17280.078548.468515.66673.9581
410.2860.11370.082420.217416.17244.0215
420.30220.22410.096683.215322.87674.783
430.32060.32370.1173170.236736.2736.0227
440.33960.49680.1489382.171965.09798.0683
450.35510.57790.1819477.138296.79339.8384
460.36610.49180.204352.9783115.092310.7281
470.37510.3570.2142195.8586120.476710.9762
480.38710.36710.2238204.375125.720311.2125
490.40010.50370.2402375.513140.41411.8496
500.41240.45770.2523305.7714149.600512.2311
510.42150.39560.2599248.7408154.818512.4426
520.43050.5030.272437.7681168.965912.9987
530.44080.51910.2838484.3368183.983613.5641
540.45340.55970.2963538.2874200.088314.1453
550.46380.6150.3102664.8125220.293714.8423
560.47350.57040.321595.9565235.946315.3605
570.48470.33530.3216222.2321235.397815.3427
580.50050.20890.317384.7283229.602815.1526
590.51850.21930.313688.8919224.391314.9797
600.53280.27210.3122138.591221.32714.8771


Parameters (Session):
par1 = 24 ; par2 = 0.1 ; par3 = 1 ; par4 = 0 ; par5 = 12 ; par6 = 2 ; par7 = 0 ; par8 = 1 ; par9 = 1 ; par10 = FALSE ;
Parameters (R input):
par1 = 24 ; par2 = 0.1 ; par3 = 1 ; par4 = 0 ; par5 = 12 ; par6 = 2 ; par7 = 0 ; par8 = 1 ; par9 = 1 ; par10 = FALSE ;
R code (references can be found in the software module):
par1 <- as.numeric(par1) #cut off periods
par1 <- 28
par2 <- as.numeric(par2) #lambda
par3 <- as.numeric(par3) #degree of non-seasonal differencing
par4 <- as.numeric(par4) #degree of seasonal differencing
par5 <- as.numeric(par5) #seasonal period
par6 <- as.numeric(par6) #p
par6 <- 3
par7 <- as.numeric(par7) #q
par7 <- 3
par8 <- as.numeric(par8) #P
par9 <- as.numeric(par9) #Q
if (par10 == 'TRUE') par10 <- TRUE
if (par10 == 'FALSE') par10 <- FALSE
if (par2 == 0) x <- log(x)
if (par2 != 0) x <- x^par2
lx <- length(x)
first <- lx - 2*par1
nx <- lx - par1
nx1 <- nx + 1
fx <- lx - nx
if (fx < 1) {
fx <- par5
nx1 <- lx + fx - 1
first <- lx - 2*fx
}
first <- 1
if (fx < 3) fx <- round(lx/10,0)
(arima.out <- arima(x[1:nx], order=c(par6,par3,par7), seasonal=list(order=c(par8,par4,par9), period=par5), include.mean=par10, method='ML'))
(forecast <- predict(arima.out,par1))
(lb <- forecast$pred - 1.96 * forecast$se)
(ub <- forecast$pred + 1.96 * forecast$se)
if (par2 == 0) {
x <- exp(x)
forecast$pred <- exp(forecast$pred)
lb <- exp(lb)
ub <- exp(ub)
}
if (par2 != 0) {
x <- x^(1/par2)
forecast$pred <- forecast$pred^(1/par2)
lb <- lb^(1/par2)
ub <- ub^(1/par2)
}
if (par2 < 0) {
olb <- lb
lb <- ub
ub <- olb
}
(actandfor <- c(x[1:nx], forecast$pred))
(perc.se <- (ub-forecast$pred)/1.96/forecast$pred)
bitmap(file='test1.png')
opar <- par(mar=c(4,4,2,2),las=1)
ylim <- c( min(x[first:nx],lb), max(x[first:nx],ub))
plot(x,ylim=ylim,type='n',xlim=c(first,lx))
usr <- par('usr')
rect(usr[1],usr[3],nx+1,usr[4],border=NA,col='lemonchiffon')
rect(nx1,usr[3],usr[2],usr[4],border=NA,col='lavender')
abline(h= (-3:3)*2 , col ='gray', lty =3)
polygon( c(nx1:lx,lx:nx1), c(lb,rev(ub)), col = 'orange', lty=2,border=NA)
lines(nx1:lx, lb , lty=2)
lines(nx1:lx, ub , lty=2)
lines(x, lwd=2)
lines(nx1:lx, forecast$pred , lwd=2 , col ='white')
box()
par(opar)
dev.off()
prob.dec <- array(NA, dim=fx)
prob.sdec <- array(NA, dim=fx)
prob.ldec <- array(NA, dim=fx)
prob.pval <- array(NA, dim=fx)
perf.pe <- array(0, dim=fx)
perf.mape <- array(0, dim=fx)
perf.mape1 <- array(0, dim=fx)
perf.se <- array(0, dim=fx)
perf.mse <- array(0, dim=fx)
perf.mse1 <- array(0, dim=fx)
perf.rmse <- array(0, dim=fx)
for (i in 1:fx) {
locSD <- (ub[i] - forecast$pred[i]) / 1.96
perf.pe[i] = (x[nx+i] - forecast$pred[i]) / forecast$pred[i]
perf.se[i] = (x[nx+i] - forecast$pred[i])^2
prob.dec[i] = pnorm((x[nx+i-1] - forecast$pred[i]) / locSD)
prob.sdec[i] = pnorm((x[nx+i-par5] - forecast$pred[i]) / locSD)
prob.ldec[i] = pnorm((x[nx] - forecast$pred[i]) / locSD)
prob.pval[i] = pnorm(abs(x[nx+i] - forecast$pred[i]) / locSD)
}
perf.mape[1] = abs(perf.pe[1])
perf.mse[1] = abs(perf.se[1])
for (i in 2:fx) {
perf.mape[i] = perf.mape[i-1] + abs(perf.pe[i])
perf.mape1[i] = perf.mape[i] / i
perf.mse[i] = perf.mse[i-1] + perf.se[i]
perf.mse1[i] = perf.mse[i] / i
}
perf.rmse = sqrt(perf.mse1)
bitmap(file='test2.png')
plot(forecast$pred, pch=19, type='b',main='ARIMA Extrapolation Forecast', ylab='Forecast and 95% CI', xlab='time',ylim=c(min(lb),max(ub)))
dum <- forecast$pred
dum[1:par1] <- x[(nx+1):lx]
lines(dum, lty=1)
lines(ub,lty=3)
lines(lb,lty=3)
dev.off()
load(file='createtable')
a<-table.start()
a<-table.row.start(a)
a<-table.element(a,'Univariate ARIMA Extrapolation Forecast',9,TRUE)
a<-table.row.end(a)
a<-table.row.start(a)
a<-table.element(a,'time',1,header=TRUE)
a<-table.element(a,'Y[t]',1,header=TRUE)
a<-table.element(a,'F[t]',1,header=TRUE)
a<-table.element(a,'95% LB',1,header=TRUE)
a<-table.element(a,'95% UB',1,header=TRUE)
a<-table.element(a,'p-value
(H0: Y[t] = F[t])',1,header=TRUE)
a<-table.element(a,'P(F[t]>Y[t-1])',1,header=TRUE)
a<-table.element(a,'P(F[t]>Y[t-s])',1,header=TRUE)
mylab <- paste('P(F[t]>Y[',nx,sep='')
mylab <- paste(mylab,'])',sep='')
a<-table.element(a,mylab,1,header=TRUE)
a<-table.row.end(a)
for (i in (nx-par5):nx) {
a<-table.row.start(a)
a<-table.element(a,i,header=TRUE)
a<-table.element(a,x[i])
a<-table.element(a,'-')
a<-table.row.end(a)
}
for (i in 1:fx) {
a<-table.row.start(a)
a<-table.element(a,nx+i,header=TRUE)
a<-table.element(a,round(x[nx+i],4))
a<-table.element(a,round(forecast$pred[i],4))
a<-table.element(a,round(lb[i],4))
a<-table.element(a,round(ub[i],4))
a<-table.element(a,round((1-prob.pval[i]),4))
a<-table.element(a,round((1-prob.dec[i]),4))
a<-table.element(a,round((1-prob.sdec[i]),4))
a<-table.element(a,round((1-prob.ldec[i]),4))
a<-table.row.end(a)
}
a<-table.end(a)
table.save(a,file='mytable.tab')
a<-table.start()
a<-table.row.start(a)
a<-table.element(a,'Univariate ARIMA Extrapolation Forecast Performance',7,TRUE)
a<-table.row.end(a)
a<-table.row.start(a)
a<-table.element(a,'time',1,header=TRUE)
a<-table.element(a,'% S.E.',1,header=TRUE)
a<-table.element(a,'PE',1,header=TRUE)
a<-table.element(a,'MAPE',1,header=TRUE)
a<-table.element(a,'Sq.E',1,header=TRUE)
a<-table.element(a,'MSE',1,header=TRUE)
a<-table.element(a,'RMSE',1,header=TRUE)
a<-table.row.end(a)
for (i in 1:fx) {
a<-table.row.start(a)
a<-table.element(a,nx+i,header=TRUE)
a<-table.element(a,round(perc.se[i],4))
a<-table.element(a,round(perf.pe[i],4))
a<-table.element(a,round(perf.mape1[i],4))
a<-table.element(a,round(perf.se[i],4))
a<-table.element(a,round(perf.mse1[i],4))
a<-table.element(a,round(perf.rmse[i],4))
a<-table.row.end(a)
}
a<-table.end(a)
table.save(a,file='mytable1.tab')