Free Statistics

of Irreproducible Research!

Author's title

Author*The author of this computation has been verified*
R Software Modulerwasp_arimaforecasting.wasp
Title produced by softwareARIMA Forecasting
Date of computationFri, 11 Dec 2009 13:21:40 -0700
Cite this page as followsStatistical Computations at FreeStatistics.org, Office for Research Development and Education, URL https://freestatistics.org/blog/index.php?v=date/2009/Dec/11/t1260563103ujr501x1taqyizb.htm/, Retrieved Mon, 29 Apr 2024 01:39:57 +0000
Statistical Computations at FreeStatistics.org, Office for Research Development and Education, URL https://freestatistics.org/blog/index.php?pk=66761, Retrieved Mon, 29 Apr 2024 01:39:57 +0000
QR Codes:

Original text written by user:
IsPrivate?No (this computation is public)
User-defined keywords
Estimated Impact156
Family? (F = Feedback message, R = changed R code, M = changed R Module, P = changed Parameters, D = changed Data)
-     [ARIMA Forecasting] [] [2009-12-07 09:54:52] [b98453cac15ba1066b407e146608df68]
- R PD    [ARIMA Forecasting] [] [2009-12-11 20:21:40] [e76c6d261190c0179bc6006a5cdb804c] [Current]
Feedback Forum

Post a new message
Dataseries X:
17823.2
17872
17420.4
16704.4
15991.2
15583.6
19123.5
17838.7
17209.4
18586.5
16258.1
15141.6
19202.1
17746.5
19090.1
18040.3
17515.5
17751.8
21072.4
17170
19439.5
19795.4
17574.9
16165.4
19464.6
19932.1
19961.2
17343.4
18924.2
18574.1
21350.6
18594.6
19832.1
20844.4
19640.2
17735.4
19813.6
22160
20664.3
17877.4
20906.5
21164.1
21374.4
22952.3
21343.5
23899.3
22392.9
18274.1
22786.7
22321.5
17842.2
16373.5
15933.8
16446.1
17729
16643
16196.7
18252.1
17570.4
15836.8


Summary of computational transaction
Raw Inputview raw input (R code)
Raw Outputview raw output of R engine
Computing time1 seconds
R Server'Gwilym Jenkins' @ 72.249.127.135

\begin{tabular}{lllllllll}
\hline
Summary of computational transaction \tabularnewline
Raw Input & view raw input (R code)  \tabularnewline
Raw Output & view raw output of R engine  \tabularnewline
Computing time & 1 seconds \tabularnewline
R Server & 'Gwilym Jenkins' @ 72.249.127.135 \tabularnewline
\hline
\end{tabular}
%Source: https://freestatistics.org/blog/index.php?pk=66761&T=0

[TABLE]
[ROW][C]Summary of computational transaction[/C][/ROW]
[ROW][C]Raw Input[/C][C]view raw input (R code) [/C][/ROW]
[ROW][C]Raw Output[/C][C]view raw output of R engine [/C][/ROW]
[ROW][C]Computing time[/C][C]1 seconds[/C][/ROW]
[ROW][C]R Server[/C][C]'Gwilym Jenkins' @ 72.249.127.135[/C][/ROW]
[/TABLE]
Source: https://freestatistics.org/blog/index.php?pk=66761&T=0

Globally Unique Identifier (entire table): ba.freestatistics.org/blog/index.php?pk=66761&T=0

As an alternative you can also use a QR Code:  

The GUIDs for individual cells are displayed in the table below:

Summary of computational transaction
Raw Inputview raw input (R code)
Raw Outputview raw output of R engine
Computing time1 seconds
R Server'Gwilym Jenkins' @ 72.249.127.135


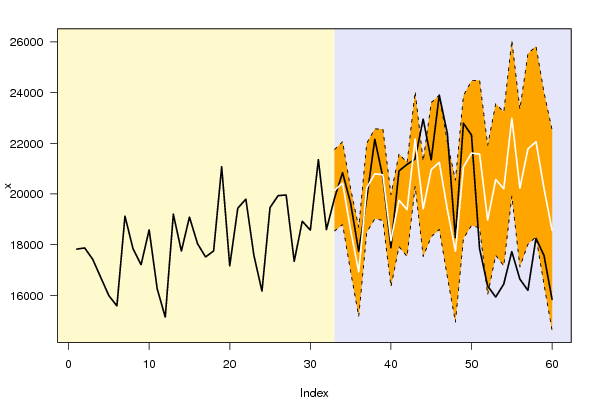
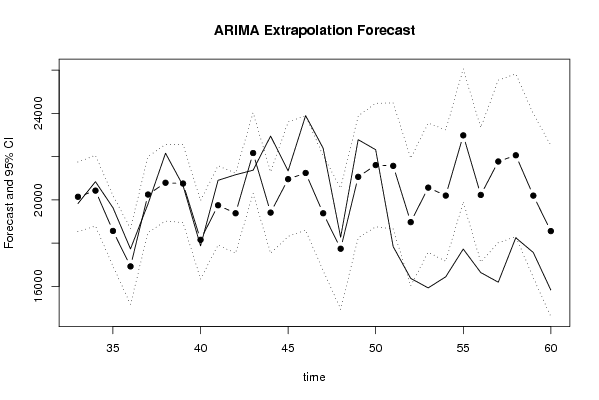
Univariate ARIMA Extrapolation Forecast
timeY[t]F[t]95% LB95% UBp-value(H0: Y[t] = F[t])P(F[t]>Y[t-1])P(F[t]>Y[t-s])P(F[t]>Y[32])
2017170-------
2119439.5-------
2219795.4-------
2317574.9-------
2416165.4-------
2519464.6-------
2619932.1-------
2719961.2-------
2817343.4-------
2918924.2-------
3018574.1-------
3121350.6-------
3218594.6-------
3319832.120145.435118538.254721752.61560.35120.97070.80540.9707
3420844.420430.235418795.676222064.79460.30970.76340.77670.9861
3519640.218566.012116930.795520201.22880.0990.00320.88260.4863
3617735.416927.16515170.674518683.65550.18360.00120.80230.0314
3719813.620249.809918492.16522007.45470.31330.99750.80940.9675
382216020794.454319023.562822565.34570.06530.86120.83010.9925
3920664.320757.406118953.341222561.4710.45970.06380.80650.9906
4017877.418156.602216342.67919970.52550.38140.00340.81020.318
4120906.519752.04817920.854121583.24180.10830.97760.81220.8923
4221164.119384.229617533.352721235.10650.02970.05350.80450.7985
4321374.422167.7420302.58124032.8990.20220.85420.80470.9999
4422952.319413.854917531.828621295.88131e-040.02060.80320.8032
4521343.520960.263418314.862223605.66460.38820.070.79840.9602
4623899.321247.447818601.474923893.42060.02470.47160.61740.9753
4722392.919383.288116729.544122037.03220.01314e-040.42480.7199
4818274.117743.41714944.522720542.31130.35516e-040.50220.2756
4922786.721066.787818250.766423882.80920.11560.9740.80850.9573
5022321.521611.318818757.260524465.37720.31290.20980.35320.9809
5117842.221574.056418659.240124488.87260.0060.30760.72960.9774
5216373.518973.456416026.184321920.72840.04190.77410.7670.5995
5315933.820568.840217579.673723558.00670.00120.9970.41240.9023
5416446.120200.983717167.471223234.49630.00760.99710.26690.8503
551772922984.547519913.617626055.47754e-0410.84790.9975
561664320230.638917119.420223341.85760.01190.94250.04320.8487
5716196.721777.042818019.689425534.39620.00180.99630.58950.9516
5818252.122064.240218301.954125826.52620.02350.99890.16950.9647
5917570.420200.072816410.903323989.24240.08690.84320.12830.7969
6015836.818560.20214604.052122516.35190.08860.68810.55640.4932

\begin{tabular}{lllllllll}
\hline
Univariate ARIMA Extrapolation Forecast \tabularnewline
time & Y[t] & F[t] & 95% LB & 95% UB & p-value(H0: Y[t] = F[t]) & P(F[t]>Y[t-1]) & P(F[t]>Y[t-s]) & P(F[t]>Y[32]) \tabularnewline
20 & 17170 & - & - & - & - & - & - & - \tabularnewline
21 & 19439.5 & - & - & - & - & - & - & - \tabularnewline
22 & 19795.4 & - & - & - & - & - & - & - \tabularnewline
23 & 17574.9 & - & - & - & - & - & - & - \tabularnewline
24 & 16165.4 & - & - & - & - & - & - & - \tabularnewline
25 & 19464.6 & - & - & - & - & - & - & - \tabularnewline
26 & 19932.1 & - & - & - & - & - & - & - \tabularnewline
27 & 19961.2 & - & - & - & - & - & - & - \tabularnewline
28 & 17343.4 & - & - & - & - & - & - & - \tabularnewline
29 & 18924.2 & - & - & - & - & - & - & - \tabularnewline
30 & 18574.1 & - & - & - & - & - & - & - \tabularnewline
31 & 21350.6 & - & - & - & - & - & - & - \tabularnewline
32 & 18594.6 & - & - & - & - & - & - & - \tabularnewline
33 & 19832.1 & 20145.4351 & 18538.2547 & 21752.6156 & 0.3512 & 0.9707 & 0.8054 & 0.9707 \tabularnewline
34 & 20844.4 & 20430.2354 & 18795.6762 & 22064.7946 & 0.3097 & 0.7634 & 0.7767 & 0.9861 \tabularnewline
35 & 19640.2 & 18566.0121 & 16930.7955 & 20201.2288 & 0.099 & 0.0032 & 0.8826 & 0.4863 \tabularnewline
36 & 17735.4 & 16927.165 & 15170.6745 & 18683.6555 & 0.1836 & 0.0012 & 0.8023 & 0.0314 \tabularnewline
37 & 19813.6 & 20249.8099 & 18492.165 & 22007.4547 & 0.3133 & 0.9975 & 0.8094 & 0.9675 \tabularnewline
38 & 22160 & 20794.4543 & 19023.5628 & 22565.3457 & 0.0653 & 0.8612 & 0.8301 & 0.9925 \tabularnewline
39 & 20664.3 & 20757.4061 & 18953.3412 & 22561.471 & 0.4597 & 0.0638 & 0.8065 & 0.9906 \tabularnewline
40 & 17877.4 & 18156.6022 & 16342.679 & 19970.5255 & 0.3814 & 0.0034 & 0.8102 & 0.318 \tabularnewline
41 & 20906.5 & 19752.048 & 17920.8541 & 21583.2418 & 0.1083 & 0.9776 & 0.8122 & 0.8923 \tabularnewline
42 & 21164.1 & 19384.2296 & 17533.3527 & 21235.1065 & 0.0297 & 0.0535 & 0.8045 & 0.7985 \tabularnewline
43 & 21374.4 & 22167.74 & 20302.581 & 24032.899 & 0.2022 & 0.8542 & 0.8047 & 0.9999 \tabularnewline
44 & 22952.3 & 19413.8549 & 17531.8286 & 21295.8813 & 1e-04 & 0.0206 & 0.8032 & 0.8032 \tabularnewline
45 & 21343.5 & 20960.2634 & 18314.8622 & 23605.6646 & 0.3882 & 0.07 & 0.7984 & 0.9602 \tabularnewline
46 & 23899.3 & 21247.4478 & 18601.4749 & 23893.4206 & 0.0247 & 0.4716 & 0.6174 & 0.9753 \tabularnewline
47 & 22392.9 & 19383.2881 & 16729.5441 & 22037.0322 & 0.0131 & 4e-04 & 0.4248 & 0.7199 \tabularnewline
48 & 18274.1 & 17743.417 & 14944.5227 & 20542.3113 & 0.3551 & 6e-04 & 0.5022 & 0.2756 \tabularnewline
49 & 22786.7 & 21066.7878 & 18250.7664 & 23882.8092 & 0.1156 & 0.974 & 0.8085 & 0.9573 \tabularnewline
50 & 22321.5 & 21611.3188 & 18757.2605 & 24465.3772 & 0.3129 & 0.2098 & 0.3532 & 0.9809 \tabularnewline
51 & 17842.2 & 21574.0564 & 18659.2401 & 24488.8726 & 0.006 & 0.3076 & 0.7296 & 0.9774 \tabularnewline
52 & 16373.5 & 18973.4564 & 16026.1843 & 21920.7284 & 0.0419 & 0.7741 & 0.767 & 0.5995 \tabularnewline
53 & 15933.8 & 20568.8402 & 17579.6737 & 23558.0067 & 0.0012 & 0.997 & 0.4124 & 0.9023 \tabularnewline
54 & 16446.1 & 20200.9837 & 17167.4712 & 23234.4963 & 0.0076 & 0.9971 & 0.2669 & 0.8503 \tabularnewline
55 & 17729 & 22984.5475 & 19913.6176 & 26055.4775 & 4e-04 & 1 & 0.8479 & 0.9975 \tabularnewline
56 & 16643 & 20230.6389 & 17119.4202 & 23341.8576 & 0.0119 & 0.9425 & 0.0432 & 0.8487 \tabularnewline
57 & 16196.7 & 21777.0428 & 18019.6894 & 25534.3962 & 0.0018 & 0.9963 & 0.5895 & 0.9516 \tabularnewline
58 & 18252.1 & 22064.2402 & 18301.9541 & 25826.5262 & 0.0235 & 0.9989 & 0.1695 & 0.9647 \tabularnewline
59 & 17570.4 & 20200.0728 & 16410.9033 & 23989.2424 & 0.0869 & 0.8432 & 0.1283 & 0.7969 \tabularnewline
60 & 15836.8 & 18560.202 & 14604.0521 & 22516.3519 & 0.0886 & 0.6881 & 0.5564 & 0.4932 \tabularnewline
\hline
\end{tabular}
%Source: https://freestatistics.org/blog/index.php?pk=66761&T=1

[TABLE]
[ROW][C]Univariate ARIMA Extrapolation Forecast[/C][/ROW]
[ROW][C]time[/C][C]Y[t][/C][C]F[t][/C][C]95% LB[/C][C]95% UB[/C][C]p-value(H0: Y[t] = F[t])[/C][C]P(F[t]>Y[t-1])[/C][C]P(F[t]>Y[t-s])[/C][C]P(F[t]>Y[32])[/C][/ROW]
[ROW][C]20[/C][C]17170[/C][C]-[/C][C]-[/C][C]-[/C][C]-[/C][C]-[/C][C]-[/C][C]-[/C][/ROW]
[ROW][C]21[/C][C]19439.5[/C][C]-[/C][C]-[/C][C]-[/C][C]-[/C][C]-[/C][C]-[/C][C]-[/C][/ROW]
[ROW][C]22[/C][C]19795.4[/C][C]-[/C][C]-[/C][C]-[/C][C]-[/C][C]-[/C][C]-[/C][C]-[/C][/ROW]
[ROW][C]23[/C][C]17574.9[/C][C]-[/C][C]-[/C][C]-[/C][C]-[/C][C]-[/C][C]-[/C][C]-[/C][/ROW]
[ROW][C]24[/C][C]16165.4[/C][C]-[/C][C]-[/C][C]-[/C][C]-[/C][C]-[/C][C]-[/C][C]-[/C][/ROW]
[ROW][C]25[/C][C]19464.6[/C][C]-[/C][C]-[/C][C]-[/C][C]-[/C][C]-[/C][C]-[/C][C]-[/C][/ROW]
[ROW][C]26[/C][C]19932.1[/C][C]-[/C][C]-[/C][C]-[/C][C]-[/C][C]-[/C][C]-[/C][C]-[/C][/ROW]
[ROW][C]27[/C][C]19961.2[/C][C]-[/C][C]-[/C][C]-[/C][C]-[/C][C]-[/C][C]-[/C][C]-[/C][/ROW]
[ROW][C]28[/C][C]17343.4[/C][C]-[/C][C]-[/C][C]-[/C][C]-[/C][C]-[/C][C]-[/C][C]-[/C][/ROW]
[ROW][C]29[/C][C]18924.2[/C][C]-[/C][C]-[/C][C]-[/C][C]-[/C][C]-[/C][C]-[/C][C]-[/C][/ROW]
[ROW][C]30[/C][C]18574.1[/C][C]-[/C][C]-[/C][C]-[/C][C]-[/C][C]-[/C][C]-[/C][C]-[/C][/ROW]
[ROW][C]31[/C][C]21350.6[/C][C]-[/C][C]-[/C][C]-[/C][C]-[/C][C]-[/C][C]-[/C][C]-[/C][/ROW]
[ROW][C]32[/C][C]18594.6[/C][C]-[/C][C]-[/C][C]-[/C][C]-[/C][C]-[/C][C]-[/C][C]-[/C][/ROW]
[ROW][C]33[/C][C]19832.1[/C][C]20145.4351[/C][C]18538.2547[/C][C]21752.6156[/C][C]0.3512[/C][C]0.9707[/C][C]0.8054[/C][C]0.9707[/C][/ROW]
[ROW][C]34[/C][C]20844.4[/C][C]20430.2354[/C][C]18795.6762[/C][C]22064.7946[/C][C]0.3097[/C][C]0.7634[/C][C]0.7767[/C][C]0.9861[/C][/ROW]
[ROW][C]35[/C][C]19640.2[/C][C]18566.0121[/C][C]16930.7955[/C][C]20201.2288[/C][C]0.099[/C][C]0.0032[/C][C]0.8826[/C][C]0.4863[/C][/ROW]
[ROW][C]36[/C][C]17735.4[/C][C]16927.165[/C][C]15170.6745[/C][C]18683.6555[/C][C]0.1836[/C][C]0.0012[/C][C]0.8023[/C][C]0.0314[/C][/ROW]
[ROW][C]37[/C][C]19813.6[/C][C]20249.8099[/C][C]18492.165[/C][C]22007.4547[/C][C]0.3133[/C][C]0.9975[/C][C]0.8094[/C][C]0.9675[/C][/ROW]
[ROW][C]38[/C][C]22160[/C][C]20794.4543[/C][C]19023.5628[/C][C]22565.3457[/C][C]0.0653[/C][C]0.8612[/C][C]0.8301[/C][C]0.9925[/C][/ROW]
[ROW][C]39[/C][C]20664.3[/C][C]20757.4061[/C][C]18953.3412[/C][C]22561.471[/C][C]0.4597[/C][C]0.0638[/C][C]0.8065[/C][C]0.9906[/C][/ROW]
[ROW][C]40[/C][C]17877.4[/C][C]18156.6022[/C][C]16342.679[/C][C]19970.5255[/C][C]0.3814[/C][C]0.0034[/C][C]0.8102[/C][C]0.318[/C][/ROW]
[ROW][C]41[/C][C]20906.5[/C][C]19752.048[/C][C]17920.8541[/C][C]21583.2418[/C][C]0.1083[/C][C]0.9776[/C][C]0.8122[/C][C]0.8923[/C][/ROW]
[ROW][C]42[/C][C]21164.1[/C][C]19384.2296[/C][C]17533.3527[/C][C]21235.1065[/C][C]0.0297[/C][C]0.0535[/C][C]0.8045[/C][C]0.7985[/C][/ROW]
[ROW][C]43[/C][C]21374.4[/C][C]22167.74[/C][C]20302.581[/C][C]24032.899[/C][C]0.2022[/C][C]0.8542[/C][C]0.8047[/C][C]0.9999[/C][/ROW]
[ROW][C]44[/C][C]22952.3[/C][C]19413.8549[/C][C]17531.8286[/C][C]21295.8813[/C][C]1e-04[/C][C]0.0206[/C][C]0.8032[/C][C]0.8032[/C][/ROW]
[ROW][C]45[/C][C]21343.5[/C][C]20960.2634[/C][C]18314.8622[/C][C]23605.6646[/C][C]0.3882[/C][C]0.07[/C][C]0.7984[/C][C]0.9602[/C][/ROW]
[ROW][C]46[/C][C]23899.3[/C][C]21247.4478[/C][C]18601.4749[/C][C]23893.4206[/C][C]0.0247[/C][C]0.4716[/C][C]0.6174[/C][C]0.9753[/C][/ROW]
[ROW][C]47[/C][C]22392.9[/C][C]19383.2881[/C][C]16729.5441[/C][C]22037.0322[/C][C]0.0131[/C][C]4e-04[/C][C]0.4248[/C][C]0.7199[/C][/ROW]
[ROW][C]48[/C][C]18274.1[/C][C]17743.417[/C][C]14944.5227[/C][C]20542.3113[/C][C]0.3551[/C][C]6e-04[/C][C]0.5022[/C][C]0.2756[/C][/ROW]
[ROW][C]49[/C][C]22786.7[/C][C]21066.7878[/C][C]18250.7664[/C][C]23882.8092[/C][C]0.1156[/C][C]0.974[/C][C]0.8085[/C][C]0.9573[/C][/ROW]
[ROW][C]50[/C][C]22321.5[/C][C]21611.3188[/C][C]18757.2605[/C][C]24465.3772[/C][C]0.3129[/C][C]0.2098[/C][C]0.3532[/C][C]0.9809[/C][/ROW]
[ROW][C]51[/C][C]17842.2[/C][C]21574.0564[/C][C]18659.2401[/C][C]24488.8726[/C][C]0.006[/C][C]0.3076[/C][C]0.7296[/C][C]0.9774[/C][/ROW]
[ROW][C]52[/C][C]16373.5[/C][C]18973.4564[/C][C]16026.1843[/C][C]21920.7284[/C][C]0.0419[/C][C]0.7741[/C][C]0.767[/C][C]0.5995[/C][/ROW]
[ROW][C]53[/C][C]15933.8[/C][C]20568.8402[/C][C]17579.6737[/C][C]23558.0067[/C][C]0.0012[/C][C]0.997[/C][C]0.4124[/C][C]0.9023[/C][/ROW]
[ROW][C]54[/C][C]16446.1[/C][C]20200.9837[/C][C]17167.4712[/C][C]23234.4963[/C][C]0.0076[/C][C]0.9971[/C][C]0.2669[/C][C]0.8503[/C][/ROW]
[ROW][C]55[/C][C]17729[/C][C]22984.5475[/C][C]19913.6176[/C][C]26055.4775[/C][C]4e-04[/C][C]1[/C][C]0.8479[/C][C]0.9975[/C][/ROW]
[ROW][C]56[/C][C]16643[/C][C]20230.6389[/C][C]17119.4202[/C][C]23341.8576[/C][C]0.0119[/C][C]0.9425[/C][C]0.0432[/C][C]0.8487[/C][/ROW]
[ROW][C]57[/C][C]16196.7[/C][C]21777.0428[/C][C]18019.6894[/C][C]25534.3962[/C][C]0.0018[/C][C]0.9963[/C][C]0.5895[/C][C]0.9516[/C][/ROW]
[ROW][C]58[/C][C]18252.1[/C][C]22064.2402[/C][C]18301.9541[/C][C]25826.5262[/C][C]0.0235[/C][C]0.9989[/C][C]0.1695[/C][C]0.9647[/C][/ROW]
[ROW][C]59[/C][C]17570.4[/C][C]20200.0728[/C][C]16410.9033[/C][C]23989.2424[/C][C]0.0869[/C][C]0.8432[/C][C]0.1283[/C][C]0.7969[/C][/ROW]
[ROW][C]60[/C][C]15836.8[/C][C]18560.202[/C][C]14604.0521[/C][C]22516.3519[/C][C]0.0886[/C][C]0.6881[/C][C]0.5564[/C][C]0.4932[/C][/ROW]
[/TABLE]
Source: https://freestatistics.org/blog/index.php?pk=66761&T=1

Globally Unique Identifier (entire table): ba.freestatistics.org/blog/index.php?pk=66761&T=1

As an alternative you can also use a QR Code:  

The GUIDs for individual cells are displayed in the table below:

Univariate ARIMA Extrapolation Forecast
timeY[t]F[t]95% LB95% UBp-value(H0: Y[t] = F[t])P(F[t]>Y[t-1])P(F[t]>Y[t-s])P(F[t]>Y[32])
2017170-------
2119439.5-------
2219795.4-------
2317574.9-------
2416165.4-------
2519464.6-------
2619932.1-------
2719961.2-------
2817343.4-------
2918924.2-------
3018574.1-------
3121350.6-------
3218594.6-------
3319832.120145.435118538.254721752.61560.35120.97070.80540.9707
3420844.420430.235418795.676222064.79460.30970.76340.77670.9861
3519640.218566.012116930.795520201.22880.0990.00320.88260.4863
3617735.416927.16515170.674518683.65550.18360.00120.80230.0314
3719813.620249.809918492.16522007.45470.31330.99750.80940.9675
382216020794.454319023.562822565.34570.06530.86120.83010.9925
3920664.320757.406118953.341222561.4710.45970.06380.80650.9906
4017877.418156.602216342.67919970.52550.38140.00340.81020.318
4120906.519752.04817920.854121583.24180.10830.97760.81220.8923
4221164.119384.229617533.352721235.10650.02970.05350.80450.7985
4321374.422167.7420302.58124032.8990.20220.85420.80470.9999
4422952.319413.854917531.828621295.88131e-040.02060.80320.8032
4521343.520960.263418314.862223605.66460.38820.070.79840.9602
4623899.321247.447818601.474923893.42060.02470.47160.61740.9753
4722392.919383.288116729.544122037.03220.01314e-040.42480.7199
4818274.117743.41714944.522720542.31130.35516e-040.50220.2756
4922786.721066.787818250.766423882.80920.11560.9740.80850.9573
5022321.521611.318818757.260524465.37720.31290.20980.35320.9809
5117842.221574.056418659.240124488.87260.0060.30760.72960.9774
5216373.518973.456416026.184321920.72840.04190.77410.7670.5995
5315933.820568.840217579.673723558.00670.00120.9970.41240.9023
5416446.120200.983717167.471223234.49630.00760.99710.26690.8503
551772922984.547519913.617626055.47754e-0410.84790.9975
561664320230.638917119.420223341.85760.01190.94250.04320.8487
5716196.721777.042818019.689425534.39620.00180.99630.58950.9516
5818252.122064.240218301.954125826.52620.02350.99890.16950.9647
5917570.420200.072816410.903323989.24240.08690.84320.12830.7969
6015836.818560.20214604.052122516.35190.08860.68810.55640.4932


Univariate ARIMA Extrapolation Forecast Performance
time% S.E.PEMAPESq.EMSERMSE
330.0407-0.0156098178.900500
340.04080.02030.0179171532.2999134855.6002367.2269
350.04490.05790.03121153879.6324474530.2776688.8616
360.05290.04770.0354653243.8603519208.6733720.5614
370.0443-0.02150.0326190279.0362453422.7459673.3667
380.04340.06570.03811864715.1503688638.1466829.8422
390.0443-0.00450.03338668.7459591499.6608769.0902
400.051-0.01540.031177953.8931527306.4398726.1587
410.04730.05840.03411332759.5169616801.2262785.3669
420.04870.09180.03993167938.6277871914.9663933.7639
430.0429-0.03580.0395629388.394849867.0961921.8824
440.04950.18230.051412520593.37371822427.61921349.9732
450.06440.01830.0489146870.29071693538.5941301.3603
460.06350.12480.05437032320.21462074880.13831440.4444
470.06990.15530.0619057763.54662540405.69891593.865
480.08050.02990.0591281624.45392399231.87111548.9454
490.06820.08160.06042958097.93762432106.34561559.5212
500.06740.03290.0589504357.26862325009.17461524.7981
510.0689-0.1730.064913926752.02532935627.21941713.3672
520.0793-0.1370.06856759773.18173126834.51751768.2858
530.0741-0.22530.075921483597.89264000966.10682000.2415
540.0766-0.18590.080914099151.93394459974.55352111.8652
550.0682-0.22870.087427620779.7975466966.08582338.1544
560.0785-0.17730.091112871152.8165775473.86622403.2216
570.088-0.25620.097731140225.45546790063.92982605.7751
580.087-0.17280.100614532412.61357087846.57152662.301
590.0957-0.13020.10176915179.25287081451.48562661.0997
600.1088-0.14670.10337416918.46857093432.44932663.3499

\begin{tabular}{lllllllll}
\hline
Univariate ARIMA Extrapolation Forecast Performance \tabularnewline
time & % S.E. & PE & MAPE & Sq.E & MSE & RMSE \tabularnewline
33 & 0.0407 & -0.0156 & 0 & 98178.9005 & 0 & 0 \tabularnewline
34 & 0.0408 & 0.0203 & 0.0179 & 171532.2999 & 134855.6002 & 367.2269 \tabularnewline
35 & 0.0449 & 0.0579 & 0.0312 & 1153879.6324 & 474530.2776 & 688.8616 \tabularnewline
36 & 0.0529 & 0.0477 & 0.0354 & 653243.8603 & 519208.6733 & 720.5614 \tabularnewline
37 & 0.0443 & -0.0215 & 0.0326 & 190279.0362 & 453422.7459 & 673.3667 \tabularnewline
38 & 0.0434 & 0.0657 & 0.0381 & 1864715.1503 & 688638.1466 & 829.8422 \tabularnewline
39 & 0.0443 & -0.0045 & 0.0333 & 8668.7459 & 591499.6608 & 769.0902 \tabularnewline
40 & 0.051 & -0.0154 & 0.0311 & 77953.8931 & 527306.4398 & 726.1587 \tabularnewline
41 & 0.0473 & 0.0584 & 0.0341 & 1332759.5169 & 616801.2262 & 785.3669 \tabularnewline
42 & 0.0487 & 0.0918 & 0.0399 & 3167938.6277 & 871914.9663 & 933.7639 \tabularnewline
43 & 0.0429 & -0.0358 & 0.0395 & 629388.394 & 849867.0961 & 921.8824 \tabularnewline
44 & 0.0495 & 0.1823 & 0.0514 & 12520593.3737 & 1822427.6192 & 1349.9732 \tabularnewline
45 & 0.0644 & 0.0183 & 0.0489 & 146870.2907 & 1693538.594 & 1301.3603 \tabularnewline
46 & 0.0635 & 0.1248 & 0.0543 & 7032320.2146 & 2074880.1383 & 1440.4444 \tabularnewline
47 & 0.0699 & 0.1553 & 0.061 & 9057763.5466 & 2540405.6989 & 1593.865 \tabularnewline
48 & 0.0805 & 0.0299 & 0.0591 & 281624.4539 & 2399231.8711 & 1548.9454 \tabularnewline
49 & 0.0682 & 0.0816 & 0.0604 & 2958097.9376 & 2432106.3456 & 1559.5212 \tabularnewline
50 & 0.0674 & 0.0329 & 0.0589 & 504357.2686 & 2325009.1746 & 1524.7981 \tabularnewline
51 & 0.0689 & -0.173 & 0.0649 & 13926752.0253 & 2935627.2194 & 1713.3672 \tabularnewline
52 & 0.0793 & -0.137 & 0.0685 & 6759773.1817 & 3126834.5175 & 1768.2858 \tabularnewline
53 & 0.0741 & -0.2253 & 0.0759 & 21483597.8926 & 4000966.1068 & 2000.2415 \tabularnewline
54 & 0.0766 & -0.1859 & 0.0809 & 14099151.9339 & 4459974.5535 & 2111.8652 \tabularnewline
55 & 0.0682 & -0.2287 & 0.0874 & 27620779.797 & 5466966.0858 & 2338.1544 \tabularnewline
56 & 0.0785 & -0.1773 & 0.0911 & 12871152.816 & 5775473.8662 & 2403.2216 \tabularnewline
57 & 0.088 & -0.2562 & 0.0977 & 31140225.4554 & 6790063.9298 & 2605.7751 \tabularnewline
58 & 0.087 & -0.1728 & 0.1006 & 14532412.6135 & 7087846.5715 & 2662.301 \tabularnewline
59 & 0.0957 & -0.1302 & 0.1017 & 6915179.2528 & 7081451.4856 & 2661.0997 \tabularnewline
60 & 0.1088 & -0.1467 & 0.1033 & 7416918.4685 & 7093432.4493 & 2663.3499 \tabularnewline
\hline
\end{tabular}
%Source: https://freestatistics.org/blog/index.php?pk=66761&T=2

[TABLE]
[ROW][C]Univariate ARIMA Extrapolation Forecast Performance[/C][/ROW]
[ROW][C]time[/C][C]% S.E.[/C][C]PE[/C][C]MAPE[/C][C]Sq.E[/C][C]MSE[/C][C]RMSE[/C][/ROW]
[ROW][C]33[/C][C]0.0407[/C][C]-0.0156[/C][C]0[/C][C]98178.9005[/C][C]0[/C][C]0[/C][/ROW]
[ROW][C]34[/C][C]0.0408[/C][C]0.0203[/C][C]0.0179[/C][C]171532.2999[/C][C]134855.6002[/C][C]367.2269[/C][/ROW]
[ROW][C]35[/C][C]0.0449[/C][C]0.0579[/C][C]0.0312[/C][C]1153879.6324[/C][C]474530.2776[/C][C]688.8616[/C][/ROW]
[ROW][C]36[/C][C]0.0529[/C][C]0.0477[/C][C]0.0354[/C][C]653243.8603[/C][C]519208.6733[/C][C]720.5614[/C][/ROW]
[ROW][C]37[/C][C]0.0443[/C][C]-0.0215[/C][C]0.0326[/C][C]190279.0362[/C][C]453422.7459[/C][C]673.3667[/C][/ROW]
[ROW][C]38[/C][C]0.0434[/C][C]0.0657[/C][C]0.0381[/C][C]1864715.1503[/C][C]688638.1466[/C][C]829.8422[/C][/ROW]
[ROW][C]39[/C][C]0.0443[/C][C]-0.0045[/C][C]0.0333[/C][C]8668.7459[/C][C]591499.6608[/C][C]769.0902[/C][/ROW]
[ROW][C]40[/C][C]0.051[/C][C]-0.0154[/C][C]0.0311[/C][C]77953.8931[/C][C]527306.4398[/C][C]726.1587[/C][/ROW]
[ROW][C]41[/C][C]0.0473[/C][C]0.0584[/C][C]0.0341[/C][C]1332759.5169[/C][C]616801.2262[/C][C]785.3669[/C][/ROW]
[ROW][C]42[/C][C]0.0487[/C][C]0.0918[/C][C]0.0399[/C][C]3167938.6277[/C][C]871914.9663[/C][C]933.7639[/C][/ROW]
[ROW][C]43[/C][C]0.0429[/C][C]-0.0358[/C][C]0.0395[/C][C]629388.394[/C][C]849867.0961[/C][C]921.8824[/C][/ROW]
[ROW][C]44[/C][C]0.0495[/C][C]0.1823[/C][C]0.0514[/C][C]12520593.3737[/C][C]1822427.6192[/C][C]1349.9732[/C][/ROW]
[ROW][C]45[/C][C]0.0644[/C][C]0.0183[/C][C]0.0489[/C][C]146870.2907[/C][C]1693538.594[/C][C]1301.3603[/C][/ROW]
[ROW][C]46[/C][C]0.0635[/C][C]0.1248[/C][C]0.0543[/C][C]7032320.2146[/C][C]2074880.1383[/C][C]1440.4444[/C][/ROW]
[ROW][C]47[/C][C]0.0699[/C][C]0.1553[/C][C]0.061[/C][C]9057763.5466[/C][C]2540405.6989[/C][C]1593.865[/C][/ROW]
[ROW][C]48[/C][C]0.0805[/C][C]0.0299[/C][C]0.0591[/C][C]281624.4539[/C][C]2399231.8711[/C][C]1548.9454[/C][/ROW]
[ROW][C]49[/C][C]0.0682[/C][C]0.0816[/C][C]0.0604[/C][C]2958097.9376[/C][C]2432106.3456[/C][C]1559.5212[/C][/ROW]
[ROW][C]50[/C][C]0.0674[/C][C]0.0329[/C][C]0.0589[/C][C]504357.2686[/C][C]2325009.1746[/C][C]1524.7981[/C][/ROW]
[ROW][C]51[/C][C]0.0689[/C][C]-0.173[/C][C]0.0649[/C][C]13926752.0253[/C][C]2935627.2194[/C][C]1713.3672[/C][/ROW]
[ROW][C]52[/C][C]0.0793[/C][C]-0.137[/C][C]0.0685[/C][C]6759773.1817[/C][C]3126834.5175[/C][C]1768.2858[/C][/ROW]
[ROW][C]53[/C][C]0.0741[/C][C]-0.2253[/C][C]0.0759[/C][C]21483597.8926[/C][C]4000966.1068[/C][C]2000.2415[/C][/ROW]
[ROW][C]54[/C][C]0.0766[/C][C]-0.1859[/C][C]0.0809[/C][C]14099151.9339[/C][C]4459974.5535[/C][C]2111.8652[/C][/ROW]
[ROW][C]55[/C][C]0.0682[/C][C]-0.2287[/C][C]0.0874[/C][C]27620779.797[/C][C]5466966.0858[/C][C]2338.1544[/C][/ROW]
[ROW][C]56[/C][C]0.0785[/C][C]-0.1773[/C][C]0.0911[/C][C]12871152.816[/C][C]5775473.8662[/C][C]2403.2216[/C][/ROW]
[ROW][C]57[/C][C]0.088[/C][C]-0.2562[/C][C]0.0977[/C][C]31140225.4554[/C][C]6790063.9298[/C][C]2605.7751[/C][/ROW]
[ROW][C]58[/C][C]0.087[/C][C]-0.1728[/C][C]0.1006[/C][C]14532412.6135[/C][C]7087846.5715[/C][C]2662.301[/C][/ROW]
[ROW][C]59[/C][C]0.0957[/C][C]-0.1302[/C][C]0.1017[/C][C]6915179.2528[/C][C]7081451.4856[/C][C]2661.0997[/C][/ROW]
[ROW][C]60[/C][C]0.1088[/C][C]-0.1467[/C][C]0.1033[/C][C]7416918.4685[/C][C]7093432.4493[/C][C]2663.3499[/C][/ROW]
[/TABLE]
Source: https://freestatistics.org/blog/index.php?pk=66761&T=2

Globally Unique Identifier (entire table): ba.freestatistics.org/blog/index.php?pk=66761&T=2

As an alternative you can also use a QR Code:  

The GUIDs for individual cells are displayed in the table below:

Univariate ARIMA Extrapolation Forecast Performance
time% S.E.PEMAPESq.EMSERMSE
330.0407-0.0156098178.900500
340.04080.02030.0179171532.2999134855.6002367.2269
350.04490.05790.03121153879.6324474530.2776688.8616
360.05290.04770.0354653243.8603519208.6733720.5614
370.0443-0.02150.0326190279.0362453422.7459673.3667
380.04340.06570.03811864715.1503688638.1466829.8422
390.0443-0.00450.03338668.7459591499.6608769.0902
400.051-0.01540.031177953.8931527306.4398726.1587
410.04730.05840.03411332759.5169616801.2262785.3669
420.04870.09180.03993167938.6277871914.9663933.7639
430.0429-0.03580.0395629388.394849867.0961921.8824
440.04950.18230.051412520593.37371822427.61921349.9732
450.06440.01830.0489146870.29071693538.5941301.3603
460.06350.12480.05437032320.21462074880.13831440.4444
470.06990.15530.0619057763.54662540405.69891593.865
480.08050.02990.0591281624.45392399231.87111548.9454
490.06820.08160.06042958097.93762432106.34561559.5212
500.06740.03290.0589504357.26862325009.17461524.7981
510.0689-0.1730.064913926752.02532935627.21941713.3672
520.0793-0.1370.06856759773.18173126834.51751768.2858
530.0741-0.22530.075921483597.89264000966.10682000.2415
540.0766-0.18590.080914099151.93394459974.55352111.8652
550.0682-0.22870.087427620779.7975466966.08582338.1544
560.0785-0.17730.091112871152.8165775473.86622403.2216
570.088-0.25620.097731140225.45546790063.92982605.7751
580.087-0.17280.100614532412.61357087846.57152662.301
590.0957-0.13020.10176915179.25287081451.48562661.0997
600.1088-0.14670.10337416918.46857093432.44932663.3499


Parameters (Session):
par1 = 24 ; par2 = 1 ; par3 = 1 ; par4 = 1 ; par5 = 12 ; par6 = 3 ; par7 = 0 ; par8 = 0 ; par9 = 0 ; par10 = FALSE ;
Parameters (R input):
par1 = 24 ; par2 = 1 ; par3 = 1 ; par4 = 1 ; par5 = 12 ; par6 = 3 ; par7 = 0 ; par8 = 0 ; par9 = 0 ; par10 = FALSE ;
R code (references can be found in the software module):
par1 <- as.numeric(par1) #cut off periods
par1 <- 28
par2 <- as.numeric(par2) #lambda
par3 <- as.numeric(par3) #degree of non-seasonal differencing
par4 <- as.numeric(par4) #degree of seasonal differencing
par5 <- as.numeric(par5) #seasonal period
par6 <- as.numeric(par6) #p
par6 <- 3
par7 <- as.numeric(par7) #q
par7 <- 3
par8 <- as.numeric(par8) #P
par9 <- as.numeric(par9) #Q
if (par10 == 'TRUE') par10 <- TRUE
if (par10 == 'FALSE') par10 <- FALSE
if (par2 == 0) x <- log(x)
if (par2 != 0) x <- x^par2
lx <- length(x)
first <- lx - 2*par1
nx <- lx - par1
nx1 <- nx + 1
fx <- lx - nx
if (fx < 1) {
fx <- par5
nx1 <- lx + fx - 1
first <- lx - 2*fx
}
first <- 1
if (fx < 3) fx <- round(lx/10,0)
(arima.out <- arima(x[1:nx], order=c(par6,par3,par7), seasonal=list(order=c(par8,par4,par9), period=par5), include.mean=par10, method='ML'))
(forecast <- predict(arima.out,par1))
(lb <- forecast$pred - 1.96 * forecast$se)
(ub <- forecast$pred + 1.96 * forecast$se)
if (par2 == 0) {
x <- exp(x)
forecast$pred <- exp(forecast$pred)
lb <- exp(lb)
ub <- exp(ub)
}
if (par2 != 0) {
x <- x^(1/par2)
forecast$pred <- forecast$pred^(1/par2)
lb <- lb^(1/par2)
ub <- ub^(1/par2)
}
if (par2 < 0) {
olb <- lb
lb <- ub
ub <- olb
}
(actandfor <- c(x[1:nx], forecast$pred))
(perc.se <- (ub-forecast$pred)/1.96/forecast$pred)
bitmap(file='test1.png')
opar <- par(mar=c(4,4,2,2),las=1)
ylim <- c( min(x[first:nx],lb), max(x[first:nx],ub))
plot(x,ylim=ylim,type='n',xlim=c(first,lx))
usr <- par('usr')
rect(usr[1],usr[3],nx+1,usr[4],border=NA,col='lemonchiffon')
rect(nx1,usr[3],usr[2],usr[4],border=NA,col='lavender')
abline(h= (-3:3)*2 , col ='gray', lty =3)
polygon( c(nx1:lx,lx:nx1), c(lb,rev(ub)), col = 'orange', lty=2,border=NA)
lines(nx1:lx, lb , lty=2)
lines(nx1:lx, ub , lty=2)
lines(x, lwd=2)
lines(nx1:lx, forecast$pred , lwd=2 , col ='white')
box()
par(opar)
dev.off()
prob.dec <- array(NA, dim=fx)
prob.sdec <- array(NA, dim=fx)
prob.ldec <- array(NA, dim=fx)
prob.pval <- array(NA, dim=fx)
perf.pe <- array(0, dim=fx)
perf.mape <- array(0, dim=fx)
perf.mape1 <- array(0, dim=fx)
perf.se <- array(0, dim=fx)
perf.mse <- array(0, dim=fx)
perf.mse1 <- array(0, dim=fx)
perf.rmse <- array(0, dim=fx)
for (i in 1:fx) {
locSD <- (ub[i] - forecast$pred[i]) / 1.96
perf.pe[i] = (x[nx+i] - forecast$pred[i]) / forecast$pred[i]
perf.se[i] = (x[nx+i] - forecast$pred[i])^2
prob.dec[i] = pnorm((x[nx+i-1] - forecast$pred[i]) / locSD)
prob.sdec[i] = pnorm((x[nx+i-par5] - forecast$pred[i]) / locSD)
prob.ldec[i] = pnorm((x[nx] - forecast$pred[i]) / locSD)
prob.pval[i] = pnorm(abs(x[nx+i] - forecast$pred[i]) / locSD)
}
perf.mape[1] = abs(perf.pe[1])
perf.mse[1] = abs(perf.se[1])
for (i in 2:fx) {
perf.mape[i] = perf.mape[i-1] + abs(perf.pe[i])
perf.mape1[i] = perf.mape[i] / i
perf.mse[i] = perf.mse[i-1] + perf.se[i]
perf.mse1[i] = perf.mse[i] / i
}
perf.rmse = sqrt(perf.mse1)
bitmap(file='test2.png')
plot(forecast$pred, pch=19, type='b',main='ARIMA Extrapolation Forecast', ylab='Forecast and 95% CI', xlab='time',ylim=c(min(lb),max(ub)))
dum <- forecast$pred
dum[1:par1] <- x[(nx+1):lx]
lines(dum, lty=1)
lines(ub,lty=3)
lines(lb,lty=3)
dev.off()
load(file='createtable')
a<-table.start()
a<-table.row.start(a)
a<-table.element(a,'Univariate ARIMA Extrapolation Forecast',9,TRUE)
a<-table.row.end(a)
a<-table.row.start(a)
a<-table.element(a,'time',1,header=TRUE)
a<-table.element(a,'Y[t]',1,header=TRUE)
a<-table.element(a,'F[t]',1,header=TRUE)
a<-table.element(a,'95% LB',1,header=TRUE)
a<-table.element(a,'95% UB',1,header=TRUE)
a<-table.element(a,'p-value
(H0: Y[t] = F[t])',1,header=TRUE)
a<-table.element(a,'P(F[t]>Y[t-1])',1,header=TRUE)
a<-table.element(a,'P(F[t]>Y[t-s])',1,header=TRUE)
mylab <- paste('P(F[t]>Y[',nx,sep='')
mylab <- paste(mylab,'])',sep='')
a<-table.element(a,mylab,1,header=TRUE)
a<-table.row.end(a)
for (i in (nx-par5):nx) {
a<-table.row.start(a)
a<-table.element(a,i,header=TRUE)
a<-table.element(a,x[i])
a<-table.element(a,'-')
a<-table.row.end(a)
}
for (i in 1:fx) {
a<-table.row.start(a)
a<-table.element(a,nx+i,header=TRUE)
a<-table.element(a,round(x[nx+i],4))
a<-table.element(a,round(forecast$pred[i],4))
a<-table.element(a,round(lb[i],4))
a<-table.element(a,round(ub[i],4))
a<-table.element(a,round((1-prob.pval[i]),4))
a<-table.element(a,round((1-prob.dec[i]),4))
a<-table.element(a,round((1-prob.sdec[i]),4))
a<-table.element(a,round((1-prob.ldec[i]),4))
a<-table.row.end(a)
}
a<-table.end(a)
table.save(a,file='mytable.tab')
a<-table.start()
a<-table.row.start(a)
a<-table.element(a,'Univariate ARIMA Extrapolation Forecast Performance',7,TRUE)
a<-table.row.end(a)
a<-table.row.start(a)
a<-table.element(a,'time',1,header=TRUE)
a<-table.element(a,'% S.E.',1,header=TRUE)
a<-table.element(a,'PE',1,header=TRUE)
a<-table.element(a,'MAPE',1,header=TRUE)
a<-table.element(a,'Sq.E',1,header=TRUE)
a<-table.element(a,'MSE',1,header=TRUE)
a<-table.element(a,'RMSE',1,header=TRUE)
a<-table.row.end(a)
for (i in 1:fx) {
a<-table.row.start(a)
a<-table.element(a,nx+i,header=TRUE)
a<-table.element(a,round(perc.se[i],4))
a<-table.element(a,round(perf.pe[i],4))
a<-table.element(a,round(perf.mape1[i],4))
a<-table.element(a,round(perf.se[i],4))
a<-table.element(a,round(perf.mse1[i],4))
a<-table.element(a,round(perf.rmse[i],4))
a<-table.row.end(a)
}
a<-table.end(a)
table.save(a,file='mytable1.tab')