Free Statistics

of Irreproducible Research!

Author's title

Author*The author of this computation has been verified*
R Software Modulerwasp_grangercausality.wasp
Title produced by softwareBivariate Granger Causality
Date of computationFri, 11 Dec 2009 13:13:19 -0700
Cite this page as followsStatistical Computations at FreeStatistics.org, Office for Research Development and Education, URL https://freestatistics.org/blog/index.php?v=date/2009/Dec/11/t1260562449cviv0pt47swqmbu.htm/, Retrieved Sun, 28 Apr 2024 19:01:21 +0000
Statistical Computations at FreeStatistics.org, Office for Research Development and Education, URL https://freestatistics.org/blog/index.php?pk=66750, Retrieved Sun, 28 Apr 2024 19:01:21 +0000
QR Codes:

Original text written by user:
IsPrivate?No (this computation is public)
User-defined keywordsWS 10
Estimated Impact154
Family? (F = Feedback message, R = changed R code, M = changed R Module, P = changed Parameters, D = changed Data)
-     [Bivariate Granger Causality] [] [2009-12-07 08:56:28] [b98453cac15ba1066b407e146608df68]
-    D  [Bivariate Granger Causality] [WS10, granger K6] [2009-12-10 20:41:08] [5c968c05ca472afa314d272082b56b09]
F    D      [Bivariate Granger Causality] [Workshop 10] [2009-12-11 20:13:19] [e2f800c9186517d2e5c4a809848912a7] [Current]
Feedback Forum
2009-12-16 13:23:41 [Brecht Thijs] [reply
In verband met de interpretatie van je Ho en Ha heb ik twijfel.
Uit de les heb ik begrepen dat: Ho=geen invloed in deze richting
en Ha is wel een invloed in deze bepaalde richting.
Met andere woorden: Het al dan niet verwerpen van Ho (en dus het
al dan niet bestaan van causaal verband) wordt per tabel
onafhankelijk bepaald.

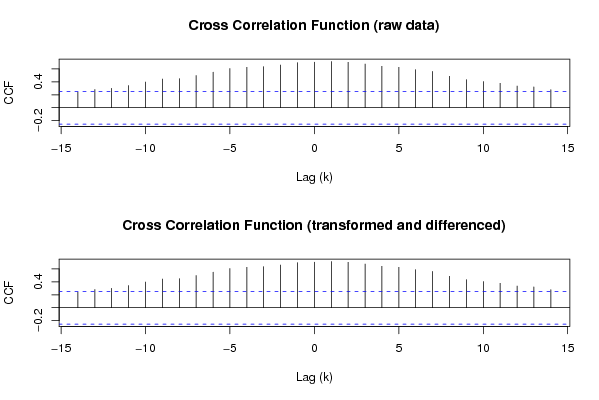
De conclusie hier is dan dat er een causaal verband bestaat tussen X en Y
met name X bepaalt mee Y (Y=f(X)). Omgekeerd niet. Dit is ook jouw
conclusie maar de 'weg' ernaartoe verschilt.

Post a new message
Dataseries X:
14.3
14.2
15.9
15.3
15.5
15.1
15
12.1
15.8
16.9
15.1
13.7
14.8
14.7
16
15.4
15
15.5
15.1
11.7
16.3
16.7
15
14.9
14.6
15.3
17.9
16.4
15.4
17.9
15.9
13.9
17.8
17.9
17.4
16.7
16
16.6
19.1
17.8
17.2
18.6
16.3
15.1
19.2
17.7
19.1
18
17.5
17.8
21.1
17.2
19.4
19.8
17.6
16.2
19.5
19.9
20
17.3
Dataseries Y:
15.89
16.93
20.28
22.52
23.51
22.59
23.51
24.76
26.08
25.29
23.38
25.29
28.42
31.85
30.1
25.45
24.95
26.84
27.52
27.94
25.23
26.53
27.21
28.53
30.35
31.21
32.86
33.2
35.73
34.53
36.54
40.1
40.56
46.14
42.85
38.22
40.18
42.19
47.56
47.26
44.03
49.83
53.35
58.9
59.64
56.99
53.2
53.24
57.85
55.69
55.64
62.52
64.4
64.65
67.71
67.21
59.37
53.26
52.42
55.03


Summary of computational transaction
Raw Inputview raw input (R code)
Raw Outputview raw output of R engine
Computing time1 seconds
R Server'Gwilym Jenkins' @ 72.249.127.135

\begin{tabular}{lllllllll}
\hline
Summary of computational transaction \tabularnewline
Raw Input & view raw input (R code)  \tabularnewline
Raw Output & view raw output of R engine  \tabularnewline
Computing time & 1 seconds \tabularnewline
R Server & 'Gwilym Jenkins' @ 72.249.127.135 \tabularnewline
\hline
\end{tabular}
%Source: https://freestatistics.org/blog/index.php?pk=66750&T=0

[TABLE]
[ROW][C]Summary of computational transaction[/C][/ROW]
[ROW][C]Raw Input[/C][C]view raw input (R code) [/C][/ROW]
[ROW][C]Raw Output[/C][C]view raw output of R engine [/C][/ROW]
[ROW][C]Computing time[/C][C]1 seconds[/C][/ROW]
[ROW][C]R Server[/C][C]'Gwilym Jenkins' @ 72.249.127.135[/C][/ROW]
[/TABLE]
Source: https://freestatistics.org/blog/index.php?pk=66750&T=0

Globally Unique Identifier (entire table): ba.freestatistics.org/blog/index.php?pk=66750&T=0

As an alternative you can also use a QR Code:  

The GUIDs for individual cells are displayed in the table below:

Summary of computational transaction
Raw Inputview raw input (R code)
Raw Outputview raw output of R engine
Computing time1 seconds
R Server'Gwilym Jenkins' @ 72.249.127.135


Granger Causality Test: Y = f(X)
ModelRes.DFDiff. DFFp-value
Complete model41
Reduced model47-63.402928578863440.0081193016742717

\begin{tabular}{lllllllll}
\hline
Granger Causality Test: Y = f(X) \tabularnewline
Model & Res.DF & Diff. DF & F & p-value \tabularnewline
Complete model & 41 &  &  &  \tabularnewline
Reduced model & 47 & -6 & 3.40292857886344 & 0.0081193016742717 \tabularnewline
\hline
\end{tabular}
%Source: https://freestatistics.org/blog/index.php?pk=66750&T=1

[TABLE]
[ROW][C]Granger Causality Test: Y = f(X)[/C][/ROW]
[ROW][C]Model[/C][C]Res.DF[/C][C]Diff. DF[/C][C]F[/C][C]p-value[/C][/ROW]
[ROW][C]Complete model[/C][C]41[/C][C][/C][C][/C][C][/C][/ROW]
[ROW][C]Reduced model[/C][C]47[/C][C]-6[/C][C]3.40292857886344[/C][C]0.0081193016742717[/C][/ROW]
[/TABLE]
Source: https://freestatistics.org/blog/index.php?pk=66750&T=1

Globally Unique Identifier (entire table): ba.freestatistics.org/blog/index.php?pk=66750&T=1

As an alternative you can also use a QR Code:  

The GUIDs for individual cells are displayed in the table below:

Granger Causality Test: Y = f(X)
ModelRes.DFDiff. DFFp-value
Complete model41
Reduced model47-63.402928578863440.0081193016742717


Granger Causality Test: X = f(Y)
ModelRes.DFDiff. DFFp-value
Complete model41
Reduced model47-60.8616284431580130.531008084632643

\begin{tabular}{lllllllll}
\hline
Granger Causality Test: X = f(Y) \tabularnewline
Model & Res.DF & Diff. DF & F & p-value \tabularnewline
Complete model & 41 &  &  &  \tabularnewline
Reduced model & 47 & -6 & 0.861628443158013 & 0.531008084632643 \tabularnewline
\hline
\end{tabular}
%Source: https://freestatistics.org/blog/index.php?pk=66750&T=2

[TABLE]
[ROW][C]Granger Causality Test: X = f(Y)[/C][/ROW]
[ROW][C]Model[/C][C]Res.DF[/C][C]Diff. DF[/C][C]F[/C][C]p-value[/C][/ROW]
[ROW][C]Complete model[/C][C]41[/C][C][/C][C][/C][C][/C][/ROW]
[ROW][C]Reduced model[/C][C]47[/C][C]-6[/C][C]0.861628443158013[/C][C]0.531008084632643[/C][/ROW]
[/TABLE]
Source: https://freestatistics.org/blog/index.php?pk=66750&T=2

Globally Unique Identifier (entire table): ba.freestatistics.org/blog/index.php?pk=66750&T=2

As an alternative you can also use a QR Code:  

The GUIDs for individual cells are displayed in the table below:

Granger Causality Test: X = f(Y)
ModelRes.DFDiff. DFFp-value
Complete model41
Reduced model47-60.8616284431580130.531008084632643


Parameters (Session):
par1 = 1 ; par2 = 0 ; par3 = 0 ; par4 = 12 ; par5 = 1 ; par6 = 0 ; par7 = 0 ; par8 = 6 ;
Parameters (R input):
par1 = 1 ; par2 = 0 ; par3 = 0 ; par4 = 12 ; par5 = 1 ; par6 = 0 ; par7 = 0 ; par8 = 6 ;
R code (references can be found in the software module):
library(lmtest)
par1 <- as.numeric(par1)
par2 <- as.numeric(par2)
par3 <- as.numeric(par3)
par4 <- as.numeric(par4)
par5 <- as.numeric(par5)
par6 <- as.numeric(par6)
par7 <- as.numeric(par7)
par8 <- as.numeric(par8)
ox <- x
oy <- y
if (par1 == 0) {
x <- log(x)
} else {
x <- (x ^ par1 - 1) / par1
}
if (par5 == 0) {
y <- log(y)
} else {
y <- (y ^ par5 - 1) / par5
}
if (par2 > 0) x <- diff(x,lag=1,difference=par2)
if (par6 > 0) y <- diff(y,lag=1,difference=par6)
if (par3 > 0) x <- diff(x,lag=par4,difference=par3)
if (par7 > 0) y <- diff(y,lag=par4,difference=par7)
x
y
(gyx <- grangertest(y ~ x, order=par8))
(gxy <- grangertest(x ~ y, order=par8))
bitmap(file='test1.png')
op <- par(mfrow=c(2,1))
(r <- ccf(ox,oy,main='Cross Correlation Function (raw data)',ylab='CCF',xlab='Lag (k)'))
(r <- ccf(x,y,main='Cross Correlation Function (transformed and differenced)',ylab='CCF',xlab='Lag (k)'))
par(op)
dev.off()
bitmap(file='test2.png')
op <- par(mfrow=c(2,1))
acf(ox,lag.max=round(length(x)/2),main='ACF of x (raw)')
acf(x,lag.max=round(length(x)/2),main='ACF of x (transformed and differenced)')
par(op)
dev.off()
bitmap(file='test3.png')
op <- par(mfrow=c(2,1))
acf(oy,lag.max=round(length(y)/2),main='ACF of y (raw)')
acf(y,lag.max=round(length(y)/2),main='ACF of y (transformed and differenced)')
par(op)
dev.off()
load(file='createtable')
a<-table.start()
a<-table.row.start(a)
a<-table.element(a,'Granger Causality Test: Y = f(X)',5,TRUE)
a<-table.row.end(a)
a<-table.row.start(a)
a<-table.element(a,'Model',header=TRUE)
a<-table.element(a,'Res.DF',header=TRUE)
a<-table.element(a,'Diff. DF',header=TRUE)
a<-table.element(a,'F',header=TRUE)
a<-table.element(a,'p-value',header=TRUE)
a<-table.row.end(a)
a<-table.row.start(a)
a<-table.element(a,'Complete model',header=TRUE)
a<-table.element(a,gyx$Res.Df[1])
a<-table.element(a,'')
a<-table.row.end(a)
a<-table.row.start(a)
a<-table.element(a,'Reduced model',header=TRUE)
a<-table.element(a,gyx$Res.Df[2])
a<-table.element(a,gyx$Df[2])
a<-table.element(a,gyx$F[2])
a<-table.element(a,gyx$Pr[2])
a<-table.row.end(a)
a<-table.end(a)
table.save(a,file='mytable1.tab')
a<-table.start()
a<-table.row.start(a)
a<-table.element(a,'Granger Causality Test: X = f(Y)',5,TRUE)
a<-table.row.end(a)
a<-table.row.start(a)
a<-table.element(a,'Model',header=TRUE)
a<-table.element(a,'Res.DF',header=TRUE)
a<-table.element(a,'Diff. DF',header=TRUE)
a<-table.element(a,'F',header=TRUE)
a<-table.element(a,'p-value',header=TRUE)
a<-table.row.end(a)
a<-table.row.start(a)
a<-table.element(a,'Complete model',header=TRUE)
a<-table.element(a,gxy$Res.Df[1])
a<-table.element(a,'')
a<-table.row.end(a)
a<-table.row.start(a)
a<-table.element(a,'Reduced model',header=TRUE)
a<-table.element(a,gxy$Res.Df[2])
a<-table.element(a,gxy$Df[2])
a<-table.element(a,gxy$F[2])
a<-table.element(a,gxy$Pr[2])
a<-table.row.end(a)
a<-table.end(a)
table.save(a,file='mytable2.tab')