Free Statistics

of Irreproducible Research!

Author's title

Author*The author of this computation has been verified*
R Software Modulerwasp_grangercausality.wasp
Title produced by softwareBivariate Granger Causality
Date of computationFri, 11 Dec 2009 12:56:59 -0700
Cite this page as followsStatistical Computations at FreeStatistics.org, Office for Research Development and Education, URL https://freestatistics.org/blog/index.php?v=date/2009/Dec/11/t1260561495mhgpbwegp5vqw6d.htm/, Retrieved Sun, 28 Apr 2024 21:59:12 +0000
Statistical Computations at FreeStatistics.org, Office for Research Development and Education, URL https://freestatistics.org/blog/index.php?pk=66733, Retrieved Sun, 28 Apr 2024 21:59:12 +0000
QR Codes:

Original text written by user:
IsPrivate?No (this computation is public)
User-defined keywords
Estimated Impact113
Family? (F = Feedback message, R = changed R code, M = changed R Module, P = changed Parameters, D = changed Data)
-     [Bivariate Granger Causality] [] [2009-12-07 08:57:35] [b98453cac15ba1066b407e146608df68]
-    D    [Bivariate Granger Causality] [] [2009-12-11 19:56:59] [c88a5f1b97e332c6387d668c465455af] [Current]
Feedback Forum

Post a new message
Dataseries X:
280
557
831
1081
1318
1578
1859
2141
2428
2715
3004
3309
269
537
813
1068
1411
1675
1958
2242
2524
2836
3143
3522
285
574
865
1147
1516
1789
2087
2372
2669
2966
3270
3652
329
658
988
1303
1603
1929
2235
2544
2872
3198
3544
3903
332
665
1001
1329
1639
1975
2304
2640
2992
3330
3690
4063
Dataseries Y:
47
55
55
51
55
58
49
52
52
57
61
61
32
43
54
81
72
69
30
53
57
64
71
65
59
68
70
75
74
68
62
56
55
74
58
72
63
68
55
71
79
74
75
69
63
88
68
89
63
74
63
79
80
77
96
88
56
74
82
69


Summary of computational transaction
Raw Inputview raw input (R code)
Raw Outputview raw output of R engine
Computing time1 seconds
R Server'Gwilym Jenkins' @ 72.249.127.135

\begin{tabular}{lllllllll}
\hline
Summary of computational transaction \tabularnewline
Raw Input & view raw input (R code)  \tabularnewline
Raw Output & view raw output of R engine  \tabularnewline
Computing time & 1 seconds \tabularnewline
R Server & 'Gwilym Jenkins' @ 72.249.127.135 \tabularnewline
\hline
\end{tabular}
%Source: https://freestatistics.org/blog/index.php?pk=66733&T=0

[TABLE]
[ROW][C]Summary of computational transaction[/C][/ROW]
[ROW][C]Raw Input[/C][C]view raw input (R code) [/C][/ROW]
[ROW][C]Raw Output[/C][C]view raw output of R engine [/C][/ROW]
[ROW][C]Computing time[/C][C]1 seconds[/C][/ROW]
[ROW][C]R Server[/C][C]'Gwilym Jenkins' @ 72.249.127.135[/C][/ROW]
[/TABLE]
Source: https://freestatistics.org/blog/index.php?pk=66733&T=0

Globally Unique Identifier (entire table): ba.freestatistics.org/blog/index.php?pk=66733&T=0

As an alternative you can also use a QR Code:  

The GUIDs for individual cells are displayed in the table below:

Summary of computational transaction
Raw Inputview raw input (R code)
Raw Outputview raw output of R engine
Computing time1 seconds
R Server'Gwilym Jenkins' @ 72.249.127.135


Granger Causality Test: Y = f(X)
ModelRes.DFDiff. DFFp-value
Complete model26
Reduced model37-110.788146826421060.649600464305736

\begin{tabular}{lllllllll}
\hline
Granger Causality Test: Y = f(X) \tabularnewline
Model & Res.DF & Diff. DF & F & p-value \tabularnewline
Complete model & 26 &  &  &  \tabularnewline
Reduced model & 37 & -11 & 0.78814682642106 & 0.649600464305736 \tabularnewline
\hline
\end{tabular}
%Source: https://freestatistics.org/blog/index.php?pk=66733&T=1

[TABLE]
[ROW][C]Granger Causality Test: Y = f(X)[/C][/ROW]
[ROW][C]Model[/C][C]Res.DF[/C][C]Diff. DF[/C][C]F[/C][C]p-value[/C][/ROW]
[ROW][C]Complete model[/C][C]26[/C][C][/C][C][/C][C][/C][/ROW]
[ROW][C]Reduced model[/C][C]37[/C][C]-11[/C][C]0.78814682642106[/C][C]0.649600464305736[/C][/ROW]
[/TABLE]
Source: https://freestatistics.org/blog/index.php?pk=66733&T=1

Globally Unique Identifier (entire table): ba.freestatistics.org/blog/index.php?pk=66733&T=1

As an alternative you can also use a QR Code:  

The GUIDs for individual cells are displayed in the table below:

Granger Causality Test: Y = f(X)
ModelRes.DFDiff. DFFp-value
Complete model26
Reduced model37-110.788146826421060.649600464305736


Granger Causality Test: X = f(Y)
ModelRes.DFDiff. DFFp-value
Complete model26
Reduced model37-118.444597389257934.34361298396355e-06

\begin{tabular}{lllllllll}
\hline
Granger Causality Test: X = f(Y) \tabularnewline
Model & Res.DF & Diff. DF & F & p-value \tabularnewline
Complete model & 26 &  &  &  \tabularnewline
Reduced model & 37 & -11 & 8.44459738925793 & 4.34361298396355e-06 \tabularnewline
\hline
\end{tabular}
%Source: https://freestatistics.org/blog/index.php?pk=66733&T=2

[TABLE]
[ROW][C]Granger Causality Test: X = f(Y)[/C][/ROW]
[ROW][C]Model[/C][C]Res.DF[/C][C]Diff. DF[/C][C]F[/C][C]p-value[/C][/ROW]
[ROW][C]Complete model[/C][C]26[/C][C][/C][C][/C][C][/C][/ROW]
[ROW][C]Reduced model[/C][C]37[/C][C]-11[/C][C]8.44459738925793[/C][C]4.34361298396355e-06[/C][/ROW]
[/TABLE]
Source: https://freestatistics.org/blog/index.php?pk=66733&T=2

Globally Unique Identifier (entire table): ba.freestatistics.org/blog/index.php?pk=66733&T=2

As an alternative you can also use a QR Code:  

The GUIDs for individual cells are displayed in the table below:

Granger Causality Test: X = f(Y)
ModelRes.DFDiff. DFFp-value
Complete model26
Reduced model37-118.444597389257934.34361298396355e-06


Parameters (Session):
par1 = 1 ; par2 = 0 ; par3 = 0 ; par4 = 12 ; par5 = 1 ; par6 = 0 ; par7 = 0 ; par8 = 11 ;
Parameters (R input):
par1 = 1 ; par2 = 0 ; par3 = 0 ; par4 = 12 ; par5 = 1 ; par6 = 0 ; par7 = 0 ; par8 = 11 ;
R code (references can be found in the software module):
library(lmtest)
par1 <- as.numeric(par1)
par2 <- as.numeric(par2)
par3 <- as.numeric(par3)
par4 <- as.numeric(par4)
par5 <- as.numeric(par5)
par6 <- as.numeric(par6)
par7 <- as.numeric(par7)
par8 <- as.numeric(par8)
ox <- x
oy <- y
if (par1 == 0) {
x <- log(x)
} else {
x <- (x ^ par1 - 1) / par1
}
if (par5 == 0) {
y <- log(y)
} else {
y <- (y ^ par5 - 1) / par5
}
if (par2 > 0) x <- diff(x,lag=1,difference=par2)
if (par6 > 0) y <- diff(y,lag=1,difference=par6)
if (par3 > 0) x <- diff(x,lag=par4,difference=par3)
if (par7 > 0) y <- diff(y,lag=par4,difference=par7)
x
y
(gyx <- grangertest(y ~ x, order=par8))
(gxy <- grangertest(x ~ y, order=par8))
bitmap(file='test1.png')
op <- par(mfrow=c(2,1))
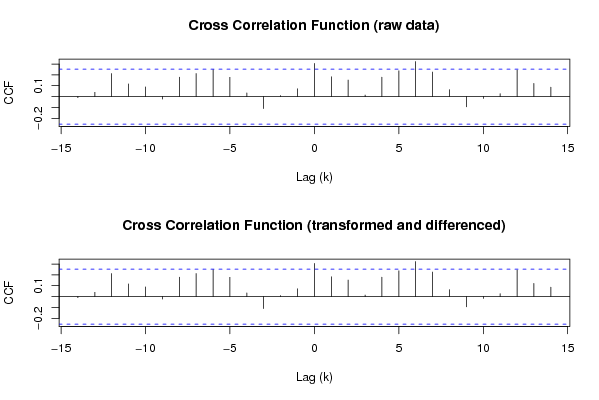
(r <- ccf(ox,oy,main='Cross Correlation Function (raw data)',ylab='CCF',xlab='Lag (k)'))
(r <- ccf(x,y,main='Cross Correlation Function (transformed and differenced)',ylab='CCF',xlab='Lag (k)'))
par(op)
dev.off()
bitmap(file='test2.png')
op <- par(mfrow=c(2,1))
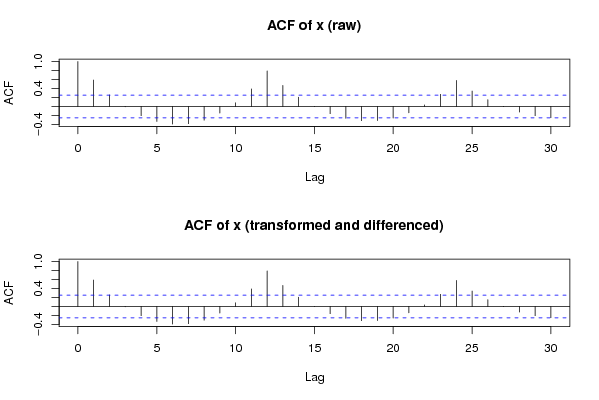
acf(ox,lag.max=round(length(x)/2),main='ACF of x (raw)')
acf(x,lag.max=round(length(x)/2),main='ACF of x (transformed and differenced)')
par(op)
dev.off()
bitmap(file='test3.png')
op <- par(mfrow=c(2,1))
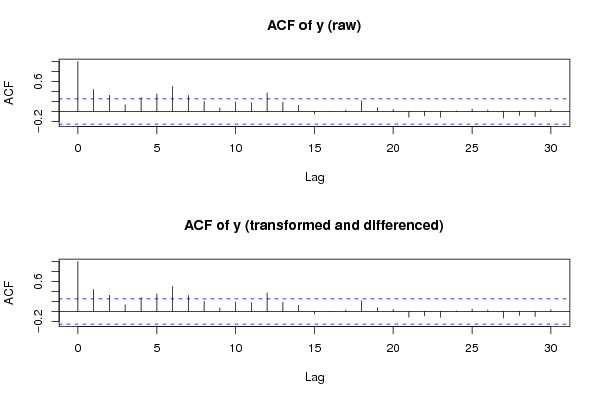
acf(oy,lag.max=round(length(y)/2),main='ACF of y (raw)')
acf(y,lag.max=round(length(y)/2),main='ACF of y (transformed and differenced)')
par(op)
dev.off()
load(file='createtable')
a<-table.start()
a<-table.row.start(a)
a<-table.element(a,'Granger Causality Test: Y = f(X)',5,TRUE)
a<-table.row.end(a)
a<-table.row.start(a)
a<-table.element(a,'Model',header=TRUE)
a<-table.element(a,'Res.DF',header=TRUE)
a<-table.element(a,'Diff. DF',header=TRUE)
a<-table.element(a,'F',header=TRUE)
a<-table.element(a,'p-value',header=TRUE)
a<-table.row.end(a)
a<-table.row.start(a)
a<-table.element(a,'Complete model',header=TRUE)
a<-table.element(a,gyx$Res.Df[1])
a<-table.element(a,'')
a<-table.row.end(a)
a<-table.row.start(a)
a<-table.element(a,'Reduced model',header=TRUE)
a<-table.element(a,gyx$Res.Df[2])
a<-table.element(a,gyx$Df[2])
a<-table.element(a,gyx$F[2])
a<-table.element(a,gyx$Pr[2])
a<-table.row.end(a)
a<-table.end(a)
table.save(a,file='mytable1.tab')
a<-table.start()
a<-table.row.start(a)
a<-table.element(a,'Granger Causality Test: X = f(Y)',5,TRUE)
a<-table.row.end(a)
a<-table.row.start(a)
a<-table.element(a,'Model',header=TRUE)
a<-table.element(a,'Res.DF',header=TRUE)
a<-table.element(a,'Diff. DF',header=TRUE)
a<-table.element(a,'F',header=TRUE)
a<-table.element(a,'p-value',header=TRUE)
a<-table.row.end(a)
a<-table.row.start(a)
a<-table.element(a,'Complete model',header=TRUE)
a<-table.element(a,gxy$Res.Df[1])
a<-table.element(a,'')
a<-table.row.end(a)
a<-table.row.start(a)
a<-table.element(a,'Reduced model',header=TRUE)
a<-table.element(a,gxy$Res.Df[2])
a<-table.element(a,gxy$Df[2])
a<-table.element(a,gxy$F[2])
a<-table.element(a,gxy$Pr[2])
a<-table.row.end(a)
a<-table.end(a)
table.save(a,file='mytable2.tab')