Free Statistics

of Irreproducible Research!

Author's title

Author*The author of this computation has been verified*
R Software Modulerwasp_arimabackwardselection.wasp
Title produced by softwareARIMA Backward Selection
Date of computationFri, 11 Dec 2009 12:50:24 -0700
Cite this page as followsStatistical Computations at FreeStatistics.org, Office for Research Development and Education, URL https://freestatistics.org/blog/index.php?v=date/2009/Dec/11/t1260561093c02weemcl80khpk.htm/, Retrieved Mon, 29 Apr 2024 06:34:16 +0000
Statistical Computations at FreeStatistics.org, Office for Research Development and Education, URL https://freestatistics.org/blog/index.php?pk=66727, Retrieved Mon, 29 Apr 2024 06:34:16 +0000
QR Codes:

Original text written by user:
IsPrivate?No (this computation is public)
User-defined keywords
Estimated Impact150
Family? (F = Feedback message, R = changed R code, M = changed R Module, P = changed Parameters, D = changed Data)
-     [Bivariate Granger Causality] [] [2009-12-07 09:22:28] [b98453cac15ba1066b407e146608df68]
- RMPD  [ARIMA Backward Selection] [Shwws10_v1] [2009-12-09 19:39:22] [5f89c040fdf1f8599c99d7f78a662321]
- R P       [ARIMA Backward Selection] [Shwws10_v1] [2009-12-11 19:50:24] [93b66894f6318f3da4fcda772f2ffa6f] [Current]
Feedback Forum

Post a new message
Dataseries X:
102.1
102.86
102.99
103.73
105.02
104.43
104.63
104.93
105.87
105.66
106.76
106
107.22
107.33
107.11
108.86
107.72
107.88
108.38
107.72
108.41
109.9
111.45
112.18
113.34
113.46
114.06
115.54
116.39
115.94
116.97
115.94
115.91
116.43
116.26
116.35
117.9
117.7
117.53
117.86
117.65
116.51
115.93
115.31
115


Summary of computational transaction
Raw Inputview raw input (R code)
Raw Outputview raw output of R engine
Computing time3 seconds
R Server'Gwilym Jenkins' @ 72.249.127.135

\begin{tabular}{lllllllll}
\hline
Summary of computational transaction \tabularnewline
Raw Input & view raw input (R code)  \tabularnewline
Raw Output & view raw output of R engine  \tabularnewline
Computing time & 3 seconds \tabularnewline
R Server & 'Gwilym Jenkins' @ 72.249.127.135 \tabularnewline
\hline
\end{tabular}
%Source: https://freestatistics.org/blog/index.php?pk=66727&T=0

[TABLE]
[ROW][C]Summary of computational transaction[/C][/ROW]
[ROW][C]Raw Input[/C][C]view raw input (R code) [/C][/ROW]
[ROW][C]Raw Output[/C][C]view raw output of R engine [/C][/ROW]
[ROW][C]Computing time[/C][C]3 seconds[/C][/ROW]
[ROW][C]R Server[/C][C]'Gwilym Jenkins' @ 72.249.127.135[/C][/ROW]
[/TABLE]
Source: https://freestatistics.org/blog/index.php?pk=66727&T=0

Globally Unique Identifier (entire table): ba.freestatistics.org/blog/index.php?pk=66727&T=0

As an alternative you can also use a QR Code:  

The GUIDs for individual cells are displayed in the table below:

Summary of computational transaction
Raw Inputview raw input (R code)
Raw Outputview raw output of R engine
Computing time3 seconds
R Server'Gwilym Jenkins' @ 72.249.127.135


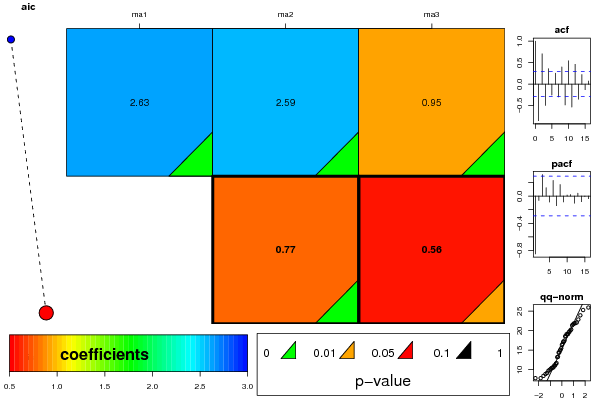
ARIMA Parameter Estimation and Backward Selection
Iterationma1ma2ma3
Estimates ( 1 )2.62872.59220.947
(p-val)(0 )(0 )(0 )
Estimates ( 2 )00.76990.5636
(p-val)(NA )(3e-04 )(0.0117 )
Estimates ( 3 )NANANA
(p-val)(NA )(NA )(NA )
Estimates ( 4 )NANANA
(p-val)(NA )(NA )(NA )
Estimates ( 5 )NANANA
(p-val)(NA )(NA )(NA )

\begin{tabular}{lllllllll}
\hline
ARIMA Parameter Estimation and Backward Selection \tabularnewline
Iteration & ma1 & ma2 & ma3 \tabularnewline
Estimates ( 1 ) & 2.6287 & 2.5922 & 0.947 \tabularnewline
(p-val) & (0 ) & (0 ) & (0 ) \tabularnewline
Estimates ( 2 ) & 0 & 0.7699 & 0.5636 \tabularnewline
(p-val) & (NA ) & (3e-04 ) & (0.0117 ) \tabularnewline
Estimates ( 3 ) & NA & NA & NA \tabularnewline
(p-val) & (NA ) & (NA ) & (NA ) \tabularnewline
Estimates ( 4 ) & NA & NA & NA \tabularnewline
(p-val) & (NA ) & (NA ) & (NA ) \tabularnewline
Estimates ( 5 ) & NA & NA & NA \tabularnewline
(p-val) & (NA ) & (NA ) & (NA ) \tabularnewline
\hline
\end{tabular}
%Source: https://freestatistics.org/blog/index.php?pk=66727&T=1

[TABLE]
[ROW][C]ARIMA Parameter Estimation and Backward Selection[/C][/ROW]
[ROW][C]Iteration[/C][C]ma1[/C][C]ma2[/C][C]ma3[/C][/ROW]
[ROW][C]Estimates ( 1 )[/C][C]2.6287[/C][C]2.5922[/C][C]0.947[/C][/ROW]
[ROW][C](p-val)[/C][C](0 )[/C][C](0 )[/C][C](0 )[/C][/ROW]
[ROW][C]Estimates ( 2 )[/C][C]0[/C][C]0.7699[/C][C]0.5636[/C][/ROW]
[ROW][C](p-val)[/C][C](NA )[/C][C](3e-04 )[/C][C](0.0117 )[/C][/ROW]
[ROW][C]Estimates ( 3 )[/C][C]NA[/C][C]NA[/C][C]NA[/C][/ROW]
[ROW][C](p-val)[/C][C](NA )[/C][C](NA )[/C][C](NA )[/C][/ROW]
[ROW][C]Estimates ( 4 )[/C][C]NA[/C][C]NA[/C][C]NA[/C][/ROW]
[ROW][C](p-val)[/C][C](NA )[/C][C](NA )[/C][C](NA )[/C][/ROW]
[ROW][C]Estimates ( 5 )[/C][C]NA[/C][C]NA[/C][C]NA[/C][/ROW]
[ROW][C](p-val)[/C][C](NA )[/C][C](NA )[/C][C](NA )[/C][/ROW]
[/TABLE]
Source: https://freestatistics.org/blog/index.php?pk=66727&T=1

Globally Unique Identifier (entire table): ba.freestatistics.org/blog/index.php?pk=66727&T=1

As an alternative you can also use a QR Code:  

The GUIDs for individual cells are displayed in the table below:

ARIMA Parameter Estimation and Backward Selection
Iterationma1ma2ma3
Estimates ( 1 )2.62872.59220.947
(p-val)(0 )(0 )(0 )
Estimates ( 2 )00.76990.5636
(p-val)(NA )(3e-04 )(0.0117 )
Estimates ( 3 )NANANA
(p-val)(NA )(NA )(NA )
Estimates ( 4 )NANANA
(p-val)(NA )(NA )(NA )
Estimates ( 5 )NANANA
(p-val)(NA )(NA )(NA )


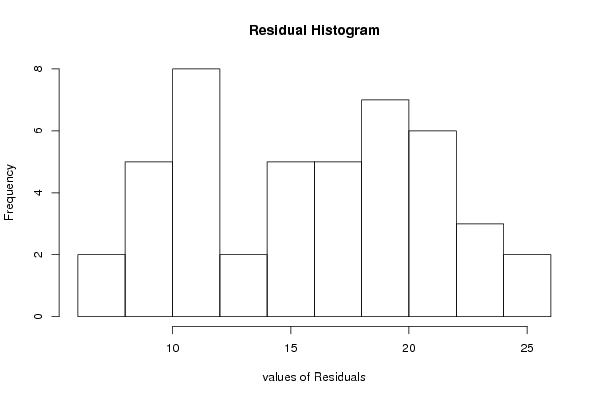
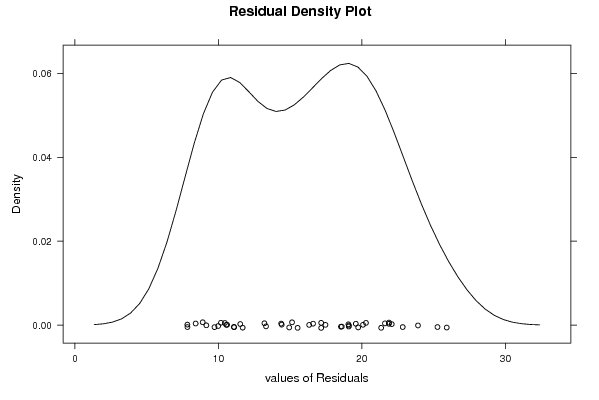
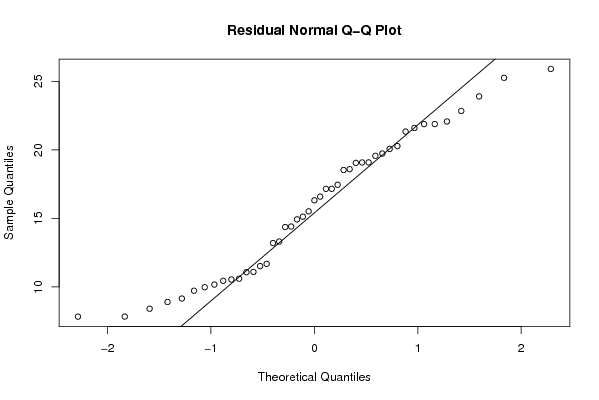
Estimated ARIMA Residuals
Value
25.9114593025249
9.72573174778178
19.7403176309267
11.5225742858671
18.5976418127997
11.0760540962296
19.0919945739626
10.5453731852632
19.5740407507266
9.98255812768702
20.0764874094902
9.15749069275822
21.6057083123133
7.8392697358571
21.8877171168885
10.4491035277594
16.3245777614363
17.1612980892749
11.0982119383041
19.0582016737469
13.3180717577881
15.1305950198631
19.0867576595925
10.1762217416065
22.8440269928784
8.90188241907991
21.8831182770903
13.2057361817320
16.5955953796708
17.4605641404216
15.5184314306774
14.3732246226578
21.3418776066799
8.41343245143028
25.2662585788938
7.83421022122246
23.9089287917346
10.6049443572494
20.283170662554
14.4114903058861
17.1616280940458
14.9339363166836
18.535716240155
11.6893755558937
22.0793614239128

\begin{tabular}{lllllllll}
\hline
Estimated ARIMA Residuals \tabularnewline
Value \tabularnewline
 \tabularnewline
25.9114593025249 \tabularnewline
9.72573174778178 \tabularnewline
19.7403176309267 \tabularnewline
11.5225742858671 \tabularnewline
18.5976418127997 \tabularnewline
11.0760540962296 \tabularnewline
19.0919945739626 \tabularnewline
10.5453731852632 \tabularnewline
19.5740407507266 \tabularnewline
9.98255812768702 \tabularnewline
20.0764874094902 \tabularnewline
9.15749069275822 \tabularnewline
21.6057083123133 \tabularnewline
7.8392697358571 \tabularnewline
21.8877171168885 \tabularnewline
10.4491035277594 \tabularnewline
16.3245777614363 \tabularnewline
17.1612980892749 \tabularnewline
11.0982119383041 \tabularnewline
19.0582016737469 \tabularnewline
13.3180717577881 \tabularnewline
15.1305950198631 \tabularnewline
19.0867576595925 \tabularnewline
10.1762217416065 \tabularnewline
22.8440269928784 \tabularnewline
8.90188241907991 \tabularnewline
21.8831182770903 \tabularnewline
13.2057361817320 \tabularnewline
16.5955953796708 \tabularnewline
17.4605641404216 \tabularnewline
15.5184314306774 \tabularnewline
14.3732246226578 \tabularnewline
21.3418776066799 \tabularnewline
8.41343245143028 \tabularnewline
25.2662585788938 \tabularnewline
7.83421022122246 \tabularnewline
23.9089287917346 \tabularnewline
10.6049443572494 \tabularnewline
20.283170662554 \tabularnewline
14.4114903058861 \tabularnewline
17.1616280940458 \tabularnewline
14.9339363166836 \tabularnewline
18.535716240155 \tabularnewline
11.6893755558937 \tabularnewline
22.0793614239128 \tabularnewline
\hline
\end{tabular}
%Source: https://freestatistics.org/blog/index.php?pk=66727&T=2

[TABLE]
[ROW][C]Estimated ARIMA Residuals[/C][/ROW]
[ROW][C]Value[/C][/ROW]
[ROW][C][/C][/ROW]
[ROW][C]25.9114593025249[/C][/ROW]
[ROW][C]9.72573174778178[/C][/ROW]
[ROW][C]19.7403176309267[/C][/ROW]
[ROW][C]11.5225742858671[/C][/ROW]
[ROW][C]18.5976418127997[/C][/ROW]
[ROW][C]11.0760540962296[/C][/ROW]
[ROW][C]19.0919945739626[/C][/ROW]
[ROW][C]10.5453731852632[/C][/ROW]
[ROW][C]19.5740407507266[/C][/ROW]
[ROW][C]9.98255812768702[/C][/ROW]
[ROW][C]20.0764874094902[/C][/ROW]
[ROW][C]9.15749069275822[/C][/ROW]
[ROW][C]21.6057083123133[/C][/ROW]
[ROW][C]7.8392697358571[/C][/ROW]
[ROW][C]21.8877171168885[/C][/ROW]
[ROW][C]10.4491035277594[/C][/ROW]
[ROW][C]16.3245777614363[/C][/ROW]
[ROW][C]17.1612980892749[/C][/ROW]
[ROW][C]11.0982119383041[/C][/ROW]
[ROW][C]19.0582016737469[/C][/ROW]
[ROW][C]13.3180717577881[/C][/ROW]
[ROW][C]15.1305950198631[/C][/ROW]
[ROW][C]19.0867576595925[/C][/ROW]
[ROW][C]10.1762217416065[/C][/ROW]
[ROW][C]22.8440269928784[/C][/ROW]
[ROW][C]8.90188241907991[/C][/ROW]
[ROW][C]21.8831182770903[/C][/ROW]
[ROW][C]13.2057361817320[/C][/ROW]
[ROW][C]16.5955953796708[/C][/ROW]
[ROW][C]17.4605641404216[/C][/ROW]
[ROW][C]15.5184314306774[/C][/ROW]
[ROW][C]14.3732246226578[/C][/ROW]
[ROW][C]21.3418776066799[/C][/ROW]
[ROW][C]8.41343245143028[/C][/ROW]
[ROW][C]25.2662585788938[/C][/ROW]
[ROW][C]7.83421022122246[/C][/ROW]
[ROW][C]23.9089287917346[/C][/ROW]
[ROW][C]10.6049443572494[/C][/ROW]
[ROW][C]20.283170662554[/C][/ROW]
[ROW][C]14.4114903058861[/C][/ROW]
[ROW][C]17.1616280940458[/C][/ROW]
[ROW][C]14.9339363166836[/C][/ROW]
[ROW][C]18.535716240155[/C][/ROW]
[ROW][C]11.6893755558937[/C][/ROW]
[ROW][C]22.0793614239128[/C][/ROW]
[/TABLE]
Source: https://freestatistics.org/blog/index.php?pk=66727&T=2

Globally Unique Identifier (entire table): ba.freestatistics.org/blog/index.php?pk=66727&T=2

As an alternative you can also use a QR Code:  

The GUIDs for individual cells are displayed in the table below:

Estimated ARIMA Residuals
Value
25.9114593025249
9.72573174778178
19.7403176309267
11.5225742858671
18.5976418127997
11.0760540962296
19.0919945739626
10.5453731852632
19.5740407507266
9.98255812768702
20.0764874094902
9.15749069275822
21.6057083123133
7.8392697358571
21.8877171168885
10.4491035277594
16.3245777614363
17.1612980892749
11.0982119383041
19.0582016737469
13.3180717577881
15.1305950198631
19.0867576595925
10.1762217416065
22.8440269928784
8.90188241907991
21.8831182770903
13.2057361817320
16.5955953796708
17.4605641404216
15.5184314306774
14.3732246226578
21.3418776066799
8.41343245143028
25.2662585788938
7.83421022122246
23.9089287917346
10.6049443572494
20.283170662554
14.4114903058861
17.1616280940458
14.9339363166836
18.535716240155
11.6893755558937
22.0793614239128


Parameters (Session):
par1 = FALSE ; par2 = 1 ; par3 = 1 ; par4 = 0 ; par5 = 12 ; par6 = 3 ; par7 = 0 ; par8 = 0 ; par9 = 0 ;
Parameters (R input):
par1 = FALSE ; par2 = 1 ; par3 = 0 ; par4 = 0 ; par5 = 1 ; par6 = 0 ; par7 = 0 ; par8 = 0 ; par9 = 0 ;
R code (references can be found in the software module):
library(lattice)
if (par1 == 'TRUE') par1 <- TRUE
if (par1 == 'FALSE') par1 <- FALSE
par2 <- as.numeric(par2) #Box-Cox lambda transformation parameter
par3 <- as.numeric(par3) #degree of non-seasonal differencing
par4 <- as.numeric(par4) #degree of seasonal differencing
par5 <- as.numeric(par5) #seasonal period
par6 <- as.numeric(par6) #degree (p) of the non-seasonal AR(p) polynomial
par7 <- as.numeric(3) #degree (q) of the non-seasonal MA(q) polynomial
par8 <- as.numeric(par8) #degree (P) of the seasonal AR(P) polynomial
par9 <- as.numeric(par9) #degree (Q) of the seasonal MA(Q) polynomial
armaGR <- function(arima.out, names, n){
try1 <- arima.out$coef
try2 <- sqrt(diag(arima.out$var.coef))
try.data.frame <- data.frame(matrix(NA,ncol=4,nrow=length(names)))
dimnames(try.data.frame) <- list(names,c('coef','std','tstat','pv'))
try.data.frame[,1] <- try1
for(i in 1:length(try2)) try.data.frame[which(rownames(try.data.frame)==names(try2)[i]),2] <- try2[i]
try.data.frame[,3] <- try.data.frame[,1] / try.data.frame[,2]
try.data.frame[,4] <- round((1-pt(abs(try.data.frame[,3]),df=n-(length(try2)+1)))*2,5)
vector <- rep(NA,length(names))
vector[is.na(try.data.frame[,4])] <- 0
maxi <- which.max(try.data.frame[,4])
continue <- max(try.data.frame[,4],na.rm=TRUE) > .05
vector[maxi] <- 0
list(summary=try.data.frame,next.vector=vector,continue=continue)
}
arimaSelect <- function(series, order=c(13,0,0), seasonal=list(order=c(2,0,0),period=12), include.mean=F){
nrc <- order[1]+order[3]+seasonal$order[1]+seasonal$order[3]
coeff <- matrix(NA, nrow=nrc*2, ncol=nrc)
pval <- matrix(NA, nrow=nrc*2, ncol=nrc)
mylist <- rep(list(NULL), nrc)
names <- NULL
if(order[1] > 0) names <- paste('ar',1:order[1],sep='')
if(order[3] > 0) names <- c( names , paste('ma',1:order[3],sep='') )
if(seasonal$order[1] > 0) names <- c(names, paste('sar',1:seasonal$order[1],sep=''))
if(seasonal$order[3] > 0) names <- c(names, paste('sma',1:seasonal$order[3],sep=''))
arima.out <- arima(series, order=order, seasonal=seasonal, include.mean=include.mean, method='ML')
mylist[[1]] <- arima.out
last.arma <- armaGR(arima.out, names, length(series))
mystop <- FALSE
i <- 1
coeff[i,] <- last.arma[[1]][,1]
pval [i,] <- last.arma[[1]][,4]
i <- 2
aic <- arima.out$aic
while(!mystop){
mylist[[i]] <- arima.out
arima.out <- arima(series, order=order, seasonal=seasonal, include.mean=include.mean, method='ML', fixed=last.arma$next.vector)
aic <- c(aic, arima.out$aic)
last.arma <- armaGR(arima.out, names, length(series))
mystop <- !last.arma$continue
coeff[i,] <- last.arma[[1]][,1]
pval [i,] <- last.arma[[1]][,4]
i <- i+1
}
list(coeff, pval, mylist, aic=aic)
}
arimaSelectplot <- function(arimaSelect.out,noms,choix){
noms <- names(arimaSelect.out[[3]][[1]]$coef)
coeff <- arimaSelect.out[[1]]
k <- min(which(is.na(coeff[,1])))-1
coeff <- coeff[1:k,]
pval <- arimaSelect.out[[2]][1:k,]
aic <- arimaSelect.out$aic[1:k]
coeff[coeff==0] <- NA
n <- ncol(coeff)
if(missing(choix)) choix <- k
layout(matrix(c(1,1,1,2,
3,3,3,2,
3,3,3,4,
5,6,7,7),nr=4),
widths=c(10,35,45,15),
heights=c(30,30,15,15))
couleurs <- rainbow(75)[1:50]#(50)
ticks <- pretty(coeff)
par(mar=c(1,1,3,1))
plot(aic,k:1-.5,type='o',pch=21,bg='blue',cex=2,axes=F,lty=2,xpd=NA)
points(aic[choix],k-choix+.5,pch=21,cex=4,bg=2,xpd=NA)
title('aic',line=2)
par(mar=c(3,0,0,0))
plot(0,axes=F,xlab='',ylab='',xlim=range(ticks),ylim=c(.1,1))
rect(xleft = min(ticks) + (0:49)/50*(max(ticks)-min(ticks)),
xright = min(ticks) + (1:50)/50*(max(ticks)-min(ticks)),
ytop = rep(1,50),
ybottom= rep(0,50),col=couleurs,border=NA)
axis(1,ticks)
rect(xleft=min(ticks),xright=max(ticks),ytop=1,ybottom=0)
text(mean(coeff,na.rm=T),.5,'coefficients',cex=2,font=2)
par(mar=c(1,1,3,1))
image(1:n,1:k,t(coeff[k:1,]),axes=F,col=couleurs,zlim=range(ticks))
for(i in 1:n) for(j in 1:k) if(!is.na(coeff[j,i])) {
if(pval[j,i]<.01) symb = 'green'
else if( (pval[j,i]<.05) & (pval[j,i]>=.01)) symb = 'orange'
else if( (pval[j,i]<.1) & (pval[j,i]>=.05)) symb = 'red'
else symb = 'black'
polygon(c(i+.5 ,i+.2 ,i+.5 ,i+.5),
c(k-j+0.5,k-j+0.5,k-j+0.8,k-j+0.5),
col=symb)
if(j==choix) {
rect(xleft=i-.5,
xright=i+.5,
ybottom=k-j+1.5,
ytop=k-j+.5,
lwd=4)
text(i,
k-j+1,
round(coeff[j,i],2),
cex=1.2,
font=2)
}
else{
rect(xleft=i-.5,xright=i+.5,ybottom=k-j+1.5,ytop=k-j+.5)
text(i,k-j+1,round(coeff[j,i],2),cex=1.2,font=1)
}
}
axis(3,1:n,noms)
par(mar=c(0.5,0,0,0.5))
plot(0,axes=F,xlab='',ylab='',type='n',xlim=c(0,8),ylim=c(-.2,.8))
cols <- c('green','orange','red','black')
niv <- c('0','0.01','0.05','0.1')
for(i in 0:3){
polygon(c(1+2*i ,1+2*i ,1+2*i-.5 ,1+2*i),
c(.4 ,.7 , .4 , .4),
col=cols[i+1])
text(2*i,0.5,niv[i+1],cex=1.5)
}
text(8,.5,1,cex=1.5)
text(4,0,'p-value',cex=2)
box()
residus <- arimaSelect.out[[3]][[choix]]$res
par(mar=c(1,2,4,1))
acf(residus,main='')
title('acf',line=.5)
par(mar=c(1,2,4,1))
pacf(residus,main='')
title('pacf',line=.5)
par(mar=c(2,2,4,1))
qqnorm(residus,main='')
title('qq-norm',line=.5)
qqline(residus)
residus
}
if (par2 == 0) x <- log(x)
if (par2 != 0) x <- x^par2
(selection <- arimaSelect(x, order=c(par6,par3,3), seasonal=list(order=c(par8,par4,par9), period=par5)))
bitmap(file='test1.png')
resid <- arimaSelectplot(selection)
dev.off()
resid
bitmap(file='test2.png')
acf(resid,length(resid)/2, main='Residual Autocorrelation Function')
dev.off()
bitmap(file='test3.png')
pacf(resid,length(resid)/2, main='Residual Partial Autocorrelation Function')
dev.off()
bitmap(file='test4.png')
cpgram(resid, main='Residual Cumulative Periodogram')
dev.off()
bitmap(file='test5.png')
hist(resid, main='Residual Histogram', xlab='values of Residuals')
dev.off()
bitmap(file='test6.png')
densityplot(~resid,col='black',main='Residual Density Plot', xlab='values of Residuals')
dev.off()
bitmap(file='test7.png')
qqnorm(resid, main='Residual Normal Q-Q Plot')
qqline(resid)
dev.off()
ncols <- length(selection[[1]][1,])
nrows <- length(selection[[2]][,1])-1
load(file='createtable')
a<-table.start()
a<-table.row.start(a)
a<-table.element(a,'ARIMA Parameter Estimation and Backward Selection', ncols+1,TRUE)
a<-table.row.end(a)
a<-table.row.start(a)
a<-table.element(a,'Iteration', header=TRUE)
for (i in 1:ncols) {
a<-table.element(a,names(selection[[3]][[1]]$coef)[i],header=TRUE)
}
a<-table.row.end(a)
for (j in 1:nrows) {
a<-table.row.start(a)
mydum <- 'Estimates ('
mydum <- paste(mydum,j)
mydum <- paste(mydum,')')
a<-table.element(a,mydum, header=TRUE)
for (i in 1:ncols) {
a<-table.element(a,round(selection[[1]][j,i],4))
}
a<-table.row.end(a)
a<-table.row.start(a)
a<-table.element(a,'(p-val)', header=TRUE)
for (i in 1:ncols) {
mydum <- '('
mydum <- paste(mydum,round(selection[[2]][j,i],4),sep='')
mydum <- paste(mydum,')')
a<-table.element(a,mydum)
}
a<-table.row.end(a)
}
a<-table.end(a)
table.save(a,file='mytable.tab')
a<-table.start()
a<-table.row.start(a)
a<-table.element(a,'Estimated ARIMA Residuals', 1,TRUE)
a<-table.row.end(a)
a<-table.row.start(a)
a<-table.element(a,'Value', 1,TRUE)
a<-table.row.end(a)
for (i in (par4*par5+par3):length(resid)) {
a<-table.row.start(a)
a<-table.element(a,resid[i])
a<-table.row.end(a)
}
a<-table.end(a)
table.save(a,file='mytable1.tab')