Free Statistics

of Irreproducible Research!

Author's title

Author*The author of this computation has been verified*
R Software Modulerwasp_arimaforecasting.wasp
Title produced by softwareARIMA Forecasting
Date of computationFri, 11 Dec 2009 12:39:13 -0700
Cite this page as followsStatistical Computations at FreeStatistics.org, Office for Research Development and Education, URL https://freestatistics.org/blog/index.php?v=date/2009/Dec/11/t126056044556cx3vo7ycd727m.htm/, Retrieved Mon, 29 Apr 2024 06:07:50 +0000
Statistical Computations at FreeStatistics.org, Office for Research Development and Education, URL https://freestatistics.org/blog/index.php?pk=66717, Retrieved Mon, 29 Apr 2024 06:07:50 +0000
QR Codes:

Original text written by user:
IsPrivate?No (this computation is public)
User-defined keywords
Estimated Impact125
Family? (F = Feedback message, R = changed R code, M = changed R Module, P = changed Parameters, D = changed Data)
-     [ARIMA Forecasting] [] [2009-12-07 09:54:52] [b98453cac15ba1066b407e146608df68]
-   PD    [ARIMA Forecasting] [] [2009-12-11 19:39:13] [ed082d38031561faed979d8cebfeba4d] [Current]
Feedback Forum

Post a new message
Dataseries X:
285
574
865
1147
1516
1789
2087
2372
2669
2966
3270
3652
329
658
988
1303
1603
1929
2235
2544
2872
3198
3544
3903
332
665
1001
1329
1639
1975
2304
2640
2992
3330
3690
4063
368
738
1103
1474
1846
2224
2608
2984
3351
3736
4122
4558
378
749
1113
1500
1867
2244
2621
2988
3349
3723
4108
4514


Summary of computational transaction
Raw Inputview raw input (R code)
Raw Outputview raw output of R engine
Computing time1 seconds
R Server'Gwilym Jenkins' @ 72.249.127.135

\begin{tabular}{lllllllll}
\hline
Summary of computational transaction \tabularnewline
Raw Input & view raw input (R code)  \tabularnewline
Raw Output & view raw output of R engine  \tabularnewline
Computing time & 1 seconds \tabularnewline
R Server & 'Gwilym Jenkins' @ 72.249.127.135 \tabularnewline
\hline
\end{tabular}
%Source: https://freestatistics.org/blog/index.php?pk=66717&T=0

[TABLE]
[ROW][C]Summary of computational transaction[/C][/ROW]
[ROW][C]Raw Input[/C][C]view raw input (R code) [/C][/ROW]
[ROW][C]Raw Output[/C][C]view raw output of R engine [/C][/ROW]
[ROW][C]Computing time[/C][C]1 seconds[/C][/ROW]
[ROW][C]R Server[/C][C]'Gwilym Jenkins' @ 72.249.127.135[/C][/ROW]
[/TABLE]
Source: https://freestatistics.org/blog/index.php?pk=66717&T=0

Globally Unique Identifier (entire table): ba.freestatistics.org/blog/index.php?pk=66717&T=0

As an alternative you can also use a QR Code:  

The GUIDs for individual cells are displayed in the table below:

Summary of computational transaction
Raw Inputview raw input (R code)
Raw Outputview raw output of R engine
Computing time1 seconds
R Server'Gwilym Jenkins' @ 72.249.127.135


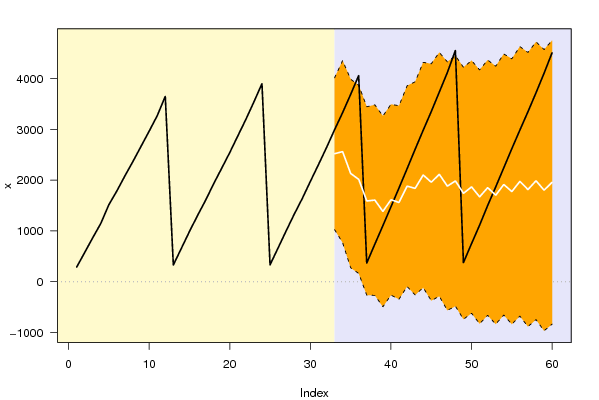
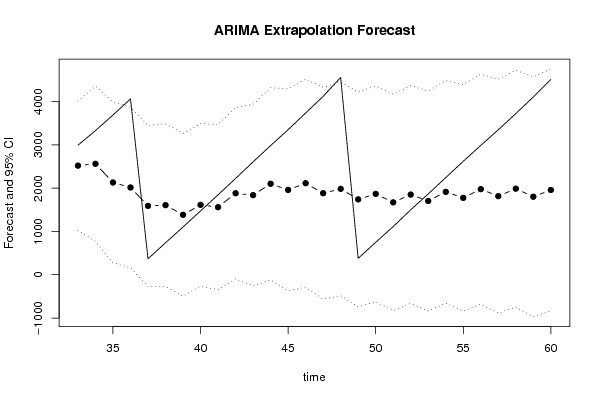
Univariate ARIMA Extrapolation Forecast
timeY[t]F[t]95% LB95% UBp-value(H0: Y[t] = F[t])P(F[t]>Y[t-1])P(F[t]>Y[t-s])P(F[t]>Y[32])
202544-------
212872-------
223198-------
233544-------
243903-------
25332-------
26665-------
271001-------
281329-------
291639-------
301975-------
312304-------
322640-------
3329922521.2341026.12654016.34150.26860.43810.32280.4381
3433302562.8547768.94324356.76620.2010.31960.24390.4664
3536902131.727272.43453991.01950.05020.10330.06830.296
3640632016.0797161.4933870.66640.01530.03840.02310.2548
373681589.7745-267.22423446.77330.09860.00450.90780.1338
387381607.0333-270.57223484.63880.18220.90210.83730.1405
3911031384.8905-495.49353265.27450.38440.74990.65550.0954
4014741614.1585-265.73763494.05470.44190.7030.61690.1424
4118461560.1986-347.0173467.41410.38450.53530.46770.1336
4222241881.9914-95.33243859.31520.36730.51420.46330.2262
4326081838.4122-261.66323938.48760.23630.35950.3320.2272
4429842101.91-119.26884323.08880.21820.32760.31750.3175
4533511959.4565-374.01034292.92330.12120.19470.19290.2838
4637362114.727-288.55094518.00490.0930.15670.16080.3342
4741221882.8472-566.30654332.00090.03660.0690.07410.2723
4845581984.6008-485.00624454.20780.02060.04490.04950.3015
493781741.1723-741.61254223.95720.14090.01310.86080.239
507491867.2474-623.22834357.72310.18940.87940.81290.2715
5111131671.5088-830.3614173.37850.33090.76510.6720.224
5215001852.1296-663.75914368.01820.39190.71760.61580.2697
5318671703.8777-838.02914245.78450.450.56250.45640.2352
5422441914.5422-658.09194487.17620.40090.51440.40680.2902
5526211775.6758-840.31234391.66380.26330.36280.26640.2586
5629881976.49-680.28164633.26160.22780.31720.22870.3122
5733491815.197-886.664517.0540.13290.19740.13260.2748
5837231988.405-748.57234725.38230.10710.16490.10540.3204
5941081802.4122-968.86114573.68540.05150.08720.05040.2768
6045141958.6728-837.34554754.6910.03660.06590.03420.3165

\begin{tabular}{lllllllll}
\hline
Univariate ARIMA Extrapolation Forecast \tabularnewline
time & Y[t] & F[t] & 95% LB & 95% UB & p-value(H0: Y[t] = F[t]) & P(F[t]>Y[t-1]) & P(F[t]>Y[t-s]) & P(F[t]>Y[32]) \tabularnewline
20 & 2544 & - & - & - & - & - & - & - \tabularnewline
21 & 2872 & - & - & - & - & - & - & - \tabularnewline
22 & 3198 & - & - & - & - & - & - & - \tabularnewline
23 & 3544 & - & - & - & - & - & - & - \tabularnewline
24 & 3903 & - & - & - & - & - & - & - \tabularnewline
25 & 332 & - & - & - & - & - & - & - \tabularnewline
26 & 665 & - & - & - & - & - & - & - \tabularnewline
27 & 1001 & - & - & - & - & - & - & - \tabularnewline
28 & 1329 & - & - & - & - & - & - & - \tabularnewline
29 & 1639 & - & - & - & - & - & - & - \tabularnewline
30 & 1975 & - & - & - & - & - & - & - \tabularnewline
31 & 2304 & - & - & - & - & - & - & - \tabularnewline
32 & 2640 & - & - & - & - & - & - & - \tabularnewline
33 & 2992 & 2521.234 & 1026.1265 & 4016.3415 & 0.2686 & 0.4381 & 0.3228 & 0.4381 \tabularnewline
34 & 3330 & 2562.8547 & 768.9432 & 4356.7662 & 0.201 & 0.3196 & 0.2439 & 0.4664 \tabularnewline
35 & 3690 & 2131.727 & 272.4345 & 3991.0195 & 0.0502 & 0.1033 & 0.0683 & 0.296 \tabularnewline
36 & 4063 & 2016.0797 & 161.493 & 3870.6664 & 0.0153 & 0.0384 & 0.0231 & 0.2548 \tabularnewline
37 & 368 & 1589.7745 & -267.2242 & 3446.7733 & 0.0986 & 0.0045 & 0.9078 & 0.1338 \tabularnewline
38 & 738 & 1607.0333 & -270.5722 & 3484.6388 & 0.1822 & 0.9021 & 0.8373 & 0.1405 \tabularnewline
39 & 1103 & 1384.8905 & -495.4935 & 3265.2745 & 0.3844 & 0.7499 & 0.6555 & 0.0954 \tabularnewline
40 & 1474 & 1614.1585 & -265.7376 & 3494.0547 & 0.4419 & 0.703 & 0.6169 & 0.1424 \tabularnewline
41 & 1846 & 1560.1986 & -347.017 & 3467.4141 & 0.3845 & 0.5353 & 0.4677 & 0.1336 \tabularnewline
42 & 2224 & 1881.9914 & -95.3324 & 3859.3152 & 0.3673 & 0.5142 & 0.4633 & 0.2262 \tabularnewline
43 & 2608 & 1838.4122 & -261.6632 & 3938.4876 & 0.2363 & 0.3595 & 0.332 & 0.2272 \tabularnewline
44 & 2984 & 2101.91 & -119.2688 & 4323.0888 & 0.2182 & 0.3276 & 0.3175 & 0.3175 \tabularnewline
45 & 3351 & 1959.4565 & -374.0103 & 4292.9233 & 0.1212 & 0.1947 & 0.1929 & 0.2838 \tabularnewline
46 & 3736 & 2114.727 & -288.5509 & 4518.0049 & 0.093 & 0.1567 & 0.1608 & 0.3342 \tabularnewline
47 & 4122 & 1882.8472 & -566.3065 & 4332.0009 & 0.0366 & 0.069 & 0.0741 & 0.2723 \tabularnewline
48 & 4558 & 1984.6008 & -485.0062 & 4454.2078 & 0.0206 & 0.0449 & 0.0495 & 0.3015 \tabularnewline
49 & 378 & 1741.1723 & -741.6125 & 4223.9572 & 0.1409 & 0.0131 & 0.8608 & 0.239 \tabularnewline
50 & 749 & 1867.2474 & -623.2283 & 4357.7231 & 0.1894 & 0.8794 & 0.8129 & 0.2715 \tabularnewline
51 & 1113 & 1671.5088 & -830.361 & 4173.3785 & 0.3309 & 0.7651 & 0.672 & 0.224 \tabularnewline
52 & 1500 & 1852.1296 & -663.7591 & 4368.0182 & 0.3919 & 0.7176 & 0.6158 & 0.2697 \tabularnewline
53 & 1867 & 1703.8777 & -838.0291 & 4245.7845 & 0.45 & 0.5625 & 0.4564 & 0.2352 \tabularnewline
54 & 2244 & 1914.5422 & -658.0919 & 4487.1762 & 0.4009 & 0.5144 & 0.4068 & 0.2902 \tabularnewline
55 & 2621 & 1775.6758 & -840.3123 & 4391.6638 & 0.2633 & 0.3628 & 0.2664 & 0.2586 \tabularnewline
56 & 2988 & 1976.49 & -680.2816 & 4633.2616 & 0.2278 & 0.3172 & 0.2287 & 0.3122 \tabularnewline
57 & 3349 & 1815.197 & -886.66 & 4517.054 & 0.1329 & 0.1974 & 0.1326 & 0.2748 \tabularnewline
58 & 3723 & 1988.405 & -748.5723 & 4725.3823 & 0.1071 & 0.1649 & 0.1054 & 0.3204 \tabularnewline
59 & 4108 & 1802.4122 & -968.8611 & 4573.6854 & 0.0515 & 0.0872 & 0.0504 & 0.2768 \tabularnewline
60 & 4514 & 1958.6728 & -837.3455 & 4754.691 & 0.0366 & 0.0659 & 0.0342 & 0.3165 \tabularnewline
\hline
\end{tabular}
%Source: https://freestatistics.org/blog/index.php?pk=66717&T=1

[TABLE]
[ROW][C]Univariate ARIMA Extrapolation Forecast[/C][/ROW]
[ROW][C]time[/C][C]Y[t][/C][C]F[t][/C][C]95% LB[/C][C]95% UB[/C][C]p-value(H0: Y[t] = F[t])[/C][C]P(F[t]>Y[t-1])[/C][C]P(F[t]>Y[t-s])[/C][C]P(F[t]>Y[32])[/C][/ROW]
[ROW][C]20[/C][C]2544[/C][C]-[/C][C]-[/C][C]-[/C][C]-[/C][C]-[/C][C]-[/C][C]-[/C][/ROW]
[ROW][C]21[/C][C]2872[/C][C]-[/C][C]-[/C][C]-[/C][C]-[/C][C]-[/C][C]-[/C][C]-[/C][/ROW]
[ROW][C]22[/C][C]3198[/C][C]-[/C][C]-[/C][C]-[/C][C]-[/C][C]-[/C][C]-[/C][C]-[/C][/ROW]
[ROW][C]23[/C][C]3544[/C][C]-[/C][C]-[/C][C]-[/C][C]-[/C][C]-[/C][C]-[/C][C]-[/C][/ROW]
[ROW][C]24[/C][C]3903[/C][C]-[/C][C]-[/C][C]-[/C][C]-[/C][C]-[/C][C]-[/C][C]-[/C][/ROW]
[ROW][C]25[/C][C]332[/C][C]-[/C][C]-[/C][C]-[/C][C]-[/C][C]-[/C][C]-[/C][C]-[/C][/ROW]
[ROW][C]26[/C][C]665[/C][C]-[/C][C]-[/C][C]-[/C][C]-[/C][C]-[/C][C]-[/C][C]-[/C][/ROW]
[ROW][C]27[/C][C]1001[/C][C]-[/C][C]-[/C][C]-[/C][C]-[/C][C]-[/C][C]-[/C][C]-[/C][/ROW]
[ROW][C]28[/C][C]1329[/C][C]-[/C][C]-[/C][C]-[/C][C]-[/C][C]-[/C][C]-[/C][C]-[/C][/ROW]
[ROW][C]29[/C][C]1639[/C][C]-[/C][C]-[/C][C]-[/C][C]-[/C][C]-[/C][C]-[/C][C]-[/C][/ROW]
[ROW][C]30[/C][C]1975[/C][C]-[/C][C]-[/C][C]-[/C][C]-[/C][C]-[/C][C]-[/C][C]-[/C][/ROW]
[ROW][C]31[/C][C]2304[/C][C]-[/C][C]-[/C][C]-[/C][C]-[/C][C]-[/C][C]-[/C][C]-[/C][/ROW]
[ROW][C]32[/C][C]2640[/C][C]-[/C][C]-[/C][C]-[/C][C]-[/C][C]-[/C][C]-[/C][C]-[/C][/ROW]
[ROW][C]33[/C][C]2992[/C][C]2521.234[/C][C]1026.1265[/C][C]4016.3415[/C][C]0.2686[/C][C]0.4381[/C][C]0.3228[/C][C]0.4381[/C][/ROW]
[ROW][C]34[/C][C]3330[/C][C]2562.8547[/C][C]768.9432[/C][C]4356.7662[/C][C]0.201[/C][C]0.3196[/C][C]0.2439[/C][C]0.4664[/C][/ROW]
[ROW][C]35[/C][C]3690[/C][C]2131.727[/C][C]272.4345[/C][C]3991.0195[/C][C]0.0502[/C][C]0.1033[/C][C]0.0683[/C][C]0.296[/C][/ROW]
[ROW][C]36[/C][C]4063[/C][C]2016.0797[/C][C]161.493[/C][C]3870.6664[/C][C]0.0153[/C][C]0.0384[/C][C]0.0231[/C][C]0.2548[/C][/ROW]
[ROW][C]37[/C][C]368[/C][C]1589.7745[/C][C]-267.2242[/C][C]3446.7733[/C][C]0.0986[/C][C]0.0045[/C][C]0.9078[/C][C]0.1338[/C][/ROW]
[ROW][C]38[/C][C]738[/C][C]1607.0333[/C][C]-270.5722[/C][C]3484.6388[/C][C]0.1822[/C][C]0.9021[/C][C]0.8373[/C][C]0.1405[/C][/ROW]
[ROW][C]39[/C][C]1103[/C][C]1384.8905[/C][C]-495.4935[/C][C]3265.2745[/C][C]0.3844[/C][C]0.7499[/C][C]0.6555[/C][C]0.0954[/C][/ROW]
[ROW][C]40[/C][C]1474[/C][C]1614.1585[/C][C]-265.7376[/C][C]3494.0547[/C][C]0.4419[/C][C]0.703[/C][C]0.6169[/C][C]0.1424[/C][/ROW]
[ROW][C]41[/C][C]1846[/C][C]1560.1986[/C][C]-347.017[/C][C]3467.4141[/C][C]0.3845[/C][C]0.5353[/C][C]0.4677[/C][C]0.1336[/C][/ROW]
[ROW][C]42[/C][C]2224[/C][C]1881.9914[/C][C]-95.3324[/C][C]3859.3152[/C][C]0.3673[/C][C]0.5142[/C][C]0.4633[/C][C]0.2262[/C][/ROW]
[ROW][C]43[/C][C]2608[/C][C]1838.4122[/C][C]-261.6632[/C][C]3938.4876[/C][C]0.2363[/C][C]0.3595[/C][C]0.332[/C][C]0.2272[/C][/ROW]
[ROW][C]44[/C][C]2984[/C][C]2101.91[/C][C]-119.2688[/C][C]4323.0888[/C][C]0.2182[/C][C]0.3276[/C][C]0.3175[/C][C]0.3175[/C][/ROW]
[ROW][C]45[/C][C]3351[/C][C]1959.4565[/C][C]-374.0103[/C][C]4292.9233[/C][C]0.1212[/C][C]0.1947[/C][C]0.1929[/C][C]0.2838[/C][/ROW]
[ROW][C]46[/C][C]3736[/C][C]2114.727[/C][C]-288.5509[/C][C]4518.0049[/C][C]0.093[/C][C]0.1567[/C][C]0.1608[/C][C]0.3342[/C][/ROW]
[ROW][C]47[/C][C]4122[/C][C]1882.8472[/C][C]-566.3065[/C][C]4332.0009[/C][C]0.0366[/C][C]0.069[/C][C]0.0741[/C][C]0.2723[/C][/ROW]
[ROW][C]48[/C][C]4558[/C][C]1984.6008[/C][C]-485.0062[/C][C]4454.2078[/C][C]0.0206[/C][C]0.0449[/C][C]0.0495[/C][C]0.3015[/C][/ROW]
[ROW][C]49[/C][C]378[/C][C]1741.1723[/C][C]-741.6125[/C][C]4223.9572[/C][C]0.1409[/C][C]0.0131[/C][C]0.8608[/C][C]0.239[/C][/ROW]
[ROW][C]50[/C][C]749[/C][C]1867.2474[/C][C]-623.2283[/C][C]4357.7231[/C][C]0.1894[/C][C]0.8794[/C][C]0.8129[/C][C]0.2715[/C][/ROW]
[ROW][C]51[/C][C]1113[/C][C]1671.5088[/C][C]-830.361[/C][C]4173.3785[/C][C]0.3309[/C][C]0.7651[/C][C]0.672[/C][C]0.224[/C][/ROW]
[ROW][C]52[/C][C]1500[/C][C]1852.1296[/C][C]-663.7591[/C][C]4368.0182[/C][C]0.3919[/C][C]0.7176[/C][C]0.6158[/C][C]0.2697[/C][/ROW]
[ROW][C]53[/C][C]1867[/C][C]1703.8777[/C][C]-838.0291[/C][C]4245.7845[/C][C]0.45[/C][C]0.5625[/C][C]0.4564[/C][C]0.2352[/C][/ROW]
[ROW][C]54[/C][C]2244[/C][C]1914.5422[/C][C]-658.0919[/C][C]4487.1762[/C][C]0.4009[/C][C]0.5144[/C][C]0.4068[/C][C]0.2902[/C][/ROW]
[ROW][C]55[/C][C]2621[/C][C]1775.6758[/C][C]-840.3123[/C][C]4391.6638[/C][C]0.2633[/C][C]0.3628[/C][C]0.2664[/C][C]0.2586[/C][/ROW]
[ROW][C]56[/C][C]2988[/C][C]1976.49[/C][C]-680.2816[/C][C]4633.2616[/C][C]0.2278[/C][C]0.3172[/C][C]0.2287[/C][C]0.3122[/C][/ROW]
[ROW][C]57[/C][C]3349[/C][C]1815.197[/C][C]-886.66[/C][C]4517.054[/C][C]0.1329[/C][C]0.1974[/C][C]0.1326[/C][C]0.2748[/C][/ROW]
[ROW][C]58[/C][C]3723[/C][C]1988.405[/C][C]-748.5723[/C][C]4725.3823[/C][C]0.1071[/C][C]0.1649[/C][C]0.1054[/C][C]0.3204[/C][/ROW]
[ROW][C]59[/C][C]4108[/C][C]1802.4122[/C][C]-968.8611[/C][C]4573.6854[/C][C]0.0515[/C][C]0.0872[/C][C]0.0504[/C][C]0.2768[/C][/ROW]
[ROW][C]60[/C][C]4514[/C][C]1958.6728[/C][C]-837.3455[/C][C]4754.691[/C][C]0.0366[/C][C]0.0659[/C][C]0.0342[/C][C]0.3165[/C][/ROW]
[/TABLE]
Source: https://freestatistics.org/blog/index.php?pk=66717&T=1

Globally Unique Identifier (entire table): ba.freestatistics.org/blog/index.php?pk=66717&T=1

As an alternative you can also use a QR Code:  

The GUIDs for individual cells are displayed in the table below:

Univariate ARIMA Extrapolation Forecast
timeY[t]F[t]95% LB95% UBp-value(H0: Y[t] = F[t])P(F[t]>Y[t-1])P(F[t]>Y[t-s])P(F[t]>Y[32])
202544-------
212872-------
223198-------
233544-------
243903-------
25332-------
26665-------
271001-------
281329-------
291639-------
301975-------
312304-------
322640-------
3329922521.2341026.12654016.34150.26860.43810.32280.4381
3433302562.8547768.94324356.76620.2010.31960.24390.4664
3536902131.727272.43453991.01950.05020.10330.06830.296
3640632016.0797161.4933870.66640.01530.03840.02310.2548
373681589.7745-267.22423446.77330.09860.00450.90780.1338
387381607.0333-270.57223484.63880.18220.90210.83730.1405
3911031384.8905-495.49353265.27450.38440.74990.65550.0954
4014741614.1585-265.73763494.05470.44190.7030.61690.1424
4118461560.1986-347.0173467.41410.38450.53530.46770.1336
4222241881.9914-95.33243859.31520.36730.51420.46330.2262
4326081838.4122-261.66323938.48760.23630.35950.3320.2272
4429842101.91-119.26884323.08880.21820.32760.31750.3175
4533511959.4565-374.01034292.92330.12120.19470.19290.2838
4637362114.727-288.55094518.00490.0930.15670.16080.3342
4741221882.8472-566.30654332.00090.03660.0690.07410.2723
4845581984.6008-485.00624454.20780.02060.04490.04950.3015
493781741.1723-741.61254223.95720.14090.01310.86080.239
507491867.2474-623.22834357.72310.18940.87940.81290.2715
5111131671.5088-830.3614173.37850.33090.76510.6720.224
5215001852.1296-663.75914368.01820.39190.71760.61580.2697
5318671703.8777-838.02914245.78450.450.56250.45640.2352
5422441914.5422-658.09194487.17620.40090.51440.40680.2902
5526211775.6758-840.31234391.66380.26330.36280.26640.2586
5629881976.49-680.28164633.26160.22780.31720.22870.3122
5733491815.197-886.664517.0540.13290.19740.13260.2748
5837231988.405-748.57234725.38230.10710.16490.10540.3204
5941081802.4122-968.86114573.68540.05150.08720.05040.2768
6045141958.6728-837.34554754.6910.03660.06590.03420.3165


Univariate ARIMA Extrapolation Forecast Performance
time% S.E.PEMAPESq.EMSERMSE
330.30260.18670221620.599800
340.35710.29930.243588511.8985405066.2491636.4482
350.4450.7310.40572428214.68871079449.06231038.9654
360.46931.01530.55814189882.70671857057.47341362.739
370.596-0.76850.60021492733.00361784192.57951335.7367
380.5961-0.54080.5903755218.87431612696.96191269.9201
390.6927-0.20350.53579462.24851393663.43141180.5352
400.5942-0.08680.47919644.41711221911.05461105.4009
410.62370.18320.446181682.44411095218.98681046.5271
420.5360.18170.4197116969.8846997394.0766998.6962
430.58280.41860.4196592265.4007960564.197980.0838
440.53920.41970.4196778082.7535945357.41972.2949
450.60760.71020.4421936393.36841021590.94531010.7378
460.57980.76670.46512628526.26111136372.03921066.0075
470.66371.18920.51345013805.16961394867.58131181.0451
480.63491.29670.56246622383.54951721587.32931312.0927
490.7275-0.78290.57531858238.77361729625.64951315.1523
500.6805-0.59890.57671250477.21961703006.29231304.9928
510.7637-0.33410.5639311932.06221629791.85921276.633
520.693-0.19010.5452123995.24361554502.02841246.7967
530.76110.09570.523826608.8851481745.2121217.2696
540.68560.17210.5078108542.44641419326.90451191.3551
550.75170.47610.5064714573.07461388685.43361178.425
560.68580.51180.50671023152.38921373454.89011171.9449
570.75940.8450.52022352551.76251412618.7651188.5364
580.70230.87240.53373008819.69811474011.10861214.0886
590.78451.27920.56135315735.29451616297.18951271.3368
600.72831.30460.58796529697.29051791775.76461338.5723

\begin{tabular}{lllllllll}
\hline
Univariate ARIMA Extrapolation Forecast Performance \tabularnewline
time & % S.E. & PE & MAPE & Sq.E & MSE & RMSE \tabularnewline
33 & 0.3026 & 0.1867 & 0 & 221620.5998 & 0 & 0 \tabularnewline
34 & 0.3571 & 0.2993 & 0.243 & 588511.8985 & 405066.2491 & 636.4482 \tabularnewline
35 & 0.445 & 0.731 & 0.4057 & 2428214.6887 & 1079449.0623 & 1038.9654 \tabularnewline
36 & 0.4693 & 1.0153 & 0.5581 & 4189882.7067 & 1857057.4734 & 1362.739 \tabularnewline
37 & 0.596 & -0.7685 & 0.6002 & 1492733.0036 & 1784192.5795 & 1335.7367 \tabularnewline
38 & 0.5961 & -0.5408 & 0.5903 & 755218.8743 & 1612696.9619 & 1269.9201 \tabularnewline
39 & 0.6927 & -0.2035 & 0.535 & 79462.2485 & 1393663.4314 & 1180.5352 \tabularnewline
40 & 0.5942 & -0.0868 & 0.479 & 19644.4171 & 1221911.0546 & 1105.4009 \tabularnewline
41 & 0.6237 & 0.1832 & 0.4461 & 81682.4441 & 1095218.9868 & 1046.5271 \tabularnewline
42 & 0.536 & 0.1817 & 0.4197 & 116969.8846 & 997394.0766 & 998.6962 \tabularnewline
43 & 0.5828 & 0.4186 & 0.4196 & 592265.4007 & 960564.197 & 980.0838 \tabularnewline
44 & 0.5392 & 0.4197 & 0.4196 & 778082.7535 & 945357.41 & 972.2949 \tabularnewline
45 & 0.6076 & 0.7102 & 0.442 & 1936393.3684 & 1021590.9453 & 1010.7378 \tabularnewline
46 & 0.5798 & 0.7667 & 0.4651 & 2628526.2611 & 1136372.0392 & 1066.0075 \tabularnewline
47 & 0.6637 & 1.1892 & 0.5134 & 5013805.1696 & 1394867.5813 & 1181.0451 \tabularnewline
48 & 0.6349 & 1.2967 & 0.5624 & 6622383.5495 & 1721587.3293 & 1312.0927 \tabularnewline
49 & 0.7275 & -0.7829 & 0.5753 & 1858238.7736 & 1729625.6495 & 1315.1523 \tabularnewline
50 & 0.6805 & -0.5989 & 0.5767 & 1250477.2196 & 1703006.2923 & 1304.9928 \tabularnewline
51 & 0.7637 & -0.3341 & 0.5639 & 311932.0622 & 1629791.8592 & 1276.633 \tabularnewline
52 & 0.693 & -0.1901 & 0.5452 & 123995.2436 & 1554502.0284 & 1246.7967 \tabularnewline
53 & 0.7611 & 0.0957 & 0.5238 & 26608.885 & 1481745.212 & 1217.2696 \tabularnewline
54 & 0.6856 & 0.1721 & 0.5078 & 108542.4464 & 1419326.9045 & 1191.3551 \tabularnewline
55 & 0.7517 & 0.4761 & 0.5064 & 714573.0746 & 1388685.4336 & 1178.425 \tabularnewline
56 & 0.6858 & 0.5118 & 0.5067 & 1023152.3892 & 1373454.8901 & 1171.9449 \tabularnewline
57 & 0.7594 & 0.845 & 0.5202 & 2352551.7625 & 1412618.765 & 1188.5364 \tabularnewline
58 & 0.7023 & 0.8724 & 0.5337 & 3008819.6981 & 1474011.1086 & 1214.0886 \tabularnewline
59 & 0.7845 & 1.2792 & 0.5613 & 5315735.2945 & 1616297.1895 & 1271.3368 \tabularnewline
60 & 0.7283 & 1.3046 & 0.5879 & 6529697.2905 & 1791775.7646 & 1338.5723 \tabularnewline
\hline
\end{tabular}
%Source: https://freestatistics.org/blog/index.php?pk=66717&T=2

[TABLE]
[ROW][C]Univariate ARIMA Extrapolation Forecast Performance[/C][/ROW]
[ROW][C]time[/C][C]% S.E.[/C][C]PE[/C][C]MAPE[/C][C]Sq.E[/C][C]MSE[/C][C]RMSE[/C][/ROW]
[ROW][C]33[/C][C]0.3026[/C][C]0.1867[/C][C]0[/C][C]221620.5998[/C][C]0[/C][C]0[/C][/ROW]
[ROW][C]34[/C][C]0.3571[/C][C]0.2993[/C][C]0.243[/C][C]588511.8985[/C][C]405066.2491[/C][C]636.4482[/C][/ROW]
[ROW][C]35[/C][C]0.445[/C][C]0.731[/C][C]0.4057[/C][C]2428214.6887[/C][C]1079449.0623[/C][C]1038.9654[/C][/ROW]
[ROW][C]36[/C][C]0.4693[/C][C]1.0153[/C][C]0.5581[/C][C]4189882.7067[/C][C]1857057.4734[/C][C]1362.739[/C][/ROW]
[ROW][C]37[/C][C]0.596[/C][C]-0.7685[/C][C]0.6002[/C][C]1492733.0036[/C][C]1784192.5795[/C][C]1335.7367[/C][/ROW]
[ROW][C]38[/C][C]0.5961[/C][C]-0.5408[/C][C]0.5903[/C][C]755218.8743[/C][C]1612696.9619[/C][C]1269.9201[/C][/ROW]
[ROW][C]39[/C][C]0.6927[/C][C]-0.2035[/C][C]0.535[/C][C]79462.2485[/C][C]1393663.4314[/C][C]1180.5352[/C][/ROW]
[ROW][C]40[/C][C]0.5942[/C][C]-0.0868[/C][C]0.479[/C][C]19644.4171[/C][C]1221911.0546[/C][C]1105.4009[/C][/ROW]
[ROW][C]41[/C][C]0.6237[/C][C]0.1832[/C][C]0.4461[/C][C]81682.4441[/C][C]1095218.9868[/C][C]1046.5271[/C][/ROW]
[ROW][C]42[/C][C]0.536[/C][C]0.1817[/C][C]0.4197[/C][C]116969.8846[/C][C]997394.0766[/C][C]998.6962[/C][/ROW]
[ROW][C]43[/C][C]0.5828[/C][C]0.4186[/C][C]0.4196[/C][C]592265.4007[/C][C]960564.197[/C][C]980.0838[/C][/ROW]
[ROW][C]44[/C][C]0.5392[/C][C]0.4197[/C][C]0.4196[/C][C]778082.7535[/C][C]945357.41[/C][C]972.2949[/C][/ROW]
[ROW][C]45[/C][C]0.6076[/C][C]0.7102[/C][C]0.442[/C][C]1936393.3684[/C][C]1021590.9453[/C][C]1010.7378[/C][/ROW]
[ROW][C]46[/C][C]0.5798[/C][C]0.7667[/C][C]0.4651[/C][C]2628526.2611[/C][C]1136372.0392[/C][C]1066.0075[/C][/ROW]
[ROW][C]47[/C][C]0.6637[/C][C]1.1892[/C][C]0.5134[/C][C]5013805.1696[/C][C]1394867.5813[/C][C]1181.0451[/C][/ROW]
[ROW][C]48[/C][C]0.6349[/C][C]1.2967[/C][C]0.5624[/C][C]6622383.5495[/C][C]1721587.3293[/C][C]1312.0927[/C][/ROW]
[ROW][C]49[/C][C]0.7275[/C][C]-0.7829[/C][C]0.5753[/C][C]1858238.7736[/C][C]1729625.6495[/C][C]1315.1523[/C][/ROW]
[ROW][C]50[/C][C]0.6805[/C][C]-0.5989[/C][C]0.5767[/C][C]1250477.2196[/C][C]1703006.2923[/C][C]1304.9928[/C][/ROW]
[ROW][C]51[/C][C]0.7637[/C][C]-0.3341[/C][C]0.5639[/C][C]311932.0622[/C][C]1629791.8592[/C][C]1276.633[/C][/ROW]
[ROW][C]52[/C][C]0.693[/C][C]-0.1901[/C][C]0.5452[/C][C]123995.2436[/C][C]1554502.0284[/C][C]1246.7967[/C][/ROW]
[ROW][C]53[/C][C]0.7611[/C][C]0.0957[/C][C]0.5238[/C][C]26608.885[/C][C]1481745.212[/C][C]1217.2696[/C][/ROW]
[ROW][C]54[/C][C]0.6856[/C][C]0.1721[/C][C]0.5078[/C][C]108542.4464[/C][C]1419326.9045[/C][C]1191.3551[/C][/ROW]
[ROW][C]55[/C][C]0.7517[/C][C]0.4761[/C][C]0.5064[/C][C]714573.0746[/C][C]1388685.4336[/C][C]1178.425[/C][/ROW]
[ROW][C]56[/C][C]0.6858[/C][C]0.5118[/C][C]0.5067[/C][C]1023152.3892[/C][C]1373454.8901[/C][C]1171.9449[/C][/ROW]
[ROW][C]57[/C][C]0.7594[/C][C]0.845[/C][C]0.5202[/C][C]2352551.7625[/C][C]1412618.765[/C][C]1188.5364[/C][/ROW]
[ROW][C]58[/C][C]0.7023[/C][C]0.8724[/C][C]0.5337[/C][C]3008819.6981[/C][C]1474011.1086[/C][C]1214.0886[/C][/ROW]
[ROW][C]59[/C][C]0.7845[/C][C]1.2792[/C][C]0.5613[/C][C]5315735.2945[/C][C]1616297.1895[/C][C]1271.3368[/C][/ROW]
[ROW][C]60[/C][C]0.7283[/C][C]1.3046[/C][C]0.5879[/C][C]6529697.2905[/C][C]1791775.7646[/C][C]1338.5723[/C][/ROW]
[/TABLE]
Source: https://freestatistics.org/blog/index.php?pk=66717&T=2

Globally Unique Identifier (entire table): ba.freestatistics.org/blog/index.php?pk=66717&T=2

As an alternative you can also use a QR Code:  

The GUIDs for individual cells are displayed in the table below:

Univariate ARIMA Extrapolation Forecast Performance
time% S.E.PEMAPESq.EMSERMSE
330.30260.18670221620.599800
340.35710.29930.243588511.8985405066.2491636.4482
350.4450.7310.40572428214.68871079449.06231038.9654
360.46931.01530.55814189882.70671857057.47341362.739
370.596-0.76850.60021492733.00361784192.57951335.7367
380.5961-0.54080.5903755218.87431612696.96191269.9201
390.6927-0.20350.53579462.24851393663.43141180.5352
400.5942-0.08680.47919644.41711221911.05461105.4009
410.62370.18320.446181682.44411095218.98681046.5271
420.5360.18170.4197116969.8846997394.0766998.6962
430.58280.41860.4196592265.4007960564.197980.0838
440.53920.41970.4196778082.7535945357.41972.2949
450.60760.71020.4421936393.36841021590.94531010.7378
460.57980.76670.46512628526.26111136372.03921066.0075
470.66371.18920.51345013805.16961394867.58131181.0451
480.63491.29670.56246622383.54951721587.32931312.0927
490.7275-0.78290.57531858238.77361729625.64951315.1523
500.6805-0.59890.57671250477.21961703006.29231304.9928
510.7637-0.33410.5639311932.06221629791.85921276.633
520.693-0.19010.5452123995.24361554502.02841246.7967
530.76110.09570.523826608.8851481745.2121217.2696
540.68560.17210.5078108542.44641419326.90451191.3551
550.75170.47610.5064714573.07461388685.43361178.425
560.68580.51180.50671023152.38921373454.89011171.9449
570.75940.8450.52022352551.76251412618.7651188.5364
580.70230.87240.53373008819.69811474011.10861214.0886
590.78451.27920.56135315735.29451616297.18951271.3368
600.72831.30460.58796529697.29051791775.76461338.5723


Parameters (Session):
par1 = 24 ; par2 = 1 ; par3 = 1 ; par4 = 0 ; par5 = 12 ; par6 = 0 ; par7 = 0 ; par8 = 0 ; par9 = 0 ; par10 = FALSE ;
Parameters (R input):
par1 = 24 ; par2 = 1 ; par3 = 1 ; par4 = 0 ; par5 = 12 ; par6 = 0 ; par7 = 0 ; par8 = 0 ; par9 = 0 ; par10 = FALSE ;
R code (references can be found in the software module):
par1 <- as.numeric(par1) #cut off periods
par1 <- 28
par2 <- as.numeric(par2) #lambda
par3 <- as.numeric(par3) #degree of non-seasonal differencing
par4 <- as.numeric(par4) #degree of seasonal differencing
par5 <- as.numeric(par5) #seasonal period
par6 <- as.numeric(par6) #p
par6 <- 3
par7 <- as.numeric(par7) #q
par7 <- 3
par8 <- as.numeric(par8) #P
par9 <- as.numeric(par9) #Q
if (par10 == 'TRUE') par10 <- TRUE
if (par10 == 'FALSE') par10 <- FALSE
if (par2 == 0) x <- log(x)
if (par2 != 0) x <- x^par2
lx <- length(x)
first <- lx - 2*par1
nx <- lx - par1
nx1 <- nx + 1
fx <- lx - nx
if (fx < 1) {
fx <- par5
nx1 <- lx + fx - 1
first <- lx - 2*fx
}
first <- 1
if (fx < 3) fx <- round(lx/10,0)
(arima.out <- arima(x[1:nx], order=c(par6,par3,par7), seasonal=list(order=c(par8,par4,par9), period=par5), include.mean=par10, method='ML'))
(forecast <- predict(arima.out,par1))
(lb <- forecast$pred - 1.96 * forecast$se)
(ub <- forecast$pred + 1.96 * forecast$se)
if (par2 == 0) {
x <- exp(x)
forecast$pred <- exp(forecast$pred)
lb <- exp(lb)
ub <- exp(ub)
}
if (par2 != 0) {
x <- x^(1/par2)
forecast$pred <- forecast$pred^(1/par2)
lb <- lb^(1/par2)
ub <- ub^(1/par2)
}
if (par2 < 0) {
olb <- lb
lb <- ub
ub <- olb
}
(actandfor <- c(x[1:nx], forecast$pred))
(perc.se <- (ub-forecast$pred)/1.96/forecast$pred)
bitmap(file='test1.png')
opar <- par(mar=c(4,4,2,2),las=1)
ylim <- c( min(x[first:nx],lb), max(x[first:nx],ub))
plot(x,ylim=ylim,type='n',xlim=c(first,lx))
usr <- par('usr')
rect(usr[1],usr[3],nx+1,usr[4],border=NA,col='lemonchiffon')
rect(nx1,usr[3],usr[2],usr[4],border=NA,col='lavender')
abline(h= (-3:3)*2 , col ='gray', lty =3)
polygon( c(nx1:lx,lx:nx1), c(lb,rev(ub)), col = 'orange', lty=2,border=NA)
lines(nx1:lx, lb , lty=2)
lines(nx1:lx, ub , lty=2)
lines(x, lwd=2)
lines(nx1:lx, forecast$pred , lwd=2 , col ='white')
box()
par(opar)
dev.off()
prob.dec <- array(NA, dim=fx)
prob.sdec <- array(NA, dim=fx)
prob.ldec <- array(NA, dim=fx)
prob.pval <- array(NA, dim=fx)
perf.pe <- array(0, dim=fx)
perf.mape <- array(0, dim=fx)
perf.mape1 <- array(0, dim=fx)
perf.se <- array(0, dim=fx)
perf.mse <- array(0, dim=fx)
perf.mse1 <- array(0, dim=fx)
perf.rmse <- array(0, dim=fx)
for (i in 1:fx) {
locSD <- (ub[i] - forecast$pred[i]) / 1.96
perf.pe[i] = (x[nx+i] - forecast$pred[i]) / forecast$pred[i]
perf.se[i] = (x[nx+i] - forecast$pred[i])^2
prob.dec[i] = pnorm((x[nx+i-1] - forecast$pred[i]) / locSD)
prob.sdec[i] = pnorm((x[nx+i-par5] - forecast$pred[i]) / locSD)
prob.ldec[i] = pnorm((x[nx] - forecast$pred[i]) / locSD)
prob.pval[i] = pnorm(abs(x[nx+i] - forecast$pred[i]) / locSD)
}
perf.mape[1] = abs(perf.pe[1])
perf.mse[1] = abs(perf.se[1])
for (i in 2:fx) {
perf.mape[i] = perf.mape[i-1] + abs(perf.pe[i])
perf.mape1[i] = perf.mape[i] / i
perf.mse[i] = perf.mse[i-1] + perf.se[i]
perf.mse1[i] = perf.mse[i] / i
}
perf.rmse = sqrt(perf.mse1)
bitmap(file='test2.png')
plot(forecast$pred, pch=19, type='b',main='ARIMA Extrapolation Forecast', ylab='Forecast and 95% CI', xlab='time',ylim=c(min(lb),max(ub)))
dum <- forecast$pred
dum[1:par1] <- x[(nx+1):lx]
lines(dum, lty=1)
lines(ub,lty=3)
lines(lb,lty=3)
dev.off()
load(file='createtable')
a<-table.start()
a<-table.row.start(a)
a<-table.element(a,'Univariate ARIMA Extrapolation Forecast',9,TRUE)
a<-table.row.end(a)
a<-table.row.start(a)
a<-table.element(a,'time',1,header=TRUE)
a<-table.element(a,'Y[t]',1,header=TRUE)
a<-table.element(a,'F[t]',1,header=TRUE)
a<-table.element(a,'95% LB',1,header=TRUE)
a<-table.element(a,'95% UB',1,header=TRUE)
a<-table.element(a,'p-value
(H0: Y[t] = F[t])',1,header=TRUE)
a<-table.element(a,'P(F[t]>Y[t-1])',1,header=TRUE)
a<-table.element(a,'P(F[t]>Y[t-s])',1,header=TRUE)
mylab <- paste('P(F[t]>Y[',nx,sep='')
mylab <- paste(mylab,'])',sep='')
a<-table.element(a,mylab,1,header=TRUE)
a<-table.row.end(a)
for (i in (nx-par5):nx) {
a<-table.row.start(a)
a<-table.element(a,i,header=TRUE)
a<-table.element(a,x[i])
a<-table.element(a,'-')
a<-table.row.end(a)
}
for (i in 1:fx) {
a<-table.row.start(a)
a<-table.element(a,nx+i,header=TRUE)
a<-table.element(a,round(x[nx+i],4))
a<-table.element(a,round(forecast$pred[i],4))
a<-table.element(a,round(lb[i],4))
a<-table.element(a,round(ub[i],4))
a<-table.element(a,round((1-prob.pval[i]),4))
a<-table.element(a,round((1-prob.dec[i]),4))
a<-table.element(a,round((1-prob.sdec[i]),4))
a<-table.element(a,round((1-prob.ldec[i]),4))
a<-table.row.end(a)
}
a<-table.end(a)
table.save(a,file='mytable.tab')
a<-table.start()
a<-table.row.start(a)
a<-table.element(a,'Univariate ARIMA Extrapolation Forecast Performance',7,TRUE)
a<-table.row.end(a)
a<-table.row.start(a)
a<-table.element(a,'time',1,header=TRUE)
a<-table.element(a,'% S.E.',1,header=TRUE)
a<-table.element(a,'PE',1,header=TRUE)
a<-table.element(a,'MAPE',1,header=TRUE)
a<-table.element(a,'Sq.E',1,header=TRUE)
a<-table.element(a,'MSE',1,header=TRUE)
a<-table.element(a,'RMSE',1,header=TRUE)
a<-table.row.end(a)
for (i in 1:fx) {
a<-table.row.start(a)
a<-table.element(a,nx+i,header=TRUE)
a<-table.element(a,round(perc.se[i],4))
a<-table.element(a,round(perf.pe[i],4))
a<-table.element(a,round(perf.mape1[i],4))
a<-table.element(a,round(perf.se[i],4))
a<-table.element(a,round(perf.mse1[i],4))
a<-table.element(a,round(perf.rmse[i],4))
a<-table.row.end(a)
}
a<-table.end(a)
table.save(a,file='mytable1.tab')