Free Statistics

of Irreproducible Research!

Author's title

Author*The author of this computation has been verified*
R Software Modulerwasp_arimaforecasting.wasp
Title produced by softwareARIMA Forecasting
Date of computationFri, 11 Dec 2009 10:56:15 -0700
Cite this page as followsStatistical Computations at FreeStatistics.org, Office for Research Development and Education, URL https://freestatistics.org/blog/index.php?v=date/2009/Dec/11/t126055445822ic6q1zy5ydht4.htm/, Retrieved Sun, 28 Apr 2024 21:09:49 +0000
Statistical Computations at FreeStatistics.org, Office for Research Development and Education, URL https://freestatistics.org/blog/index.php?pk=66617, Retrieved Sun, 28 Apr 2024 21:09:49 +0000
QR Codes:

Original text written by user:
IsPrivate?No (this computation is public)
User-defined keywords
Estimated Impact156
Family? (F = Feedback message, R = changed R code, M = changed R Module, P = changed Parameters, D = changed Data)
-       [ARIMA Forecasting] [] [2009-12-11 17:56:15] [d39d4e1021a28f94dc953cf77db656ab] [Current]
Feedback Forum

Post a new message
Dataseries X:
12008
9169
8788
8417
8247
8197
8236
8253
7733
8366
8626
8863
10102
8463
9114
8563
8872
8301
8301
8278
7736
7973
8268
9476
11100
8962
9173
8738
8459
8078
8411
8291
7810
8616
8312
9692
9911
8915
9452
9112
8472
8230
8384
8625
8221
8649
8625
10443
10357
8586
8892
8329
8101
7922
8120
7838
7735
8406
8209
9451
10041
9411
10405
8467
8464
8102
7627
7513
7510
8291
8064
9383


Summary of computational transaction
Raw Inputview raw input (R code)
Raw Outputview raw output of R engine
Computing time1 seconds
R Server'Gwilym Jenkins' @ 72.249.127.135

\begin{tabular}{lllllllll}
\hline
Summary of computational transaction \tabularnewline
Raw Input & view raw input (R code)  \tabularnewline
Raw Output & view raw output of R engine  \tabularnewline
Computing time & 1 seconds \tabularnewline
R Server & 'Gwilym Jenkins' @ 72.249.127.135 \tabularnewline
\hline
\end{tabular}
%Source: https://freestatistics.org/blog/index.php?pk=66617&T=0

[TABLE]
[ROW][C]Summary of computational transaction[/C][/ROW]
[ROW][C]Raw Input[/C][C]view raw input (R code) [/C][/ROW]
[ROW][C]Raw Output[/C][C]view raw output of R engine [/C][/ROW]
[ROW][C]Computing time[/C][C]1 seconds[/C][/ROW]
[ROW][C]R Server[/C][C]'Gwilym Jenkins' @ 72.249.127.135[/C][/ROW]
[/TABLE]
Source: https://freestatistics.org/blog/index.php?pk=66617&T=0

Globally Unique Identifier (entire table): ba.freestatistics.org/blog/index.php?pk=66617&T=0

As an alternative you can also use a QR Code:  

The GUIDs for individual cells are displayed in the table below:

Summary of computational transaction
Raw Inputview raw input (R code)
Raw Outputview raw output of R engine
Computing time1 seconds
R Server'Gwilym Jenkins' @ 72.249.127.135


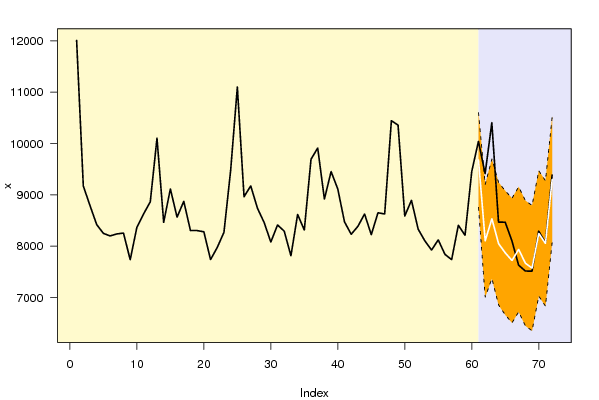
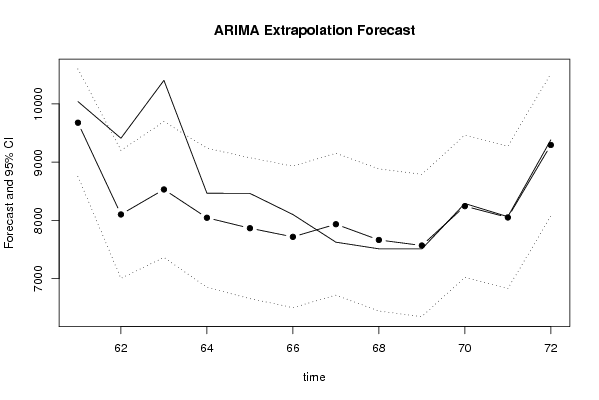
Univariate ARIMA Extrapolation Forecast
timeY[t]F[t]95% LB95% UBp-value(H0: Y[t] = F[t])P(F[t]>Y[t-1])P(F[t]>Y[t-s])P(F[t]>Y[60])
4810443-------
4910357-------
508586-------
518892-------
528329-------
538101-------
547922-------
558120-------
567838-------
577735-------
588406-------
598209-------
609451-------
61100419677.74268754.849810600.63530.22020.68490.07460.6849
6294118102.96937004.12939201.80930.00983e-040.19450.0081
63104058532.08957365.77319698.40598e-040.06980.27260.0613
6484678046.33986851.14099241.53880.24511e-040.32150.0106
6584647866.80976658.34239075.2770.16640.16520.3520.0051
6681027718.22156503.2688933.17510.26790.11450.37120.0026
6776277935.30316716.99089153.61540.30990.39430.38320.0074
6875137665.27566445.13318885.41810.40340.52450.39070.0021
6975107569.78766348.60548790.96980.46180.53630.39540.0013
7082918245.50097023.70919467.29280.47090.8810.39840.0266
7180648051.45826829.30069273.61590.4920.35040.40030.0124
7293839295.31388072.933210517.69440.44410.97580.40140.4014

\begin{tabular}{lllllllll}
\hline
Univariate ARIMA Extrapolation Forecast \tabularnewline
time & Y[t] & F[t] & 95% LB & 95% UB & p-value(H0: Y[t] = F[t]) & P(F[t]>Y[t-1]) & P(F[t]>Y[t-s]) & P(F[t]>Y[60]) \tabularnewline
48 & 10443 & - & - & - & - & - & - & - \tabularnewline
49 & 10357 & - & - & - & - & - & - & - \tabularnewline
50 & 8586 & - & - & - & - & - & - & - \tabularnewline
51 & 8892 & - & - & - & - & - & - & - \tabularnewline
52 & 8329 & - & - & - & - & - & - & - \tabularnewline
53 & 8101 & - & - & - & - & - & - & - \tabularnewline
54 & 7922 & - & - & - & - & - & - & - \tabularnewline
55 & 8120 & - & - & - & - & - & - & - \tabularnewline
56 & 7838 & - & - & - & - & - & - & - \tabularnewline
57 & 7735 & - & - & - & - & - & - & - \tabularnewline
58 & 8406 & - & - & - & - & - & - & - \tabularnewline
59 & 8209 & - & - & - & - & - & - & - \tabularnewline
60 & 9451 & - & - & - & - & - & - & - \tabularnewline
61 & 10041 & 9677.7426 & 8754.8498 & 10600.6353 & 0.2202 & 0.6849 & 0.0746 & 0.6849 \tabularnewline
62 & 9411 & 8102.9693 & 7004.1293 & 9201.8093 & 0.0098 & 3e-04 & 0.1945 & 0.0081 \tabularnewline
63 & 10405 & 8532.0895 & 7365.7731 & 9698.4059 & 8e-04 & 0.0698 & 0.2726 & 0.0613 \tabularnewline
64 & 8467 & 8046.3398 & 6851.1409 & 9241.5388 & 0.2451 & 1e-04 & 0.3215 & 0.0106 \tabularnewline
65 & 8464 & 7866.8097 & 6658.3423 & 9075.277 & 0.1664 & 0.1652 & 0.352 & 0.0051 \tabularnewline
66 & 8102 & 7718.2215 & 6503.268 & 8933.1751 & 0.2679 & 0.1145 & 0.3712 & 0.0026 \tabularnewline
67 & 7627 & 7935.3031 & 6716.9908 & 9153.6154 & 0.3099 & 0.3943 & 0.3832 & 0.0074 \tabularnewline
68 & 7513 & 7665.2756 & 6445.1331 & 8885.4181 & 0.4034 & 0.5245 & 0.3907 & 0.0021 \tabularnewline
69 & 7510 & 7569.7876 & 6348.6054 & 8790.9698 & 0.4618 & 0.5363 & 0.3954 & 0.0013 \tabularnewline
70 & 8291 & 8245.5009 & 7023.7091 & 9467.2928 & 0.4709 & 0.881 & 0.3984 & 0.0266 \tabularnewline
71 & 8064 & 8051.4582 & 6829.3006 & 9273.6159 & 0.492 & 0.3504 & 0.4003 & 0.0124 \tabularnewline
72 & 9383 & 9295.3138 & 8072.9332 & 10517.6944 & 0.4441 & 0.9758 & 0.4014 & 0.4014 \tabularnewline
\hline
\end{tabular}
%Source: https://freestatistics.org/blog/index.php?pk=66617&T=1

[TABLE]
[ROW][C]Univariate ARIMA Extrapolation Forecast[/C][/ROW]
[ROW][C]time[/C][C]Y[t][/C][C]F[t][/C][C]95% LB[/C][C]95% UB[/C][C]p-value(H0: Y[t] = F[t])[/C][C]P(F[t]>Y[t-1])[/C][C]P(F[t]>Y[t-s])[/C][C]P(F[t]>Y[60])[/C][/ROW]
[ROW][C]48[/C][C]10443[/C][C]-[/C][C]-[/C][C]-[/C][C]-[/C][C]-[/C][C]-[/C][C]-[/C][/ROW]
[ROW][C]49[/C][C]10357[/C][C]-[/C][C]-[/C][C]-[/C][C]-[/C][C]-[/C][C]-[/C][C]-[/C][/ROW]
[ROW][C]50[/C][C]8586[/C][C]-[/C][C]-[/C][C]-[/C][C]-[/C][C]-[/C][C]-[/C][C]-[/C][/ROW]
[ROW][C]51[/C][C]8892[/C][C]-[/C][C]-[/C][C]-[/C][C]-[/C][C]-[/C][C]-[/C][C]-[/C][/ROW]
[ROW][C]52[/C][C]8329[/C][C]-[/C][C]-[/C][C]-[/C][C]-[/C][C]-[/C][C]-[/C][C]-[/C][/ROW]
[ROW][C]53[/C][C]8101[/C][C]-[/C][C]-[/C][C]-[/C][C]-[/C][C]-[/C][C]-[/C][C]-[/C][/ROW]
[ROW][C]54[/C][C]7922[/C][C]-[/C][C]-[/C][C]-[/C][C]-[/C][C]-[/C][C]-[/C][C]-[/C][/ROW]
[ROW][C]55[/C][C]8120[/C][C]-[/C][C]-[/C][C]-[/C][C]-[/C][C]-[/C][C]-[/C][C]-[/C][/ROW]
[ROW][C]56[/C][C]7838[/C][C]-[/C][C]-[/C][C]-[/C][C]-[/C][C]-[/C][C]-[/C][C]-[/C][/ROW]
[ROW][C]57[/C][C]7735[/C][C]-[/C][C]-[/C][C]-[/C][C]-[/C][C]-[/C][C]-[/C][C]-[/C][/ROW]
[ROW][C]58[/C][C]8406[/C][C]-[/C][C]-[/C][C]-[/C][C]-[/C][C]-[/C][C]-[/C][C]-[/C][/ROW]
[ROW][C]59[/C][C]8209[/C][C]-[/C][C]-[/C][C]-[/C][C]-[/C][C]-[/C][C]-[/C][C]-[/C][/ROW]
[ROW][C]60[/C][C]9451[/C][C]-[/C][C]-[/C][C]-[/C][C]-[/C][C]-[/C][C]-[/C][C]-[/C][/ROW]
[ROW][C]61[/C][C]10041[/C][C]9677.7426[/C][C]8754.8498[/C][C]10600.6353[/C][C]0.2202[/C][C]0.6849[/C][C]0.0746[/C][C]0.6849[/C][/ROW]
[ROW][C]62[/C][C]9411[/C][C]8102.9693[/C][C]7004.1293[/C][C]9201.8093[/C][C]0.0098[/C][C]3e-04[/C][C]0.1945[/C][C]0.0081[/C][/ROW]
[ROW][C]63[/C][C]10405[/C][C]8532.0895[/C][C]7365.7731[/C][C]9698.4059[/C][C]8e-04[/C][C]0.0698[/C][C]0.2726[/C][C]0.0613[/C][/ROW]
[ROW][C]64[/C][C]8467[/C][C]8046.3398[/C][C]6851.1409[/C][C]9241.5388[/C][C]0.2451[/C][C]1e-04[/C][C]0.3215[/C][C]0.0106[/C][/ROW]
[ROW][C]65[/C][C]8464[/C][C]7866.8097[/C][C]6658.3423[/C][C]9075.277[/C][C]0.1664[/C][C]0.1652[/C][C]0.352[/C][C]0.0051[/C][/ROW]
[ROW][C]66[/C][C]8102[/C][C]7718.2215[/C][C]6503.268[/C][C]8933.1751[/C][C]0.2679[/C][C]0.1145[/C][C]0.3712[/C][C]0.0026[/C][/ROW]
[ROW][C]67[/C][C]7627[/C][C]7935.3031[/C][C]6716.9908[/C][C]9153.6154[/C][C]0.3099[/C][C]0.3943[/C][C]0.3832[/C][C]0.0074[/C][/ROW]
[ROW][C]68[/C][C]7513[/C][C]7665.2756[/C][C]6445.1331[/C][C]8885.4181[/C][C]0.4034[/C][C]0.5245[/C][C]0.3907[/C][C]0.0021[/C][/ROW]
[ROW][C]69[/C][C]7510[/C][C]7569.7876[/C][C]6348.6054[/C][C]8790.9698[/C][C]0.4618[/C][C]0.5363[/C][C]0.3954[/C][C]0.0013[/C][/ROW]
[ROW][C]70[/C][C]8291[/C][C]8245.5009[/C][C]7023.7091[/C][C]9467.2928[/C][C]0.4709[/C][C]0.881[/C][C]0.3984[/C][C]0.0266[/C][/ROW]
[ROW][C]71[/C][C]8064[/C][C]8051.4582[/C][C]6829.3006[/C][C]9273.6159[/C][C]0.492[/C][C]0.3504[/C][C]0.4003[/C][C]0.0124[/C][/ROW]
[ROW][C]72[/C][C]9383[/C][C]9295.3138[/C][C]8072.9332[/C][C]10517.6944[/C][C]0.4441[/C][C]0.9758[/C][C]0.4014[/C][C]0.4014[/C][/ROW]
[/TABLE]
Source: https://freestatistics.org/blog/index.php?pk=66617&T=1

Globally Unique Identifier (entire table): ba.freestatistics.org/blog/index.php?pk=66617&T=1

As an alternative you can also use a QR Code:  

The GUIDs for individual cells are displayed in the table below:

Univariate ARIMA Extrapolation Forecast
timeY[t]F[t]95% LB95% UBp-value(H0: Y[t] = F[t])P(F[t]>Y[t-1])P(F[t]>Y[t-s])P(F[t]>Y[60])
4810443-------
4910357-------
508586-------
518892-------
528329-------
538101-------
547922-------
558120-------
567838-------
577735-------
588406-------
598209-------
609451-------
61100419677.74268754.849810600.63530.22020.68490.07460.6849
6294118102.96937004.12939201.80930.00983e-040.19450.0081
63104058532.08957365.77319698.40598e-040.06980.27260.0613
6484678046.33986851.14099241.53880.24511e-040.32150.0106
6584647866.80976658.34239075.2770.16640.16520.3520.0051
6681027718.22156503.2688933.17510.26790.11450.37120.0026
6776277935.30316716.99089153.61540.30990.39430.38320.0074
6875137665.27566445.13318885.41810.40340.52450.39070.0021
6975107569.78766348.60548790.96980.46180.53630.39540.0013
7082918245.50097023.70919467.29280.47090.8810.39840.0266
7180648051.45826829.30069273.61590.4920.35040.40030.0124
7293839295.31388072.933210517.69440.44410.97580.40140.4014


Univariate ARIMA Extrapolation Forecast Performance
time% S.E.PEMAPESq.EMSERMSE
610.04870.03750131955.974100
620.06920.16140.09951710944.391921450.1825959.922
630.06970.21950.13953507793.85841783564.74121335.5017
640.07580.05230.1177176954.98531381912.30221175.5477
650.07840.07590.1093356636.29241176857.10021084.8304
660.08030.04970.0994147285.92481005261.90431002.6275
670.0783-0.03890.090795050.7893875231.745935.5382
680.0812-0.01990.081923187.8548768726.2588876.7704
690.0823-0.00790.07373574.5572683709.403826.8672
700.07560.00550.06692070.1656615545.4793784.5671
710.07740.00160.0609157.2955559601.099748.0649
720.06710.00940.05667688.8719513608.4134716.6648

\begin{tabular}{lllllllll}
\hline
Univariate ARIMA Extrapolation Forecast Performance \tabularnewline
time & % S.E. & PE & MAPE & Sq.E & MSE & RMSE \tabularnewline
61 & 0.0487 & 0.0375 & 0 & 131955.9741 & 0 & 0 \tabularnewline
62 & 0.0692 & 0.1614 & 0.0995 & 1710944.391 & 921450.1825 & 959.922 \tabularnewline
63 & 0.0697 & 0.2195 & 0.1395 & 3507793.8584 & 1783564.7412 & 1335.5017 \tabularnewline
64 & 0.0758 & 0.0523 & 0.1177 & 176954.9853 & 1381912.3022 & 1175.5477 \tabularnewline
65 & 0.0784 & 0.0759 & 0.1093 & 356636.2924 & 1176857.1002 & 1084.8304 \tabularnewline
66 & 0.0803 & 0.0497 & 0.0994 & 147285.9248 & 1005261.9043 & 1002.6275 \tabularnewline
67 & 0.0783 & -0.0389 & 0.0907 & 95050.7893 & 875231.745 & 935.5382 \tabularnewline
68 & 0.0812 & -0.0199 & 0.0819 & 23187.8548 & 768726.2588 & 876.7704 \tabularnewline
69 & 0.0823 & -0.0079 & 0.0737 & 3574.5572 & 683709.403 & 826.8672 \tabularnewline
70 & 0.0756 & 0.0055 & 0.0669 & 2070.1656 & 615545.4793 & 784.5671 \tabularnewline
71 & 0.0774 & 0.0016 & 0.0609 & 157.2955 & 559601.099 & 748.0649 \tabularnewline
72 & 0.0671 & 0.0094 & 0.0566 & 7688.8719 & 513608.4134 & 716.6648 \tabularnewline
\hline
\end{tabular}
%Source: https://freestatistics.org/blog/index.php?pk=66617&T=2

[TABLE]
[ROW][C]Univariate ARIMA Extrapolation Forecast Performance[/C][/ROW]
[ROW][C]time[/C][C]% S.E.[/C][C]PE[/C][C]MAPE[/C][C]Sq.E[/C][C]MSE[/C][C]RMSE[/C][/ROW]
[ROW][C]61[/C][C]0.0487[/C][C]0.0375[/C][C]0[/C][C]131955.9741[/C][C]0[/C][C]0[/C][/ROW]
[ROW][C]62[/C][C]0.0692[/C][C]0.1614[/C][C]0.0995[/C][C]1710944.391[/C][C]921450.1825[/C][C]959.922[/C][/ROW]
[ROW][C]63[/C][C]0.0697[/C][C]0.2195[/C][C]0.1395[/C][C]3507793.8584[/C][C]1783564.7412[/C][C]1335.5017[/C][/ROW]
[ROW][C]64[/C][C]0.0758[/C][C]0.0523[/C][C]0.1177[/C][C]176954.9853[/C][C]1381912.3022[/C][C]1175.5477[/C][/ROW]
[ROW][C]65[/C][C]0.0784[/C][C]0.0759[/C][C]0.1093[/C][C]356636.2924[/C][C]1176857.1002[/C][C]1084.8304[/C][/ROW]
[ROW][C]66[/C][C]0.0803[/C][C]0.0497[/C][C]0.0994[/C][C]147285.9248[/C][C]1005261.9043[/C][C]1002.6275[/C][/ROW]
[ROW][C]67[/C][C]0.0783[/C][C]-0.0389[/C][C]0.0907[/C][C]95050.7893[/C][C]875231.745[/C][C]935.5382[/C][/ROW]
[ROW][C]68[/C][C]0.0812[/C][C]-0.0199[/C][C]0.0819[/C][C]23187.8548[/C][C]768726.2588[/C][C]876.7704[/C][/ROW]
[ROW][C]69[/C][C]0.0823[/C][C]-0.0079[/C][C]0.0737[/C][C]3574.5572[/C][C]683709.403[/C][C]826.8672[/C][/ROW]
[ROW][C]70[/C][C]0.0756[/C][C]0.0055[/C][C]0.0669[/C][C]2070.1656[/C][C]615545.4793[/C][C]784.5671[/C][/ROW]
[ROW][C]71[/C][C]0.0774[/C][C]0.0016[/C][C]0.0609[/C][C]157.2955[/C][C]559601.099[/C][C]748.0649[/C][/ROW]
[ROW][C]72[/C][C]0.0671[/C][C]0.0094[/C][C]0.0566[/C][C]7688.8719[/C][C]513608.4134[/C][C]716.6648[/C][/ROW]
[/TABLE]
Source: https://freestatistics.org/blog/index.php?pk=66617&T=2

Globally Unique Identifier (entire table): ba.freestatistics.org/blog/index.php?pk=66617&T=2

As an alternative you can also use a QR Code:  

The GUIDs for individual cells are displayed in the table below:

Univariate ARIMA Extrapolation Forecast Performance
time% S.E.PEMAPESq.EMSERMSE
610.04870.03750131955.974100
620.06920.16140.09951710944.391921450.1825959.922
630.06970.21950.13953507793.85841783564.74121335.5017
640.07580.05230.1177176954.98531381912.30221175.5477
650.07840.07590.1093356636.29241176857.10021084.8304
660.08030.04970.0994147285.92481005261.90431002.6275
670.0783-0.03890.090795050.7893875231.745935.5382
680.0812-0.01990.081923187.8548768726.2588876.7704
690.0823-0.00790.07373574.5572683709.403826.8672
700.07560.00550.06692070.1656615545.4793784.5671
710.07740.00160.0609157.2955559601.099748.0649
720.06710.00940.05667688.8719513608.4134716.6648


Parameters (Session):
par1 = 12 ; par2 = 1 ; par3 = 1 ; par4 = 1 ; par5 = 12 ; par6 = 1 ; par7 = 1 ; par8 = 0 ; par9 = 0 ; par10 = FALSE ;
Parameters (R input):
par1 = 12 ; par2 = 1 ; par3 = 1 ; par4 = 1 ; par5 = 12 ; par6 = 1 ; par7 = 1 ; par8 = 0 ; par9 = 0 ; par10 = FALSE ;
R code (references can be found in the software module):
par1 <- as.numeric(par1) #cut off periods
par2 <- as.numeric(par2) #lambda
par3 <- as.numeric(par3) #degree of non-seasonal differencing
par4 <- as.numeric(par4) #degree of seasonal differencing
par5 <- as.numeric(par5) #seasonal period
par6 <- as.numeric(par6) #p
par7 <- as.numeric(par7) #q
par8 <- as.numeric(par8) #P
par9 <- as.numeric(par9) #Q
if (par10 == 'TRUE') par10 <- TRUE
if (par10 == 'FALSE') par10 <- FALSE
if (par2 == 0) x <- log(x)
if (par2 != 0) x <- x^par2
lx <- length(x)
first <- lx - 2*par1
nx <- lx - par1
nx1 <- nx + 1
fx <- lx - nx
if (fx < 1) {
fx <- par5
nx1 <- lx + fx - 1
first <- lx - 2*fx
}
first <- 1
if (fx < 3) fx <- round(lx/10,0)
(arima.out <- arima(x[1:nx], order=c(par6,par3,par7), seasonal=list(order=c(par8,par4,par9), period=par5), include.mean=par10, method='ML'))
(forecast <- predict(arima.out,par1))
(lb <- forecast$pred - 1.96 * forecast$se)
(ub <- forecast$pred + 1.96 * forecast$se)
if (par2 == 0) {
x <- exp(x)
forecast$pred <- exp(forecast$pred)
lb <- exp(lb)
ub <- exp(ub)
}
if (par2 != 0) {
x <- x^(1/par2)
forecast$pred <- forecast$pred^(1/par2)
lb <- lb^(1/par2)
ub <- ub^(1/par2)
}
if (par2 < 0) {
olb <- lb
lb <- ub
ub <- olb
}
(actandfor <- c(x[1:nx], forecast$pred))
(perc.se <- (ub-forecast$pred)/1.96/forecast$pred)
bitmap(file='test1.png')
opar <- par(mar=c(4,4,2,2),las=1)
ylim <- c( min(x[first:nx],lb), max(x[first:nx],ub))
plot(x,ylim=ylim,type='n',xlim=c(first,lx))
usr <- par('usr')
rect(usr[1],usr[3],nx+1,usr[4],border=NA,col='lemonchiffon')
rect(nx1,usr[3],usr[2],usr[4],border=NA,col='lavender')
abline(h= (-3:3)*2 , col ='gray', lty =3)
polygon( c(nx1:lx,lx:nx1), c(lb,rev(ub)), col = 'orange', lty=2,border=NA)
lines(nx1:lx, lb , lty=2)
lines(nx1:lx, ub , lty=2)
lines(x, lwd=2)
lines(nx1:lx, forecast$pred , lwd=2 , col ='white')
box()
par(opar)
dev.off()
prob.dec <- array(NA, dim=fx)
prob.sdec <- array(NA, dim=fx)
prob.ldec <- array(NA, dim=fx)
prob.pval <- array(NA, dim=fx)
perf.pe <- array(0, dim=fx)
perf.mape <- array(0, dim=fx)
perf.mape1 <- array(0, dim=fx)
perf.se <- array(0, dim=fx)
perf.mse <- array(0, dim=fx)
perf.mse1 <- array(0, dim=fx)
perf.rmse <- array(0, dim=fx)
for (i in 1:fx) {
locSD <- (ub[i] - forecast$pred[i]) / 1.96
perf.pe[i] = (x[nx+i] - forecast$pred[i]) / forecast$pred[i]
perf.se[i] = (x[nx+i] - forecast$pred[i])^2
prob.dec[i] = pnorm((x[nx+i-1] - forecast$pred[i]) / locSD)
prob.sdec[i] = pnorm((x[nx+i-par5] - forecast$pred[i]) / locSD)
prob.ldec[i] = pnorm((x[nx] - forecast$pred[i]) / locSD)
prob.pval[i] = pnorm(abs(x[nx+i] - forecast$pred[i]) / locSD)
}
perf.mape[1] = abs(perf.pe[1])
perf.mse[1] = abs(perf.se[1])
for (i in 2:fx) {
perf.mape[i] = perf.mape[i-1] + abs(perf.pe[i])
perf.mape1[i] = perf.mape[i] / i
perf.mse[i] = perf.mse[i-1] + perf.se[i]
perf.mse1[i] = perf.mse[i] / i
}
perf.rmse = sqrt(perf.mse1)
bitmap(file='test2.png')
plot(forecast$pred, pch=19, type='b',main='ARIMA Extrapolation Forecast', ylab='Forecast and 95% CI', xlab='time',ylim=c(min(lb),max(ub)))
dum <- forecast$pred
dum[1:par1] <- x[(nx+1):lx]
lines(dum, lty=1)
lines(ub,lty=3)
lines(lb,lty=3)
dev.off()
load(file='createtable')
a<-table.start()
a<-table.row.start(a)
a<-table.element(a,'Univariate ARIMA Extrapolation Forecast',9,TRUE)
a<-table.row.end(a)
a<-table.row.start(a)
a<-table.element(a,'time',1,header=TRUE)
a<-table.element(a,'Y[t]',1,header=TRUE)
a<-table.element(a,'F[t]',1,header=TRUE)
a<-table.element(a,'95% LB',1,header=TRUE)
a<-table.element(a,'95% UB',1,header=TRUE)
a<-table.element(a,'p-value
(H0: Y[t] = F[t])',1,header=TRUE)
a<-table.element(a,'P(F[t]>Y[t-1])',1,header=TRUE)
a<-table.element(a,'P(F[t]>Y[t-s])',1,header=TRUE)
mylab <- paste('P(F[t]>Y[',nx,sep='')
mylab <- paste(mylab,'])',sep='')
a<-table.element(a,mylab,1,header=TRUE)
a<-table.row.end(a)
for (i in (nx-par5):nx) {
a<-table.row.start(a)
a<-table.element(a,i,header=TRUE)
a<-table.element(a,x[i])
a<-table.element(a,'-')
a<-table.row.end(a)
}
for (i in 1:fx) {
a<-table.row.start(a)
a<-table.element(a,nx+i,header=TRUE)
a<-table.element(a,round(x[nx+i],4))
a<-table.element(a,round(forecast$pred[i],4))
a<-table.element(a,round(lb[i],4))
a<-table.element(a,round(ub[i],4))
a<-table.element(a,round((1-prob.pval[i]),4))
a<-table.element(a,round((1-prob.dec[i]),4))
a<-table.element(a,round((1-prob.sdec[i]),4))
a<-table.element(a,round((1-prob.ldec[i]),4))
a<-table.row.end(a)
}
a<-table.end(a)
table.save(a,file='mytable.tab')
a<-table.start()
a<-table.row.start(a)
a<-table.element(a,'Univariate ARIMA Extrapolation Forecast Performance',7,TRUE)
a<-table.row.end(a)
a<-table.row.start(a)
a<-table.element(a,'time',1,header=TRUE)
a<-table.element(a,'% S.E.',1,header=TRUE)
a<-table.element(a,'PE',1,header=TRUE)
a<-table.element(a,'MAPE',1,header=TRUE)
a<-table.element(a,'Sq.E',1,header=TRUE)
a<-table.element(a,'MSE',1,header=TRUE)
a<-table.element(a,'RMSE',1,header=TRUE)
a<-table.row.end(a)
for (i in 1:fx) {
a<-table.row.start(a)
a<-table.element(a,nx+i,header=TRUE)
a<-table.element(a,round(perc.se[i],4))
a<-table.element(a,round(perf.pe[i],4))
a<-table.element(a,round(perf.mape1[i],4))
a<-table.element(a,round(perf.se[i],4))
a<-table.element(a,round(perf.mse1[i],4))
a<-table.element(a,round(perf.rmse[i],4))
a<-table.row.end(a)
}
a<-table.end(a)
table.save(a,file='mytable1.tab')