Free Statistics

of Irreproducible Research!

Author's title

Author*The author of this computation has been verified*
R Software Modulerwasp_arimaforecasting.wasp
Title produced by softwareARIMA Forecasting
Date of computationFri, 11 Dec 2009 10:36:19 -0700
Cite this page as followsStatistical Computations at FreeStatistics.org, Office for Research Development and Education, URL https://freestatistics.org/blog/index.php?v=date/2009/Dec/11/t1260553050idgrqwo5zlx8szb.htm/, Retrieved Sun, 28 Apr 2024 20:43:34 +0000
Statistical Computations at FreeStatistics.org, Office for Research Development and Education, URL https://freestatistics.org/blog/index.php?pk=66596, Retrieved Sun, 28 Apr 2024 20:43:34 +0000
QR Codes:

Original text written by user:
IsPrivate?No (this computation is public)
User-defined keywordsSHWWS10
Estimated Impact185
Family? (F = Feedback message, R = changed R code, M = changed R Module, P = changed Parameters, D = changed Data)
-     [ARIMA Forecasting] [] [2009-12-07 09:54:52] [b98453cac15ba1066b407e146608df68]
F   PD    [ARIMA Forecasting] [Arima Forecast] [2009-12-11 17:36:19] [d1081bd6cdf1fed9ed45c42dbd523bf1] [Current]
- RMP       [ARIMA Backward Selection] [WS 10 Review 2 arima] [2009-12-17 10:46:44] [83058a88a37d754675a5cd22dab372fc]
- R P       [ARIMA Forecasting] [WS 10 2] [2009-12-17 10:50:24] [83058a88a37d754675a5cd22dab372fc]
Feedback Forum
2009-12-17 10:51:57 [Brecht Thijs] [reply
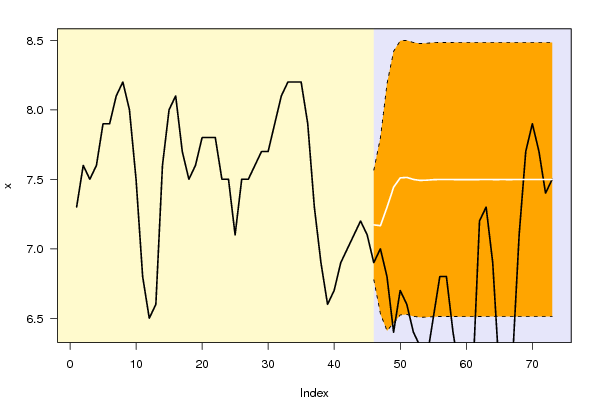
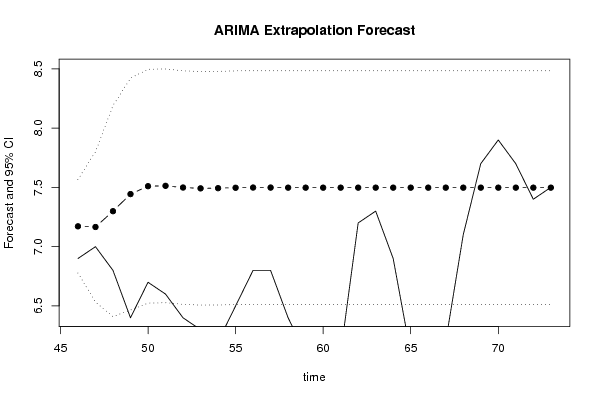
Ik denk dat deze 'vreemde' grafiek het gevolg is van de grote testing
period ten opzichte van de lengt van de reeks. De testing
period staat ingesteld op 28 periodes waardoor de de calculator
slechts 44 periodes kan gebruiken om een reeks te voorspellen
met relatief grote schommelingen. Dit zie je ook duidelijk aan
het betrouwbaarheidsinterval dat zeer groot is.

De forecast die wordt gemaakt verschilt niet veel van een random walk
voorspelling. De reden dat de echte waarden niet binne het interval liggen
heeft te maken met de grote (onverwachte daling). Waardes die buiten
het interval liggen kunnen niet toegewezen worden aan het toeval. ER zullen
waarschijnlijk invloeden van buitenaf meespelen waardoor de ceteris paribus
voorwaarde niet langer opgaat. (ik vermoed dat de gebruikte reeks die van inflatie is, gezien de economische situatie van de afgelopen tijd is dit dus perfect plausibel en verklaarbaar)

Wanneer je de forecast op een kortere periode uitvoert wordt mijn stelling
bevestigd:
testing period= 12
http://www.freestatistics.org/blog/index.php?v=date/2009/Dec/17/t12610470656570ii3in81gsti.htm/

Daarnaast wil ik nog even stellen dat ik twijfel over je ARIMA waarden,
kan dit misschien nog eens even checken en eventueel verbeteringen aanbrengen.

Post a new message
Dataseries X:
7.3
7.6
7.5
7.6
7.9
7.9
8.1
8.2
8
7.5
6.8
6.5
6.6
7.6
8
8.1
7.7
7.5
7.6
7.8
7.8
7.8
7.5
7.5
7.1
7.5
7.5
7.6
7.7
7.7
7.9
8.1
8.2
8.2
8.2
7.9
7.3
6.9
6.6
6.7
6.9
7
7.1
7.2
7.1
6.9
7
6.8
6.4
6.7
6.6
6.4
6.3
6.2
6.5
6.8
6.8
6.4
6.1
5.8
6.1
7.2
7.3
6.9
6.1
5.8
6.2
7.1
7.7
7.9
7.7
7.4
7.5


Summary of computational transaction
Raw Inputview raw input (R code)
Raw Outputview raw output of R engine
Computing time1 seconds
R Server'Gwilym Jenkins' @ 72.249.127.135

\begin{tabular}{lllllllll}
\hline
Summary of computational transaction \tabularnewline
Raw Input & view raw input (R code)  \tabularnewline
Raw Output & view raw output of R engine  \tabularnewline
Computing time & 1 seconds \tabularnewline
R Server & 'Gwilym Jenkins' @ 72.249.127.135 \tabularnewline
\hline
\end{tabular}
%Source: https://freestatistics.org/blog/index.php?pk=66596&T=0

[TABLE]
[ROW][C]Summary of computational transaction[/C][/ROW]
[ROW][C]Raw Input[/C][C]view raw input (R code) [/C][/ROW]
[ROW][C]Raw Output[/C][C]view raw output of R engine [/C][/ROW]
[ROW][C]Computing time[/C][C]1 seconds[/C][/ROW]
[ROW][C]R Server[/C][C]'Gwilym Jenkins' @ 72.249.127.135[/C][/ROW]
[/TABLE]
Source: https://freestatistics.org/blog/index.php?pk=66596&T=0

Globally Unique Identifier (entire table): ba.freestatistics.org/blog/index.php?pk=66596&T=0

As an alternative you can also use a QR Code:  

The GUIDs for individual cells are displayed in the table below:

Summary of computational transaction
Raw Inputview raw input (R code)
Raw Outputview raw output of R engine
Computing time1 seconds
R Server'Gwilym Jenkins' @ 72.249.127.135


Univariate ARIMA Extrapolation Forecast
timeY[t]F[t]95% LB95% UBp-value(H0: Y[t] = F[t])P(F[t]>Y[t-1])P(F[t]>Y[t-s])P(F[t]>Y[45])
338.2-------
348.2-------
358.2-------
367.9-------
377.3-------
386.9-------
396.6-------
406.7-------
416.9-------
427-------
437.1-------
447.2-------
457.1-------
466.97.17176.77737.56620.08850.639300.6393
4777.1666.53147.80060.30410.79437e-040.5808
486.87.29946.40988.18890.13560.74520.09290.6698
496.47.44366.46588.42130.01820.90150.61320.7545
506.77.51026.52378.49670.05370.98630.88730.7925
516.67.51346.52768.49910.03470.94710.96530.7944
526.47.49896.51398.48380.01440.96320.94410.7863
536.37.49196.50718.47670.00880.98510.88060.7823
546.27.49356.50828.47890.0050.99120.83690.7831
556.57.49716.51138.48280.02370.9950.78510.7851
566.87.49876.51298.48450.08240.97650.72370.786
576.87.49856.51288.48430.08240.91760.78590.7859
586.47.4986.51238.48360.01450.91740.88280.7856
596.17.49776.5128.48340.00270.98550.83880.7855
605.87.49776.5128.48344e-040.99730.91730.7855
616.17.49796.51218.48360.00270.99960.98550.7856
627.27.49796.51228.48360.27680.99730.94370.7856
637.37.49796.51228.48360.3470.72320.96290.7856
646.97.49796.51228.48360.11730.6530.98550.7856
656.17.49796.51228.48360.00270.88270.99140.7856
665.87.49796.51228.48364e-040.99730.99510.7856
676.27.49796.51228.48360.00490.99960.97640.7856
687.17.49796.51228.48360.21440.99510.91740.7856
697.77.49796.51228.48360.34390.78560.91740.7856
707.97.49796.51228.48360.2120.34390.98550.7856
717.77.49796.51228.48360.34390.2120.99730.7856
727.47.49796.51228.48360.42290.34390.99960.7856
737.57.49796.51228.48360.49830.57710.99730.7856

\begin{tabular}{lllllllll}
\hline
Univariate ARIMA Extrapolation Forecast \tabularnewline
time & Y[t] & F[t] & 95% LB & 95% UB & p-value(H0: Y[t] = F[t]) & P(F[t]>Y[t-1]) & P(F[t]>Y[t-s]) & P(F[t]>Y[45]) \tabularnewline
33 & 8.2 & - & - & - & - & - & - & - \tabularnewline
34 & 8.2 & - & - & - & - & - & - & - \tabularnewline
35 & 8.2 & - & - & - & - & - & - & - \tabularnewline
36 & 7.9 & - & - & - & - & - & - & - \tabularnewline
37 & 7.3 & - & - & - & - & - & - & - \tabularnewline
38 & 6.9 & - & - & - & - & - & - & - \tabularnewline
39 & 6.6 & - & - & - & - & - & - & - \tabularnewline
40 & 6.7 & - & - & - & - & - & - & - \tabularnewline
41 & 6.9 & - & - & - & - & - & - & - \tabularnewline
42 & 7 & - & - & - & - & - & - & - \tabularnewline
43 & 7.1 & - & - & - & - & - & - & - \tabularnewline
44 & 7.2 & - & - & - & - & - & - & - \tabularnewline
45 & 7.1 & - & - & - & - & - & - & - \tabularnewline
46 & 6.9 & 7.1717 & 6.7773 & 7.5662 & 0.0885 & 0.6393 & 0 & 0.6393 \tabularnewline
47 & 7 & 7.166 & 6.5314 & 7.8006 & 0.3041 & 0.7943 & 7e-04 & 0.5808 \tabularnewline
48 & 6.8 & 7.2994 & 6.4098 & 8.1889 & 0.1356 & 0.7452 & 0.0929 & 0.6698 \tabularnewline
49 & 6.4 & 7.4436 & 6.4658 & 8.4213 & 0.0182 & 0.9015 & 0.6132 & 0.7545 \tabularnewline
50 & 6.7 & 7.5102 & 6.5237 & 8.4967 & 0.0537 & 0.9863 & 0.8873 & 0.7925 \tabularnewline
51 & 6.6 & 7.5134 & 6.5276 & 8.4991 & 0.0347 & 0.9471 & 0.9653 & 0.7944 \tabularnewline
52 & 6.4 & 7.4989 & 6.5139 & 8.4838 & 0.0144 & 0.9632 & 0.9441 & 0.7863 \tabularnewline
53 & 6.3 & 7.4919 & 6.5071 & 8.4767 & 0.0088 & 0.9851 & 0.8806 & 0.7823 \tabularnewline
54 & 6.2 & 7.4935 & 6.5082 & 8.4789 & 0.005 & 0.9912 & 0.8369 & 0.7831 \tabularnewline
55 & 6.5 & 7.4971 & 6.5113 & 8.4828 & 0.0237 & 0.995 & 0.7851 & 0.7851 \tabularnewline
56 & 6.8 & 7.4987 & 6.5129 & 8.4845 & 0.0824 & 0.9765 & 0.7237 & 0.786 \tabularnewline
57 & 6.8 & 7.4985 & 6.5128 & 8.4843 & 0.0824 & 0.9176 & 0.7859 & 0.7859 \tabularnewline
58 & 6.4 & 7.498 & 6.5123 & 8.4836 & 0.0145 & 0.9174 & 0.8828 & 0.7856 \tabularnewline
59 & 6.1 & 7.4977 & 6.512 & 8.4834 & 0.0027 & 0.9855 & 0.8388 & 0.7855 \tabularnewline
60 & 5.8 & 7.4977 & 6.512 & 8.4834 & 4e-04 & 0.9973 & 0.9173 & 0.7855 \tabularnewline
61 & 6.1 & 7.4979 & 6.5121 & 8.4836 & 0.0027 & 0.9996 & 0.9855 & 0.7856 \tabularnewline
62 & 7.2 & 7.4979 & 6.5122 & 8.4836 & 0.2768 & 0.9973 & 0.9437 & 0.7856 \tabularnewline
63 & 7.3 & 7.4979 & 6.5122 & 8.4836 & 0.347 & 0.7232 & 0.9629 & 0.7856 \tabularnewline
64 & 6.9 & 7.4979 & 6.5122 & 8.4836 & 0.1173 & 0.653 & 0.9855 & 0.7856 \tabularnewline
65 & 6.1 & 7.4979 & 6.5122 & 8.4836 & 0.0027 & 0.8827 & 0.9914 & 0.7856 \tabularnewline
66 & 5.8 & 7.4979 & 6.5122 & 8.4836 & 4e-04 & 0.9973 & 0.9951 & 0.7856 \tabularnewline
67 & 6.2 & 7.4979 & 6.5122 & 8.4836 & 0.0049 & 0.9996 & 0.9764 & 0.7856 \tabularnewline
68 & 7.1 & 7.4979 & 6.5122 & 8.4836 & 0.2144 & 0.9951 & 0.9174 & 0.7856 \tabularnewline
69 & 7.7 & 7.4979 & 6.5122 & 8.4836 & 0.3439 & 0.7856 & 0.9174 & 0.7856 \tabularnewline
70 & 7.9 & 7.4979 & 6.5122 & 8.4836 & 0.212 & 0.3439 & 0.9855 & 0.7856 \tabularnewline
71 & 7.7 & 7.4979 & 6.5122 & 8.4836 & 0.3439 & 0.212 & 0.9973 & 0.7856 \tabularnewline
72 & 7.4 & 7.4979 & 6.5122 & 8.4836 & 0.4229 & 0.3439 & 0.9996 & 0.7856 \tabularnewline
73 & 7.5 & 7.4979 & 6.5122 & 8.4836 & 0.4983 & 0.5771 & 0.9973 & 0.7856 \tabularnewline
\hline
\end{tabular}
%Source: https://freestatistics.org/blog/index.php?pk=66596&T=1

[TABLE]
[ROW][C]Univariate ARIMA Extrapolation Forecast[/C][/ROW]
[ROW][C]time[/C][C]Y[t][/C][C]F[t][/C][C]95% LB[/C][C]95% UB[/C][C]p-value(H0: Y[t] = F[t])[/C][C]P(F[t]>Y[t-1])[/C][C]P(F[t]>Y[t-s])[/C][C]P(F[t]>Y[45])[/C][/ROW]
[ROW][C]33[/C][C]8.2[/C][C]-[/C][C]-[/C][C]-[/C][C]-[/C][C]-[/C][C]-[/C][C]-[/C][/ROW]
[ROW][C]34[/C][C]8.2[/C][C]-[/C][C]-[/C][C]-[/C][C]-[/C][C]-[/C][C]-[/C][C]-[/C][/ROW]
[ROW][C]35[/C][C]8.2[/C][C]-[/C][C]-[/C][C]-[/C][C]-[/C][C]-[/C][C]-[/C][C]-[/C][/ROW]
[ROW][C]36[/C][C]7.9[/C][C]-[/C][C]-[/C][C]-[/C][C]-[/C][C]-[/C][C]-[/C][C]-[/C][/ROW]
[ROW][C]37[/C][C]7.3[/C][C]-[/C][C]-[/C][C]-[/C][C]-[/C][C]-[/C][C]-[/C][C]-[/C][/ROW]
[ROW][C]38[/C][C]6.9[/C][C]-[/C][C]-[/C][C]-[/C][C]-[/C][C]-[/C][C]-[/C][C]-[/C][/ROW]
[ROW][C]39[/C][C]6.6[/C][C]-[/C][C]-[/C][C]-[/C][C]-[/C][C]-[/C][C]-[/C][C]-[/C][/ROW]
[ROW][C]40[/C][C]6.7[/C][C]-[/C][C]-[/C][C]-[/C][C]-[/C][C]-[/C][C]-[/C][C]-[/C][/ROW]
[ROW][C]41[/C][C]6.9[/C][C]-[/C][C]-[/C][C]-[/C][C]-[/C][C]-[/C][C]-[/C][C]-[/C][/ROW]
[ROW][C]42[/C][C]7[/C][C]-[/C][C]-[/C][C]-[/C][C]-[/C][C]-[/C][C]-[/C][C]-[/C][/ROW]
[ROW][C]43[/C][C]7.1[/C][C]-[/C][C]-[/C][C]-[/C][C]-[/C][C]-[/C][C]-[/C][C]-[/C][/ROW]
[ROW][C]44[/C][C]7.2[/C][C]-[/C][C]-[/C][C]-[/C][C]-[/C][C]-[/C][C]-[/C][C]-[/C][/ROW]
[ROW][C]45[/C][C]7.1[/C][C]-[/C][C]-[/C][C]-[/C][C]-[/C][C]-[/C][C]-[/C][C]-[/C][/ROW]
[ROW][C]46[/C][C]6.9[/C][C]7.1717[/C][C]6.7773[/C][C]7.5662[/C][C]0.0885[/C][C]0.6393[/C][C]0[/C][C]0.6393[/C][/ROW]
[ROW][C]47[/C][C]7[/C][C]7.166[/C][C]6.5314[/C][C]7.8006[/C][C]0.3041[/C][C]0.7943[/C][C]7e-04[/C][C]0.5808[/C][/ROW]
[ROW][C]48[/C][C]6.8[/C][C]7.2994[/C][C]6.4098[/C][C]8.1889[/C][C]0.1356[/C][C]0.7452[/C][C]0.0929[/C][C]0.6698[/C][/ROW]
[ROW][C]49[/C][C]6.4[/C][C]7.4436[/C][C]6.4658[/C][C]8.4213[/C][C]0.0182[/C][C]0.9015[/C][C]0.6132[/C][C]0.7545[/C][/ROW]
[ROW][C]50[/C][C]6.7[/C][C]7.5102[/C][C]6.5237[/C][C]8.4967[/C][C]0.0537[/C][C]0.9863[/C][C]0.8873[/C][C]0.7925[/C][/ROW]
[ROW][C]51[/C][C]6.6[/C][C]7.5134[/C][C]6.5276[/C][C]8.4991[/C][C]0.0347[/C][C]0.9471[/C][C]0.9653[/C][C]0.7944[/C][/ROW]
[ROW][C]52[/C][C]6.4[/C][C]7.4989[/C][C]6.5139[/C][C]8.4838[/C][C]0.0144[/C][C]0.9632[/C][C]0.9441[/C][C]0.7863[/C][/ROW]
[ROW][C]53[/C][C]6.3[/C][C]7.4919[/C][C]6.5071[/C][C]8.4767[/C][C]0.0088[/C][C]0.9851[/C][C]0.8806[/C][C]0.7823[/C][/ROW]
[ROW][C]54[/C][C]6.2[/C][C]7.4935[/C][C]6.5082[/C][C]8.4789[/C][C]0.005[/C][C]0.9912[/C][C]0.8369[/C][C]0.7831[/C][/ROW]
[ROW][C]55[/C][C]6.5[/C][C]7.4971[/C][C]6.5113[/C][C]8.4828[/C][C]0.0237[/C][C]0.995[/C][C]0.7851[/C][C]0.7851[/C][/ROW]
[ROW][C]56[/C][C]6.8[/C][C]7.4987[/C][C]6.5129[/C][C]8.4845[/C][C]0.0824[/C][C]0.9765[/C][C]0.7237[/C][C]0.786[/C][/ROW]
[ROW][C]57[/C][C]6.8[/C][C]7.4985[/C][C]6.5128[/C][C]8.4843[/C][C]0.0824[/C][C]0.9176[/C][C]0.7859[/C][C]0.7859[/C][/ROW]
[ROW][C]58[/C][C]6.4[/C][C]7.498[/C][C]6.5123[/C][C]8.4836[/C][C]0.0145[/C][C]0.9174[/C][C]0.8828[/C][C]0.7856[/C][/ROW]
[ROW][C]59[/C][C]6.1[/C][C]7.4977[/C][C]6.512[/C][C]8.4834[/C][C]0.0027[/C][C]0.9855[/C][C]0.8388[/C][C]0.7855[/C][/ROW]
[ROW][C]60[/C][C]5.8[/C][C]7.4977[/C][C]6.512[/C][C]8.4834[/C][C]4e-04[/C][C]0.9973[/C][C]0.9173[/C][C]0.7855[/C][/ROW]
[ROW][C]61[/C][C]6.1[/C][C]7.4979[/C][C]6.5121[/C][C]8.4836[/C][C]0.0027[/C][C]0.9996[/C][C]0.9855[/C][C]0.7856[/C][/ROW]
[ROW][C]62[/C][C]7.2[/C][C]7.4979[/C][C]6.5122[/C][C]8.4836[/C][C]0.2768[/C][C]0.9973[/C][C]0.9437[/C][C]0.7856[/C][/ROW]
[ROW][C]63[/C][C]7.3[/C][C]7.4979[/C][C]6.5122[/C][C]8.4836[/C][C]0.347[/C][C]0.7232[/C][C]0.9629[/C][C]0.7856[/C][/ROW]
[ROW][C]64[/C][C]6.9[/C][C]7.4979[/C][C]6.5122[/C][C]8.4836[/C][C]0.1173[/C][C]0.653[/C][C]0.9855[/C][C]0.7856[/C][/ROW]
[ROW][C]65[/C][C]6.1[/C][C]7.4979[/C][C]6.5122[/C][C]8.4836[/C][C]0.0027[/C][C]0.8827[/C][C]0.9914[/C][C]0.7856[/C][/ROW]
[ROW][C]66[/C][C]5.8[/C][C]7.4979[/C][C]6.5122[/C][C]8.4836[/C][C]4e-04[/C][C]0.9973[/C][C]0.9951[/C][C]0.7856[/C][/ROW]
[ROW][C]67[/C][C]6.2[/C][C]7.4979[/C][C]6.5122[/C][C]8.4836[/C][C]0.0049[/C][C]0.9996[/C][C]0.9764[/C][C]0.7856[/C][/ROW]
[ROW][C]68[/C][C]7.1[/C][C]7.4979[/C][C]6.5122[/C][C]8.4836[/C][C]0.2144[/C][C]0.9951[/C][C]0.9174[/C][C]0.7856[/C][/ROW]
[ROW][C]69[/C][C]7.7[/C][C]7.4979[/C][C]6.5122[/C][C]8.4836[/C][C]0.3439[/C][C]0.7856[/C][C]0.9174[/C][C]0.7856[/C][/ROW]
[ROW][C]70[/C][C]7.9[/C][C]7.4979[/C][C]6.5122[/C][C]8.4836[/C][C]0.212[/C][C]0.3439[/C][C]0.9855[/C][C]0.7856[/C][/ROW]
[ROW][C]71[/C][C]7.7[/C][C]7.4979[/C][C]6.5122[/C][C]8.4836[/C][C]0.3439[/C][C]0.212[/C][C]0.9973[/C][C]0.7856[/C][/ROW]
[ROW][C]72[/C][C]7.4[/C][C]7.4979[/C][C]6.5122[/C][C]8.4836[/C][C]0.4229[/C][C]0.3439[/C][C]0.9996[/C][C]0.7856[/C][/ROW]
[ROW][C]73[/C][C]7.5[/C][C]7.4979[/C][C]6.5122[/C][C]8.4836[/C][C]0.4983[/C][C]0.5771[/C][C]0.9973[/C][C]0.7856[/C][/ROW]
[/TABLE]
Source: https://freestatistics.org/blog/index.php?pk=66596&T=1

Globally Unique Identifier (entire table): ba.freestatistics.org/blog/index.php?pk=66596&T=1

As an alternative you can also use a QR Code:  

The GUIDs for individual cells are displayed in the table below:

Univariate ARIMA Extrapolation Forecast
timeY[t]F[t]95% LB95% UBp-value(H0: Y[t] = F[t])P(F[t]>Y[t-1])P(F[t]>Y[t-s])P(F[t]>Y[45])
338.2-------
348.2-------
358.2-------
367.9-------
377.3-------
386.9-------
396.6-------
406.7-------
416.9-------
427-------
437.1-------
447.2-------
457.1-------
466.97.17176.77737.56620.08850.639300.6393
4777.1666.53147.80060.30410.79437e-040.5808
486.87.29946.40988.18890.13560.74520.09290.6698
496.47.44366.46588.42130.01820.90150.61320.7545
506.77.51026.52378.49670.05370.98630.88730.7925
516.67.51346.52768.49910.03470.94710.96530.7944
526.47.49896.51398.48380.01440.96320.94410.7863
536.37.49196.50718.47670.00880.98510.88060.7823
546.27.49356.50828.47890.0050.99120.83690.7831
556.57.49716.51138.48280.02370.9950.78510.7851
566.87.49876.51298.48450.08240.97650.72370.786
576.87.49856.51288.48430.08240.91760.78590.7859
586.47.4986.51238.48360.01450.91740.88280.7856
596.17.49776.5128.48340.00270.98550.83880.7855
605.87.49776.5128.48344e-040.99730.91730.7855
616.17.49796.51218.48360.00270.99960.98550.7856
627.27.49796.51228.48360.27680.99730.94370.7856
637.37.49796.51228.48360.3470.72320.96290.7856
646.97.49796.51228.48360.11730.6530.98550.7856
656.17.49796.51228.48360.00270.88270.99140.7856
665.87.49796.51228.48364e-040.99730.99510.7856
676.27.49796.51228.48360.00490.99960.97640.7856
687.17.49796.51228.48360.21440.99510.91740.7856
697.77.49796.51228.48360.34390.78560.91740.7856
707.97.49796.51228.48360.2120.34390.98550.7856
717.77.49796.51228.48360.34390.2120.99730.7856
727.47.49796.51228.48360.42290.34390.99960.7856
737.57.49796.51228.48360.49830.57710.99730.7856


Univariate ARIMA Extrapolation Forecast Performance
time% S.E.PEMAPESq.EMSERMSE
460.0281-0.037900.073800
470.0452-0.02320.03050.02760.05070.2252
480.0622-0.06840.04320.24940.11690.3419
490.067-0.14020.06741.0890.35990.6
500.067-0.10790.07550.65640.41920.6475
510.0669-0.12160.08320.83420.48840.6989
520.067-0.14650.09221.20750.59110.7689
530.0671-0.15910.10061.42060.69480.8336
540.0671-0.17260.10861.67320.80350.8964
550.0671-0.1330.1110.99410.82260.907
560.0671-0.09320.10940.48820.79220.89
570.0671-0.09320.10810.4880.76680.8757
580.0671-0.14640.1111.20550.80060.8947
590.0671-0.18640.11641.95360.88290.9396
600.0671-0.22640.12372.88231.01621.0081
610.0671-0.18640.12761.9541.07481.0367
620.0671-0.03970.12250.08871.01681.0084
630.0671-0.02640.11710.03920.96250.9811
640.0671-0.07970.11520.35750.93070.9647
650.0671-0.18640.11871.9540.98180.9909
660.0671-0.22640.12392.88271.07241.0355
670.0671-0.17310.12611.68451.10021.0489
680.0671-0.05310.12290.15831.05921.0292
690.06710.0270.11890.04091.01681.0084
700.06710.05360.11630.16170.98260.9913
710.06710.0270.11290.04090.94640.9728
720.0671-0.01310.10920.00960.91170.9548
730.06713e-040.105300.87910.9376

\begin{tabular}{lllllllll}
\hline
Univariate ARIMA Extrapolation Forecast Performance \tabularnewline
time & % S.E. & PE & MAPE & Sq.E & MSE & RMSE \tabularnewline
46 & 0.0281 & -0.0379 & 0 & 0.0738 & 0 & 0 \tabularnewline
47 & 0.0452 & -0.0232 & 0.0305 & 0.0276 & 0.0507 & 0.2252 \tabularnewline
48 & 0.0622 & -0.0684 & 0.0432 & 0.2494 & 0.1169 & 0.3419 \tabularnewline
49 & 0.067 & -0.1402 & 0.0674 & 1.089 & 0.3599 & 0.6 \tabularnewline
50 & 0.067 & -0.1079 & 0.0755 & 0.6564 & 0.4192 & 0.6475 \tabularnewline
51 & 0.0669 & -0.1216 & 0.0832 & 0.8342 & 0.4884 & 0.6989 \tabularnewline
52 & 0.067 & -0.1465 & 0.0922 & 1.2075 & 0.5911 & 0.7689 \tabularnewline
53 & 0.0671 & -0.1591 & 0.1006 & 1.4206 & 0.6948 & 0.8336 \tabularnewline
54 & 0.0671 & -0.1726 & 0.1086 & 1.6732 & 0.8035 & 0.8964 \tabularnewline
55 & 0.0671 & -0.133 & 0.111 & 0.9941 & 0.8226 & 0.907 \tabularnewline
56 & 0.0671 & -0.0932 & 0.1094 & 0.4882 & 0.7922 & 0.89 \tabularnewline
57 & 0.0671 & -0.0932 & 0.1081 & 0.488 & 0.7668 & 0.8757 \tabularnewline
58 & 0.0671 & -0.1464 & 0.111 & 1.2055 & 0.8006 & 0.8947 \tabularnewline
59 & 0.0671 & -0.1864 & 0.1164 & 1.9536 & 0.8829 & 0.9396 \tabularnewline
60 & 0.0671 & -0.2264 & 0.1237 & 2.8823 & 1.0162 & 1.0081 \tabularnewline
61 & 0.0671 & -0.1864 & 0.1276 & 1.954 & 1.0748 & 1.0367 \tabularnewline
62 & 0.0671 & -0.0397 & 0.1225 & 0.0887 & 1.0168 & 1.0084 \tabularnewline
63 & 0.0671 & -0.0264 & 0.1171 & 0.0392 & 0.9625 & 0.9811 \tabularnewline
64 & 0.0671 & -0.0797 & 0.1152 & 0.3575 & 0.9307 & 0.9647 \tabularnewline
65 & 0.0671 & -0.1864 & 0.1187 & 1.954 & 0.9818 & 0.9909 \tabularnewline
66 & 0.0671 & -0.2264 & 0.1239 & 2.8827 & 1.0724 & 1.0355 \tabularnewline
67 & 0.0671 & -0.1731 & 0.1261 & 1.6845 & 1.1002 & 1.0489 \tabularnewline
68 & 0.0671 & -0.0531 & 0.1229 & 0.1583 & 1.0592 & 1.0292 \tabularnewline
69 & 0.0671 & 0.027 & 0.1189 & 0.0409 & 1.0168 & 1.0084 \tabularnewline
70 & 0.0671 & 0.0536 & 0.1163 & 0.1617 & 0.9826 & 0.9913 \tabularnewline
71 & 0.0671 & 0.027 & 0.1129 & 0.0409 & 0.9464 & 0.9728 \tabularnewline
72 & 0.0671 & -0.0131 & 0.1092 & 0.0096 & 0.9117 & 0.9548 \tabularnewline
73 & 0.0671 & 3e-04 & 0.1053 & 0 & 0.8791 & 0.9376 \tabularnewline
\hline
\end{tabular}
%Source: https://freestatistics.org/blog/index.php?pk=66596&T=2

[TABLE]
[ROW][C]Univariate ARIMA Extrapolation Forecast Performance[/C][/ROW]
[ROW][C]time[/C][C]% S.E.[/C][C]PE[/C][C]MAPE[/C][C]Sq.E[/C][C]MSE[/C][C]RMSE[/C][/ROW]
[ROW][C]46[/C][C]0.0281[/C][C]-0.0379[/C][C]0[/C][C]0.0738[/C][C]0[/C][C]0[/C][/ROW]
[ROW][C]47[/C][C]0.0452[/C][C]-0.0232[/C][C]0.0305[/C][C]0.0276[/C][C]0.0507[/C][C]0.2252[/C][/ROW]
[ROW][C]48[/C][C]0.0622[/C][C]-0.0684[/C][C]0.0432[/C][C]0.2494[/C][C]0.1169[/C][C]0.3419[/C][/ROW]
[ROW][C]49[/C][C]0.067[/C][C]-0.1402[/C][C]0.0674[/C][C]1.089[/C][C]0.3599[/C][C]0.6[/C][/ROW]
[ROW][C]50[/C][C]0.067[/C][C]-0.1079[/C][C]0.0755[/C][C]0.6564[/C][C]0.4192[/C][C]0.6475[/C][/ROW]
[ROW][C]51[/C][C]0.0669[/C][C]-0.1216[/C][C]0.0832[/C][C]0.8342[/C][C]0.4884[/C][C]0.6989[/C][/ROW]
[ROW][C]52[/C][C]0.067[/C][C]-0.1465[/C][C]0.0922[/C][C]1.2075[/C][C]0.5911[/C][C]0.7689[/C][/ROW]
[ROW][C]53[/C][C]0.0671[/C][C]-0.1591[/C][C]0.1006[/C][C]1.4206[/C][C]0.6948[/C][C]0.8336[/C][/ROW]
[ROW][C]54[/C][C]0.0671[/C][C]-0.1726[/C][C]0.1086[/C][C]1.6732[/C][C]0.8035[/C][C]0.8964[/C][/ROW]
[ROW][C]55[/C][C]0.0671[/C][C]-0.133[/C][C]0.111[/C][C]0.9941[/C][C]0.8226[/C][C]0.907[/C][/ROW]
[ROW][C]56[/C][C]0.0671[/C][C]-0.0932[/C][C]0.1094[/C][C]0.4882[/C][C]0.7922[/C][C]0.89[/C][/ROW]
[ROW][C]57[/C][C]0.0671[/C][C]-0.0932[/C][C]0.1081[/C][C]0.488[/C][C]0.7668[/C][C]0.8757[/C][/ROW]
[ROW][C]58[/C][C]0.0671[/C][C]-0.1464[/C][C]0.111[/C][C]1.2055[/C][C]0.8006[/C][C]0.8947[/C][/ROW]
[ROW][C]59[/C][C]0.0671[/C][C]-0.1864[/C][C]0.1164[/C][C]1.9536[/C][C]0.8829[/C][C]0.9396[/C][/ROW]
[ROW][C]60[/C][C]0.0671[/C][C]-0.2264[/C][C]0.1237[/C][C]2.8823[/C][C]1.0162[/C][C]1.0081[/C][/ROW]
[ROW][C]61[/C][C]0.0671[/C][C]-0.1864[/C][C]0.1276[/C][C]1.954[/C][C]1.0748[/C][C]1.0367[/C][/ROW]
[ROW][C]62[/C][C]0.0671[/C][C]-0.0397[/C][C]0.1225[/C][C]0.0887[/C][C]1.0168[/C][C]1.0084[/C][/ROW]
[ROW][C]63[/C][C]0.0671[/C][C]-0.0264[/C][C]0.1171[/C][C]0.0392[/C][C]0.9625[/C][C]0.9811[/C][/ROW]
[ROW][C]64[/C][C]0.0671[/C][C]-0.0797[/C][C]0.1152[/C][C]0.3575[/C][C]0.9307[/C][C]0.9647[/C][/ROW]
[ROW][C]65[/C][C]0.0671[/C][C]-0.1864[/C][C]0.1187[/C][C]1.954[/C][C]0.9818[/C][C]0.9909[/C][/ROW]
[ROW][C]66[/C][C]0.0671[/C][C]-0.2264[/C][C]0.1239[/C][C]2.8827[/C][C]1.0724[/C][C]1.0355[/C][/ROW]
[ROW][C]67[/C][C]0.0671[/C][C]-0.1731[/C][C]0.1261[/C][C]1.6845[/C][C]1.1002[/C][C]1.0489[/C][/ROW]
[ROW][C]68[/C][C]0.0671[/C][C]-0.0531[/C][C]0.1229[/C][C]0.1583[/C][C]1.0592[/C][C]1.0292[/C][/ROW]
[ROW][C]69[/C][C]0.0671[/C][C]0.027[/C][C]0.1189[/C][C]0.0409[/C][C]1.0168[/C][C]1.0084[/C][/ROW]
[ROW][C]70[/C][C]0.0671[/C][C]0.0536[/C][C]0.1163[/C][C]0.1617[/C][C]0.9826[/C][C]0.9913[/C][/ROW]
[ROW][C]71[/C][C]0.0671[/C][C]0.027[/C][C]0.1129[/C][C]0.0409[/C][C]0.9464[/C][C]0.9728[/C][/ROW]
[ROW][C]72[/C][C]0.0671[/C][C]-0.0131[/C][C]0.1092[/C][C]0.0096[/C][C]0.9117[/C][C]0.9548[/C][/ROW]
[ROW][C]73[/C][C]0.0671[/C][C]3e-04[/C][C]0.1053[/C][C]0[/C][C]0.8791[/C][C]0.9376[/C][/ROW]
[/TABLE]
Source: https://freestatistics.org/blog/index.php?pk=66596&T=2

Globally Unique Identifier (entire table): ba.freestatistics.org/blog/index.php?pk=66596&T=2

As an alternative you can also use a QR Code:  

The GUIDs for individual cells are displayed in the table below:

Univariate ARIMA Extrapolation Forecast Performance
time% S.E.PEMAPESq.EMSERMSE
460.0281-0.037900.073800
470.0452-0.02320.03050.02760.05070.2252
480.0622-0.06840.04320.24940.11690.3419
490.067-0.14020.06741.0890.35990.6
500.067-0.10790.07550.65640.41920.6475
510.0669-0.12160.08320.83420.48840.6989
520.067-0.14650.09221.20750.59110.7689
530.0671-0.15910.10061.42060.69480.8336
540.0671-0.17260.10861.67320.80350.8964
550.0671-0.1330.1110.99410.82260.907
560.0671-0.09320.10940.48820.79220.89
570.0671-0.09320.10810.4880.76680.8757
580.0671-0.14640.1111.20550.80060.8947
590.0671-0.18640.11641.95360.88290.9396
600.0671-0.22640.12372.88231.01621.0081
610.0671-0.18640.12761.9541.07481.0367
620.0671-0.03970.12250.08871.01681.0084
630.0671-0.02640.11710.03920.96250.9811
640.0671-0.07970.11520.35750.93070.9647
650.0671-0.18640.11871.9540.98180.9909
660.0671-0.22640.12392.88271.07241.0355
670.0671-0.17310.12611.68451.10021.0489
680.0671-0.05310.12290.15831.05921.0292
690.06710.0270.11890.04091.01681.0084
700.06710.05360.11630.16170.98260.9913
710.06710.0270.11290.04090.94640.9728
720.0671-0.01310.10920.00960.91170.9548
730.06713e-040.105300.87910.9376


Parameters (Session):
par1 = 24 ; par2 = 1 ; par3 = 1 ; par4 = 0 ; par5 = 12 ; par6 = 0 ; par7 = 0 ; par8 = 0 ; par9 = 0 ; par10 = FALSE ;
Parameters (R input):
par1 = 24 ; par2 = 1 ; par3 = 1 ; par4 = 0 ; par5 = 12 ; par6 = 0 ; par7 = 0 ; par8 = 0 ; par9 = 0 ; par10 = FALSE ;
R code (references can be found in the software module):
par1 <- as.numeric(par1) #cut off periods
par1 <- 28
par2 <- as.numeric(par2) #lambda
par3 <- as.numeric(par3) #degree of non-seasonal differencing
par4 <- as.numeric(par4) #degree of seasonal differencing
par5 <- as.numeric(par5) #seasonal period
par6 <- as.numeric(par6) #p
par6 <- 3
par7 <- as.numeric(par7) #q
par7 <- 3
par8 <- as.numeric(par8) #P
par9 <- as.numeric(par9) #Q
if (par10 == 'TRUE') par10 <- TRUE
if (par10 == 'FALSE') par10 <- FALSE
if (par2 == 0) x <- log(x)
if (par2 != 0) x <- x^par2
lx <- length(x)
first <- lx - 2*par1
nx <- lx - par1
nx1 <- nx + 1
fx <- lx - nx
if (fx < 1) {
fx <- par5
nx1 <- lx + fx - 1
first <- lx - 2*fx
}
first <- 1
if (fx < 3) fx <- round(lx/10,0)
(arima.out <- arima(x[1:nx], order=c(par6,par3,par7), seasonal=list(order=c(par8,par4,par9), period=par5), include.mean=par10, method='ML'))
(forecast <- predict(arima.out,par1))
(lb <- forecast$pred - 1.96 * forecast$se)
(ub <- forecast$pred + 1.96 * forecast$se)
if (par2 == 0) {
x <- exp(x)
forecast$pred <- exp(forecast$pred)
lb <- exp(lb)
ub <- exp(ub)
}
if (par2 != 0) {
x <- x^(1/par2)
forecast$pred <- forecast$pred^(1/par2)
lb <- lb^(1/par2)
ub <- ub^(1/par2)
}
if (par2 < 0) {
olb <- lb
lb <- ub
ub <- olb
}
(actandfor <- c(x[1:nx], forecast$pred))
(perc.se <- (ub-forecast$pred)/1.96/forecast$pred)
bitmap(file='test1.png')
opar <- par(mar=c(4,4,2,2),las=1)
ylim <- c( min(x[first:nx],lb), max(x[first:nx],ub))
plot(x,ylim=ylim,type='n',xlim=c(first,lx))
usr <- par('usr')
rect(usr[1],usr[3],nx+1,usr[4],border=NA,col='lemonchiffon')
rect(nx1,usr[3],usr[2],usr[4],border=NA,col='lavender')
abline(h= (-3:3)*2 , col ='gray', lty =3)
polygon( c(nx1:lx,lx:nx1), c(lb,rev(ub)), col = 'orange', lty=2,border=NA)
lines(nx1:lx, lb , lty=2)
lines(nx1:lx, ub , lty=2)
lines(x, lwd=2)
lines(nx1:lx, forecast$pred , lwd=2 , col ='white')
box()
par(opar)
dev.off()
prob.dec <- array(NA, dim=fx)
prob.sdec <- array(NA, dim=fx)
prob.ldec <- array(NA, dim=fx)
prob.pval <- array(NA, dim=fx)
perf.pe <- array(0, dim=fx)
perf.mape <- array(0, dim=fx)
perf.mape1 <- array(0, dim=fx)
perf.se <- array(0, dim=fx)
perf.mse <- array(0, dim=fx)
perf.mse1 <- array(0, dim=fx)
perf.rmse <- array(0, dim=fx)
for (i in 1:fx) {
locSD <- (ub[i] - forecast$pred[i]) / 1.96
perf.pe[i] = (x[nx+i] - forecast$pred[i]) / forecast$pred[i]
perf.se[i] = (x[nx+i] - forecast$pred[i])^2
prob.dec[i] = pnorm((x[nx+i-1] - forecast$pred[i]) / locSD)
prob.sdec[i] = pnorm((x[nx+i-par5] - forecast$pred[i]) / locSD)
prob.ldec[i] = pnorm((x[nx] - forecast$pred[i]) / locSD)
prob.pval[i] = pnorm(abs(x[nx+i] - forecast$pred[i]) / locSD)
}
perf.mape[1] = abs(perf.pe[1])
perf.mse[1] = abs(perf.se[1])
for (i in 2:fx) {
perf.mape[i] = perf.mape[i-1] + abs(perf.pe[i])
perf.mape1[i] = perf.mape[i] / i
perf.mse[i] = perf.mse[i-1] + perf.se[i]
perf.mse1[i] = perf.mse[i] / i
}
perf.rmse = sqrt(perf.mse1)
bitmap(file='test2.png')
plot(forecast$pred, pch=19, type='b',main='ARIMA Extrapolation Forecast', ylab='Forecast and 95% CI', xlab='time',ylim=c(min(lb),max(ub)))
dum <- forecast$pred
dum[1:par1] <- x[(nx+1):lx]
lines(dum, lty=1)
lines(ub,lty=3)
lines(lb,lty=3)
dev.off()
load(file='createtable')
a<-table.start()
a<-table.row.start(a)
a<-table.element(a,'Univariate ARIMA Extrapolation Forecast',9,TRUE)
a<-table.row.end(a)
a<-table.row.start(a)
a<-table.element(a,'time',1,header=TRUE)
a<-table.element(a,'Y[t]',1,header=TRUE)
a<-table.element(a,'F[t]',1,header=TRUE)
a<-table.element(a,'95% LB',1,header=TRUE)
a<-table.element(a,'95% UB',1,header=TRUE)
a<-table.element(a,'p-value
(H0: Y[t] = F[t])',1,header=TRUE)
a<-table.element(a,'P(F[t]>Y[t-1])',1,header=TRUE)
a<-table.element(a,'P(F[t]>Y[t-s])',1,header=TRUE)
mylab <- paste('P(F[t]>Y[',nx,sep='')
mylab <- paste(mylab,'])',sep='')
a<-table.element(a,mylab,1,header=TRUE)
a<-table.row.end(a)
for (i in (nx-par5):nx) {
a<-table.row.start(a)
a<-table.element(a,i,header=TRUE)
a<-table.element(a,x[i])
a<-table.element(a,'-')
a<-table.row.end(a)
}
for (i in 1:fx) {
a<-table.row.start(a)
a<-table.element(a,nx+i,header=TRUE)
a<-table.element(a,round(x[nx+i],4))
a<-table.element(a,round(forecast$pred[i],4))
a<-table.element(a,round(lb[i],4))
a<-table.element(a,round(ub[i],4))
a<-table.element(a,round((1-prob.pval[i]),4))
a<-table.element(a,round((1-prob.dec[i]),4))
a<-table.element(a,round((1-prob.sdec[i]),4))
a<-table.element(a,round((1-prob.ldec[i]),4))
a<-table.row.end(a)
}
a<-table.end(a)
table.save(a,file='mytable.tab')
a<-table.start()
a<-table.row.start(a)
a<-table.element(a,'Univariate ARIMA Extrapolation Forecast Performance',7,TRUE)
a<-table.row.end(a)
a<-table.row.start(a)
a<-table.element(a,'time',1,header=TRUE)
a<-table.element(a,'% S.E.',1,header=TRUE)
a<-table.element(a,'PE',1,header=TRUE)
a<-table.element(a,'MAPE',1,header=TRUE)
a<-table.element(a,'Sq.E',1,header=TRUE)
a<-table.element(a,'MSE',1,header=TRUE)
a<-table.element(a,'RMSE',1,header=TRUE)
a<-table.row.end(a)
for (i in 1:fx) {
a<-table.row.start(a)
a<-table.element(a,nx+i,header=TRUE)
a<-table.element(a,round(perc.se[i],4))
a<-table.element(a,round(perf.pe[i],4))
a<-table.element(a,round(perf.mape1[i],4))
a<-table.element(a,round(perf.se[i],4))
a<-table.element(a,round(perf.mse1[i],4))
a<-table.element(a,round(perf.rmse[i],4))
a<-table.row.end(a)
}
a<-table.end(a)
table.save(a,file='mytable1.tab')