Free Statistics

of Irreproducible Research!

Author's title

Author*The author of this computation has been verified*
R Software Modulerwasp_arimabackwardselection.wasp
Title produced by softwareARIMA Backward Selection
Date of computationFri, 11 Dec 2009 09:50:09 -0700
Cite this page as followsStatistical Computations at FreeStatistics.org, Office for Research Development and Education, URL https://freestatistics.org/blog/index.php?v=date/2009/Dec/11/t1260550272uvmsaxazp6dinm0.htm/, Retrieved Mon, 29 Apr 2024 03:14:20 +0000
Statistical Computations at FreeStatistics.org, Office for Research Development and Education, URL https://freestatistics.org/blog/index.php?pk=66540, Retrieved Mon, 29 Apr 2024 03:14:20 +0000
QR Codes:

Original text written by user:
IsPrivate?No (this computation is public)
User-defined keywords
Estimated Impact108
Family? (F = Feedback message, R = changed R code, M = changed R Module, P = changed Parameters, D = changed Data)
-     [ARIMA Backward Selection] [] [2009-12-07 09:18:36] [b98453cac15ba1066b407e146608df68]
-    D    [ARIMA Backward Selection] [] [2009-12-11 16:50:09] [54f12ba6dfaf5b88c7c2745223d9c32f] [Current]
Feedback Forum

Post a new message
Dataseries X:
20366
22782
19169
13807
29743
25591
29096
26482
22405
27044
17970
18730
19684
19785
18479
10698
31956
29506
34506
27165
26736
23691
18157
17328
18205
20995
17382
9367
31124
26551
30651
25859
25100
25778
20418
18688
20424
24776
19814
12738
31566
30111
30019
31934
25826
26835
20205
17789
20520
22518
15572
11509
25447
24090
27786
26195
20516
22759
19028
16971


Summary of computational transaction
Raw Inputview raw input (R code)
Raw Outputview raw output of R engine
Computing time3 seconds
R Server'Gwilym Jenkins' @ 72.249.127.135

\begin{tabular}{lllllllll}
\hline
Summary of computational transaction \tabularnewline
Raw Input & view raw input (R code)  \tabularnewline
Raw Output & view raw output of R engine  \tabularnewline
Computing time & 3 seconds \tabularnewline
R Server & 'Gwilym Jenkins' @ 72.249.127.135 \tabularnewline
\hline
\end{tabular}
%Source: https://freestatistics.org/blog/index.php?pk=66540&T=0

[TABLE]
[ROW][C]Summary of computational transaction[/C][/ROW]
[ROW][C]Raw Input[/C][C]view raw input (R code) [/C][/ROW]
[ROW][C]Raw Output[/C][C]view raw output of R engine [/C][/ROW]
[ROW][C]Computing time[/C][C]3 seconds[/C][/ROW]
[ROW][C]R Server[/C][C]'Gwilym Jenkins' @ 72.249.127.135[/C][/ROW]
[/TABLE]
Source: https://freestatistics.org/blog/index.php?pk=66540&T=0

Globally Unique Identifier (entire table): ba.freestatistics.org/blog/index.php?pk=66540&T=0

As an alternative you can also use a QR Code:  

The GUIDs for individual cells are displayed in the table below:

Summary of computational transaction
Raw Inputview raw input (R code)
Raw Outputview raw output of R engine
Computing time3 seconds
R Server'Gwilym Jenkins' @ 72.249.127.135


ARIMA Parameter Estimation and Backward Selection
Iterationar1ar2ar3ma1ma2ma3
Estimates ( 1 )-0.168-0.54770.1167-0.44720.4472-1
(p-val)(0.3777 )(0.0012 )(0.4133 )(0.0019 )(0.0021 )(0 )
Estimates ( 2 )1.589-0.79920-3.0923.0741-0.9821
(p-val)(0 )(0 )(NA )(1e-04 )(0.0387 )(0.1679 )
Estimates ( 3 )0.11430.13240-0.7939-0.20610
(p-val)(0.8823 )(0.6413 )(NA )(0.3027 )(0.7878 )(NA )
Estimates ( 4 )00.16590-0.6814-0.31860
(p-val)(NA )(0.2264 )(NA )(0 )(0.0186 )(NA )
Estimates ( 5 )000-0.7201-0.27990
(p-val)(NA )(NA )(NA )(0 )(0.0168 )(NA )
Estimates ( 6 )NANANANANANA
(p-val)(NA )(NA )(NA )(NA )(NA )(NA )
Estimates ( 7 )NANANANANANA
(p-val)(NA )(NA )(NA )(NA )(NA )(NA )
Estimates ( 8 )NANANANANANA
(p-val)(NA )(NA )(NA )(NA )(NA )(NA )
Estimates ( 9 )NANANANANANA
(p-val)(NA )(NA )(NA )(NA )(NA )(NA )
Estimates ( 10 )NANANANANANA
(p-val)(NA )(NA )(NA )(NA )(NA )(NA )
Estimates ( 11 )NANANANANANA
(p-val)(NA )(NA )(NA )(NA )(NA )(NA )

\begin{tabular}{lllllllll}
\hline
ARIMA Parameter Estimation and Backward Selection \tabularnewline
Iteration & ar1 & ar2 & ar3 & ma1 & ma2 & ma3 \tabularnewline
Estimates ( 1 ) & -0.168 & -0.5477 & 0.1167 & -0.4472 & 0.4472 & -1 \tabularnewline
(p-val) & (0.3777 ) & (0.0012 ) & (0.4133 ) & (0.0019 ) & (0.0021 ) & (0 ) \tabularnewline
Estimates ( 2 ) & 1.589 & -0.7992 & 0 & -3.092 & 3.0741 & -0.9821 \tabularnewline
(p-val) & (0 ) & (0 ) & (NA ) & (1e-04 ) & (0.0387 ) & (0.1679 ) \tabularnewline
Estimates ( 3 ) & 0.1143 & 0.1324 & 0 & -0.7939 & -0.2061 & 0 \tabularnewline
(p-val) & (0.8823 ) & (0.6413 ) & (NA ) & (0.3027 ) & (0.7878 ) & (NA ) \tabularnewline
Estimates ( 4 ) & 0 & 0.1659 & 0 & -0.6814 & -0.3186 & 0 \tabularnewline
(p-val) & (NA ) & (0.2264 ) & (NA ) & (0 ) & (0.0186 ) & (NA ) \tabularnewline
Estimates ( 5 ) & 0 & 0 & 0 & -0.7201 & -0.2799 & 0 \tabularnewline
(p-val) & (NA ) & (NA ) & (NA ) & (0 ) & (0.0168 ) & (NA ) \tabularnewline
Estimates ( 6 ) & NA & NA & NA & NA & NA & NA \tabularnewline
(p-val) & (NA ) & (NA ) & (NA ) & (NA ) & (NA ) & (NA ) \tabularnewline
Estimates ( 7 ) & NA & NA & NA & NA & NA & NA \tabularnewline
(p-val) & (NA ) & (NA ) & (NA ) & (NA ) & (NA ) & (NA ) \tabularnewline
Estimates ( 8 ) & NA & NA & NA & NA & NA & NA \tabularnewline
(p-val) & (NA ) & (NA ) & (NA ) & (NA ) & (NA ) & (NA ) \tabularnewline
Estimates ( 9 ) & NA & NA & NA & NA & NA & NA \tabularnewline
(p-val) & (NA ) & (NA ) & (NA ) & (NA ) & (NA ) & (NA ) \tabularnewline
Estimates ( 10 ) & NA & NA & NA & NA & NA & NA \tabularnewline
(p-val) & (NA ) & (NA ) & (NA ) & (NA ) & (NA ) & (NA ) \tabularnewline
Estimates ( 11 ) & NA & NA & NA & NA & NA & NA \tabularnewline
(p-val) & (NA ) & (NA ) & (NA ) & (NA ) & (NA ) & (NA ) \tabularnewline
\hline
\end{tabular}
%Source: https://freestatistics.org/blog/index.php?pk=66540&T=1

[TABLE]
[ROW][C]ARIMA Parameter Estimation and Backward Selection[/C][/ROW]
[ROW][C]Iteration[/C][C]ar1[/C][C]ar2[/C][C]ar3[/C][C]ma1[/C][C]ma2[/C][C]ma3[/C][/ROW]
[ROW][C]Estimates ( 1 )[/C][C]-0.168[/C][C]-0.5477[/C][C]0.1167[/C][C]-0.4472[/C][C]0.4472[/C][C]-1[/C][/ROW]
[ROW][C](p-val)[/C][C](0.3777 )[/C][C](0.0012 )[/C][C](0.4133 )[/C][C](0.0019 )[/C][C](0.0021 )[/C][C](0 )[/C][/ROW]
[ROW][C]Estimates ( 2 )[/C][C]1.589[/C][C]-0.7992[/C][C]0[/C][C]-3.092[/C][C]3.0741[/C][C]-0.9821[/C][/ROW]
[ROW][C](p-val)[/C][C](0 )[/C][C](0 )[/C][C](NA )[/C][C](1e-04 )[/C][C](0.0387 )[/C][C](0.1679 )[/C][/ROW]
[ROW][C]Estimates ( 3 )[/C][C]0.1143[/C][C]0.1324[/C][C]0[/C][C]-0.7939[/C][C]-0.2061[/C][C]0[/C][/ROW]
[ROW][C](p-val)[/C][C](0.8823 )[/C][C](0.6413 )[/C][C](NA )[/C][C](0.3027 )[/C][C](0.7878 )[/C][C](NA )[/C][/ROW]
[ROW][C]Estimates ( 4 )[/C][C]0[/C][C]0.1659[/C][C]0[/C][C]-0.6814[/C][C]-0.3186[/C][C]0[/C][/ROW]
[ROW][C](p-val)[/C][C](NA )[/C][C](0.2264 )[/C][C](NA )[/C][C](0 )[/C][C](0.0186 )[/C][C](NA )[/C][/ROW]
[ROW][C]Estimates ( 5 )[/C][C]0[/C][C]0[/C][C]0[/C][C]-0.7201[/C][C]-0.2799[/C][C]0[/C][/ROW]
[ROW][C](p-val)[/C][C](NA )[/C][C](NA )[/C][C](NA )[/C][C](0 )[/C][C](0.0168 )[/C][C](NA )[/C][/ROW]
[ROW][C]Estimates ( 6 )[/C][C]NA[/C][C]NA[/C][C]NA[/C][C]NA[/C][C]NA[/C][C]NA[/C][/ROW]
[ROW][C](p-val)[/C][C](NA )[/C][C](NA )[/C][C](NA )[/C][C](NA )[/C][C](NA )[/C][C](NA )[/C][/ROW]
[ROW][C]Estimates ( 7 )[/C][C]NA[/C][C]NA[/C][C]NA[/C][C]NA[/C][C]NA[/C][C]NA[/C][/ROW]
[ROW][C](p-val)[/C][C](NA )[/C][C](NA )[/C][C](NA )[/C][C](NA )[/C][C](NA )[/C][C](NA )[/C][/ROW]
[ROW][C]Estimates ( 8 )[/C][C]NA[/C][C]NA[/C][C]NA[/C][C]NA[/C][C]NA[/C][C]NA[/C][/ROW]
[ROW][C](p-val)[/C][C](NA )[/C][C](NA )[/C][C](NA )[/C][C](NA )[/C][C](NA )[/C][C](NA )[/C][/ROW]
[ROW][C]Estimates ( 9 )[/C][C]NA[/C][C]NA[/C][C]NA[/C][C]NA[/C][C]NA[/C][C]NA[/C][/ROW]
[ROW][C](p-val)[/C][C](NA )[/C][C](NA )[/C][C](NA )[/C][C](NA )[/C][C](NA )[/C][C](NA )[/C][/ROW]
[ROW][C]Estimates ( 10 )[/C][C]NA[/C][C]NA[/C][C]NA[/C][C]NA[/C][C]NA[/C][C]NA[/C][/ROW]
[ROW][C](p-val)[/C][C](NA )[/C][C](NA )[/C][C](NA )[/C][C](NA )[/C][C](NA )[/C][C](NA )[/C][/ROW]
[ROW][C]Estimates ( 11 )[/C][C]NA[/C][C]NA[/C][C]NA[/C][C]NA[/C][C]NA[/C][C]NA[/C][/ROW]
[ROW][C](p-val)[/C][C](NA )[/C][C](NA )[/C][C](NA )[/C][C](NA )[/C][C](NA )[/C][C](NA )[/C][/ROW]
[/TABLE]
Source: https://freestatistics.org/blog/index.php?pk=66540&T=1

Globally Unique Identifier (entire table): ba.freestatistics.org/blog/index.php?pk=66540&T=1

As an alternative you can also use a QR Code:  

The GUIDs for individual cells are displayed in the table below:

ARIMA Parameter Estimation and Backward Selection
Iterationar1ar2ar3ma1ma2ma3
Estimates ( 1 )-0.168-0.54770.1167-0.44720.4472-1
(p-val)(0.3777 )(0.0012 )(0.4133 )(0.0019 )(0.0021 )(0 )
Estimates ( 2 )1.589-0.79920-3.0923.0741-0.9821
(p-val)(0 )(0 )(NA )(1e-04 )(0.0387 )(0.1679 )
Estimates ( 3 )0.11430.13240-0.7939-0.20610
(p-val)(0.8823 )(0.6413 )(NA )(0.3027 )(0.7878 )(NA )
Estimates ( 4 )00.16590-0.6814-0.31860
(p-val)(NA )(0.2264 )(NA )(0 )(0.0186 )(NA )
Estimates ( 5 )000-0.7201-0.27990
(p-val)(NA )(NA )(NA )(0 )(0.0168 )(NA )
Estimates ( 6 )NANANANANANA
(p-val)(NA )(NA )(NA )(NA )(NA )(NA )
Estimates ( 7 )NANANANANANA
(p-val)(NA )(NA )(NA )(NA )(NA )(NA )
Estimates ( 8 )NANANANANANA
(p-val)(NA )(NA )(NA )(NA )(NA )(NA )
Estimates ( 9 )NANANANANANA
(p-val)(NA )(NA )(NA )(NA )(NA )(NA )
Estimates ( 10 )NANANANANANA
(p-val)(NA )(NA )(NA )(NA )(NA )(NA )
Estimates ( 11 )NANANANANANA
(p-val)(NA )(NA )(NA )(NA )(NA )(NA )


Estimated ARIMA Residuals
Value
20.3659847106846
1971.70810145748
-2387.68735290775
-5821.11392936737
11634.8911307154
1574.83079968335
4859.91276454105
1366.43795801342
-2258.36263442572
3909.63178432313
-6376.80014581404
-2704.74217952254
-1149.80564683407
-1529.97184877498
-2705.26652682762
-9706.53841814001
14004.4922947636
4739.05793668231
8653.07871229485
141.918399780594
1486.8869121511
-796.739415799554
-5405.01707475698
-4024.13091975937
-2477.96040167454
44.8562657390313
-4422.9345864935
-11177.3957944622
13384.2482827886
2049.20143041814
5941.42575337354
526.82464338065
761.03700860487
2111.57209526295
-3546.27176750255
-3483.16086842564
-789.53823321307
2981.41662471538
-3473.1989489744
-9058.06131237842
12383.0843416023
5052.58048618018
4001.45982669082
6342.70739956457
-596.916455800668
2266.87337395827
-4247.14386651276
-4656.64338970656
-612.132472366998
516.372061232787
-7177.3403662419
-8946.15985481949
6777.91855160442
1020.46240022700
4168.30893894317
1732.22126153132
-3782.98037529028
514.792120471048
-3608.17928884841
-4647.17137107507

\begin{tabular}{lllllllll}
\hline
Estimated ARIMA Residuals \tabularnewline
Value \tabularnewline
20.3659847106846 \tabularnewline
1971.70810145748 \tabularnewline
-2387.68735290775 \tabularnewline
-5821.11392936737 \tabularnewline
11634.8911307154 \tabularnewline
1574.83079968335 \tabularnewline
4859.91276454105 \tabularnewline
1366.43795801342 \tabularnewline
-2258.36263442572 \tabularnewline
3909.63178432313 \tabularnewline
-6376.80014581404 \tabularnewline
-2704.74217952254 \tabularnewline
-1149.80564683407 \tabularnewline
-1529.97184877498 \tabularnewline
-2705.26652682762 \tabularnewline
-9706.53841814001 \tabularnewline
14004.4922947636 \tabularnewline
4739.05793668231 \tabularnewline
8653.07871229485 \tabularnewline
141.918399780594 \tabularnewline
1486.8869121511 \tabularnewline
-796.739415799554 \tabularnewline
-5405.01707475698 \tabularnewline
-4024.13091975937 \tabularnewline
-2477.96040167454 \tabularnewline
44.8562657390313 \tabularnewline
-4422.9345864935 \tabularnewline
-11177.3957944622 \tabularnewline
13384.2482827886 \tabularnewline
2049.20143041814 \tabularnewline
5941.42575337354 \tabularnewline
526.82464338065 \tabularnewline
761.03700860487 \tabularnewline
2111.57209526295 \tabularnewline
-3546.27176750255 \tabularnewline
-3483.16086842564 \tabularnewline
-789.53823321307 \tabularnewline
2981.41662471538 \tabularnewline
-3473.1989489744 \tabularnewline
-9058.06131237842 \tabularnewline
12383.0843416023 \tabularnewline
5052.58048618018 \tabularnewline
4001.45982669082 \tabularnewline
6342.70739956457 \tabularnewline
-596.916455800668 \tabularnewline
2266.87337395827 \tabularnewline
-4247.14386651276 \tabularnewline
-4656.64338970656 \tabularnewline
-612.132472366998 \tabularnewline
516.372061232787 \tabularnewline
-7177.3403662419 \tabularnewline
-8946.15985481949 \tabularnewline
6777.91855160442 \tabularnewline
1020.46240022700 \tabularnewline
4168.30893894317 \tabularnewline
1732.22126153132 \tabularnewline
-3782.98037529028 \tabularnewline
514.792120471048 \tabularnewline
-3608.17928884841 \tabularnewline
-4647.17137107507 \tabularnewline
\hline
\end{tabular}
%Source: https://freestatistics.org/blog/index.php?pk=66540&T=2

[TABLE]
[ROW][C]Estimated ARIMA Residuals[/C][/ROW]
[ROW][C]Value[/C][/ROW]
[ROW][C]20.3659847106846[/C][/ROW]
[ROW][C]1971.70810145748[/C][/ROW]
[ROW][C]-2387.68735290775[/C][/ROW]
[ROW][C]-5821.11392936737[/C][/ROW]
[ROW][C]11634.8911307154[/C][/ROW]
[ROW][C]1574.83079968335[/C][/ROW]
[ROW][C]4859.91276454105[/C][/ROW]
[ROW][C]1366.43795801342[/C][/ROW]
[ROW][C]-2258.36263442572[/C][/ROW]
[ROW][C]3909.63178432313[/C][/ROW]
[ROW][C]-6376.80014581404[/C][/ROW]
[ROW][C]-2704.74217952254[/C][/ROW]
[ROW][C]-1149.80564683407[/C][/ROW]
[ROW][C]-1529.97184877498[/C][/ROW]
[ROW][C]-2705.26652682762[/C][/ROW]
[ROW][C]-9706.53841814001[/C][/ROW]
[ROW][C]14004.4922947636[/C][/ROW]
[ROW][C]4739.05793668231[/C][/ROW]
[ROW][C]8653.07871229485[/C][/ROW]
[ROW][C]141.918399780594[/C][/ROW]
[ROW][C]1486.8869121511[/C][/ROW]
[ROW][C]-796.739415799554[/C][/ROW]
[ROW][C]-5405.01707475698[/C][/ROW]
[ROW][C]-4024.13091975937[/C][/ROW]
[ROW][C]-2477.96040167454[/C][/ROW]
[ROW][C]44.8562657390313[/C][/ROW]
[ROW][C]-4422.9345864935[/C][/ROW]
[ROW][C]-11177.3957944622[/C][/ROW]
[ROW][C]13384.2482827886[/C][/ROW]
[ROW][C]2049.20143041814[/C][/ROW]
[ROW][C]5941.42575337354[/C][/ROW]
[ROW][C]526.82464338065[/C][/ROW]
[ROW][C]761.03700860487[/C][/ROW]
[ROW][C]2111.57209526295[/C][/ROW]
[ROW][C]-3546.27176750255[/C][/ROW]
[ROW][C]-3483.16086842564[/C][/ROW]
[ROW][C]-789.53823321307[/C][/ROW]
[ROW][C]2981.41662471538[/C][/ROW]
[ROW][C]-3473.1989489744[/C][/ROW]
[ROW][C]-9058.06131237842[/C][/ROW]
[ROW][C]12383.0843416023[/C][/ROW]
[ROW][C]5052.58048618018[/C][/ROW]
[ROW][C]4001.45982669082[/C][/ROW]
[ROW][C]6342.70739956457[/C][/ROW]
[ROW][C]-596.916455800668[/C][/ROW]
[ROW][C]2266.87337395827[/C][/ROW]
[ROW][C]-4247.14386651276[/C][/ROW]
[ROW][C]-4656.64338970656[/C][/ROW]
[ROW][C]-612.132472366998[/C][/ROW]
[ROW][C]516.372061232787[/C][/ROW]
[ROW][C]-7177.3403662419[/C][/ROW]
[ROW][C]-8946.15985481949[/C][/ROW]
[ROW][C]6777.91855160442[/C][/ROW]
[ROW][C]1020.46240022700[/C][/ROW]
[ROW][C]4168.30893894317[/C][/ROW]
[ROW][C]1732.22126153132[/C][/ROW]
[ROW][C]-3782.98037529028[/C][/ROW]
[ROW][C]514.792120471048[/C][/ROW]
[ROW][C]-3608.17928884841[/C][/ROW]
[ROW][C]-4647.17137107507[/C][/ROW]
[/TABLE]
Source: https://freestatistics.org/blog/index.php?pk=66540&T=2

Globally Unique Identifier (entire table): ba.freestatistics.org/blog/index.php?pk=66540&T=2

As an alternative you can also use a QR Code:  

The GUIDs for individual cells are displayed in the table below:

Estimated ARIMA Residuals
Value
20.3659847106846
1971.70810145748
-2387.68735290775
-5821.11392936737
11634.8911307154
1574.83079968335
4859.91276454105
1366.43795801342
-2258.36263442572
3909.63178432313
-6376.80014581404
-2704.74217952254
-1149.80564683407
-1529.97184877498
-2705.26652682762
-9706.53841814001
14004.4922947636
4739.05793668231
8653.07871229485
141.918399780594
1486.8869121511
-796.739415799554
-5405.01707475698
-4024.13091975937
-2477.96040167454
44.8562657390313
-4422.9345864935
-11177.3957944622
13384.2482827886
2049.20143041814
5941.42575337354
526.82464338065
761.03700860487
2111.57209526295
-3546.27176750255
-3483.16086842564
-789.53823321307
2981.41662471538
-3473.1989489744
-9058.06131237842
12383.0843416023
5052.58048618018
4001.45982669082
6342.70739956457
-596.916455800668
2266.87337395827
-4247.14386651276
-4656.64338970656
-612.132472366998
516.372061232787
-7177.3403662419
-8946.15985481949
6777.91855160442
1020.46240022700
4168.30893894317
1732.22126153132
-3782.98037529028
514.792120471048
-3608.17928884841
-4647.17137107507


Parameters (Session):
par1 = FALSE ; par2 = 1 ; par3 = 1 ; par4 = 0 ; par5 = 12 ; par6 = 3 ; par7 = 1 ; par8 = 0 ; par9 = 0 ;
Parameters (R input):
par1 = FALSE ; par2 = 1 ; par3 = 1 ; par4 = 0 ; par5 = 12 ; par6 = 3 ; par7 = 1 ; par8 = 0 ; par9 = 0 ;
R code (references can be found in the software module):
library(lattice)
if (par1 == 'TRUE') par1 <- TRUE
if (par1 == 'FALSE') par1 <- FALSE
par2 <- as.numeric(par2) #Box-Cox lambda transformation parameter
par3 <- as.numeric(par3) #degree of non-seasonal differencing
par4 <- as.numeric(par4) #degree of seasonal differencing
par5 <- as.numeric(par5) #seasonal period
par6 <- as.numeric(par6) #degree (p) of the non-seasonal AR(p) polynomial
par6 <- 3
par7 <- as.numeric(par7) #degree (q) of the non-seasonal MA(q) polynomial
par7 <- 3
par8 <- as.numeric(par8) #degree (P) of the seasonal AR(P) polynomial
par9 <- as.numeric(par9) #degree (Q) of the seasonal MA(Q) polynomial
armaGR <- function(arima.out, names, n){
try1 <- arima.out$coef
try2 <- sqrt(diag(arima.out$var.coef))
try.data.frame <- data.frame(matrix(NA,ncol=4,nrow=length(names)))
dimnames(try.data.frame) <- list(names,c('coef','std','tstat','pv'))
try.data.frame[,1] <- try1
for(i in 1:length(try2)) try.data.frame[which(rownames(try.data.frame)==names(try2)[i]),2] <- try2[i]
try.data.frame[,3] <- try.data.frame[,1] / try.data.frame[,2]
try.data.frame[,4] <- round((1-pt(abs(try.data.frame[,3]),df=n-(length(try2)+1)))*2,5)
vector <- rep(NA,length(names))
vector[is.na(try.data.frame[,4])] <- 0
maxi <- which.max(try.data.frame[,4])
continue <- max(try.data.frame[,4],na.rm=TRUE) > .05
vector[maxi] <- 0
list(summary=try.data.frame,next.vector=vector,continue=continue)
}
arimaSelect <- function(series, order=c(13,0,0), seasonal=list(order=c(2,0,0),period=12), include.mean=F){
nrc <- order[1]+order[3]+seasonal$order[1]+seasonal$order[3]
coeff <- matrix(NA, nrow=nrc*2, ncol=nrc)
pval <- matrix(NA, nrow=nrc*2, ncol=nrc)
mylist <- rep(list(NULL), nrc)
names <- NULL
if(order[1] > 0) names <- paste('ar',1:order[1],sep='')
if(order[3] > 0) names <- c( names , paste('ma',1:order[3],sep='') )
if(seasonal$order[1] > 0) names <- c(names, paste('sar',1:seasonal$order[1],sep=''))
if(seasonal$order[3] > 0) names <- c(names, paste('sma',1:seasonal$order[3],sep=''))
arima.out <- arima(series, order=order, seasonal=seasonal, include.mean=include.mean, method='ML')
mylist[[1]] <- arima.out
last.arma <- armaGR(arima.out, names, length(series))
mystop <- FALSE
i <- 1
coeff[i,] <- last.arma[[1]][,1]
pval [i,] <- last.arma[[1]][,4]
i <- 2
aic <- arima.out$aic
while(!mystop){
mylist[[i]] <- arima.out
arima.out <- arima(series, order=order, seasonal=seasonal, include.mean=include.mean, method='ML', fixed=last.arma$next.vector)
aic <- c(aic, arima.out$aic)
last.arma <- armaGR(arima.out, names, length(series))
mystop <- !last.arma$continue
coeff[i,] <- last.arma[[1]][,1]
pval [i,] <- last.arma[[1]][,4]
i <- i+1
}
list(coeff, pval, mylist, aic=aic)
}
arimaSelectplot <- function(arimaSelect.out,noms,choix){
noms <- names(arimaSelect.out[[3]][[1]]$coef)
coeff <- arimaSelect.out[[1]]
k <- min(which(is.na(coeff[,1])))-1
coeff <- coeff[1:k,]
pval <- arimaSelect.out[[2]][1:k,]
aic <- arimaSelect.out$aic[1:k]
coeff[coeff==0] <- NA
n <- ncol(coeff)
if(missing(choix)) choix <- k
layout(matrix(c(1,1,1,2,
3,3,3,2,
3,3,3,4,
5,6,7,7),nr=4),
widths=c(10,35,45,15),
heights=c(30,30,15,15))
couleurs <- rainbow(75)[1:50]#(50)
ticks <- pretty(coeff)
par(mar=c(1,1,3,1))
plot(aic,k:1-.5,type='o',pch=21,bg='blue',cex=2,axes=F,lty=2,xpd=NA)
points(aic[choix],k-choix+.5,pch=21,cex=4,bg=2,xpd=NA)
title('aic',line=2)
par(mar=c(3,0,0,0))
plot(0,axes=F,xlab='',ylab='',xlim=range(ticks),ylim=c(.1,1))
rect(xleft = min(ticks) + (0:49)/50*(max(ticks)-min(ticks)),
xright = min(ticks) + (1:50)/50*(max(ticks)-min(ticks)),
ytop = rep(1,50),
ybottom= rep(0,50),col=couleurs,border=NA)
axis(1,ticks)
rect(xleft=min(ticks),xright=max(ticks),ytop=1,ybottom=0)
text(mean(coeff,na.rm=T),.5,'coefficients',cex=2,font=2)
par(mar=c(1,1,3,1))
image(1:n,1:k,t(coeff[k:1,]),axes=F,col=couleurs,zlim=range(ticks))
for(i in 1:n) for(j in 1:k) if(!is.na(coeff[j,i])) {
if(pval[j,i]<.01) symb = 'green'
else if( (pval[j,i]<.05) & (pval[j,i]>=.01)) symb = 'orange'
else if( (pval[j,i]<.1) & (pval[j,i]>=.05)) symb = 'red'
else symb = 'black'
polygon(c(i+.5 ,i+.2 ,i+.5 ,i+.5),
c(k-j+0.5,k-j+0.5,k-j+0.8,k-j+0.5),
col=symb)
if(j==choix) {
rect(xleft=i-.5,
xright=i+.5,
ybottom=k-j+1.5,
ytop=k-j+.5,
lwd=4)
text(i,
k-j+1,
round(coeff[j,i],2),
cex=1.2,
font=2)
}
else{
rect(xleft=i-.5,xright=i+.5,ybottom=k-j+1.5,ytop=k-j+.5)
text(i,k-j+1,round(coeff[j,i],2),cex=1.2,font=1)
}
}
axis(3,1:n,noms)
par(mar=c(0.5,0,0,0.5))
plot(0,axes=F,xlab='',ylab='',type='n',xlim=c(0,8),ylim=c(-.2,.8))
cols <- c('green','orange','red','black')
niv <- c('0','0.01','0.05','0.1')
for(i in 0:3){
polygon(c(1+2*i ,1+2*i ,1+2*i-.5 ,1+2*i),
c(.4 ,.7 , .4 , .4),
col=cols[i+1])
text(2*i,0.5,niv[i+1],cex=1.5)
}
text(8,.5,1,cex=1.5)
text(4,0,'p-value',cex=2)
box()
residus <- arimaSelect.out[[3]][[choix]]$res
par(mar=c(1,2,4,1))
acf(residus,main='')
title('acf',line=.5)
par(mar=c(1,2,4,1))
pacf(residus,main='')
title('pacf',line=.5)
par(mar=c(2,2,4,1))
qqnorm(residus,main='')
title('qq-norm',line=.5)
qqline(residus)
residus
}
if (par2 == 0) x <- log(x)
if (par2 != 0) x <- x^par2
(selection <- arimaSelect(x, order=c(par6,par3,par7), seasonal=list(order=c(par8,par4,par9), period=par5)))
bitmap(file='test1.png')
resid <- arimaSelectplot(selection)
dev.off()
resid
bitmap(file='test2.png')
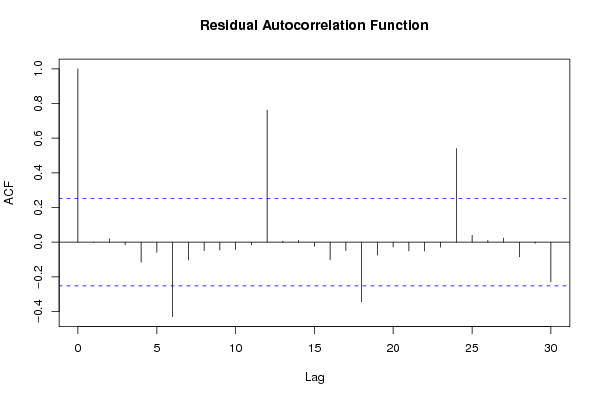
acf(resid,length(resid)/2, main='Residual Autocorrelation Function')
dev.off()
bitmap(file='test3.png')
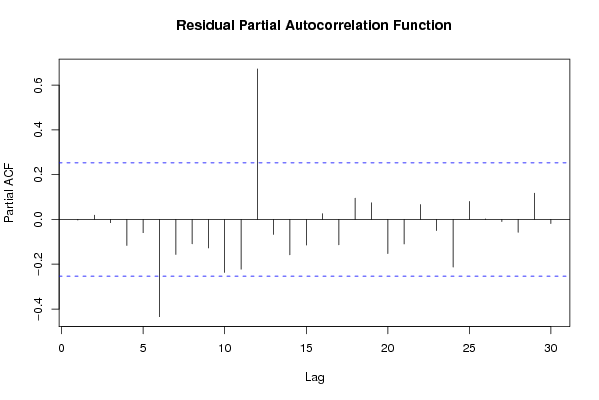
pacf(resid,length(resid)/2, main='Residual Partial Autocorrelation Function')
dev.off()
bitmap(file='test4.png')
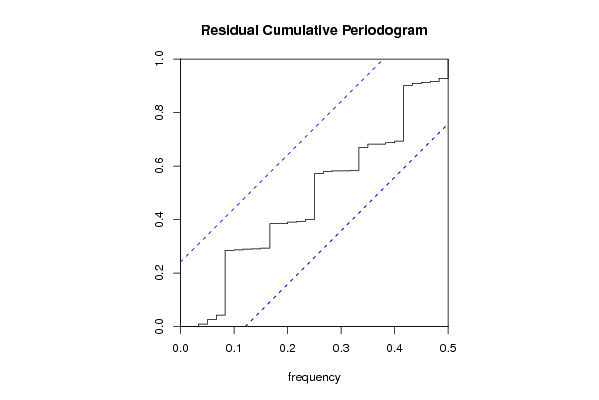
cpgram(resid, main='Residual Cumulative Periodogram')
dev.off()
bitmap(file='test5.png')
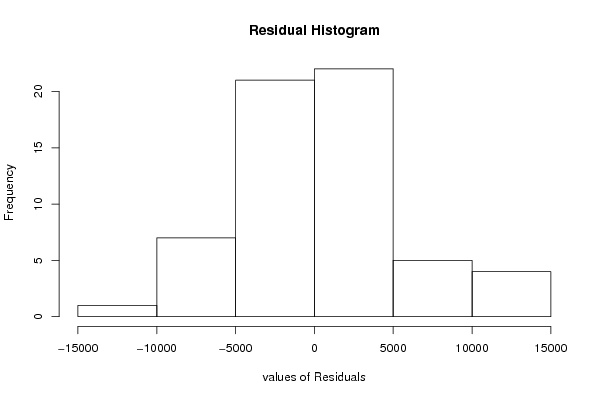
hist(resid, main='Residual Histogram', xlab='values of Residuals')
dev.off()
bitmap(file='test6.png')
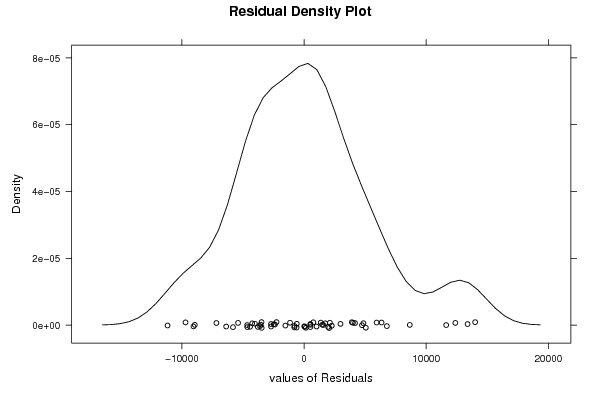
densityplot(~resid,col='black',main='Residual Density Plot', xlab='values of Residuals')
dev.off()
bitmap(file='test7.png')
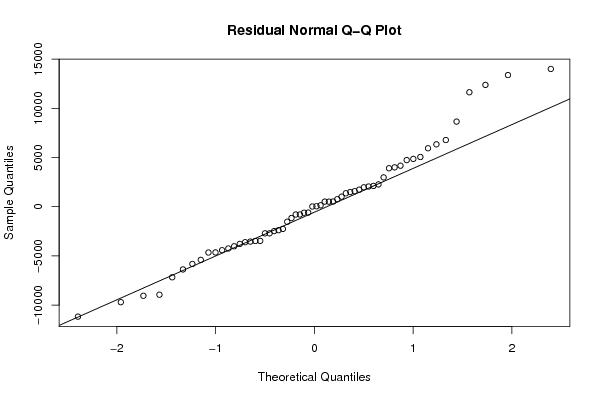
qqnorm(resid, main='Residual Normal Q-Q Plot')
qqline(resid)
dev.off()
ncols <- length(selection[[1]][1,])
nrows <- length(selection[[2]][,1])-1
load(file='createtable')
a<-table.start()
a<-table.row.start(a)
a<-table.element(a,'ARIMA Parameter Estimation and Backward Selection', ncols+1,TRUE)
a<-table.row.end(a)
a<-table.row.start(a)
a<-table.element(a,'Iteration', header=TRUE)
for (i in 1:ncols) {
a<-table.element(a,names(selection[[3]][[1]]$coef)[i],header=TRUE)
}
a<-table.row.end(a)
for (j in 1:nrows) {
a<-table.row.start(a)
mydum <- 'Estimates ('
mydum <- paste(mydum,j)
mydum <- paste(mydum,')')
a<-table.element(a,mydum, header=TRUE)
for (i in 1:ncols) {
a<-table.element(a,round(selection[[1]][j,i],4))
}
a<-table.row.end(a)
a<-table.row.start(a)
a<-table.element(a,'(p-val)', header=TRUE)
for (i in 1:ncols) {
mydum <- '('
mydum <- paste(mydum,round(selection[[2]][j,i],4),sep='')
mydum <- paste(mydum,')')
a<-table.element(a,mydum)
}
a<-table.row.end(a)
}
a<-table.end(a)
table.save(a,file='mytable.tab')
a<-table.start()
a<-table.row.start(a)
a<-table.element(a,'Estimated ARIMA Residuals', 1,TRUE)
a<-table.row.end(a)
a<-table.row.start(a)
a<-table.element(a,'Value', 1,TRUE)
a<-table.row.end(a)
for (i in (par4*par5+par3):length(resid)) {
a<-table.row.start(a)
a<-table.element(a,resid[i])
a<-table.row.end(a)
}
a<-table.end(a)
table.save(a,file='mytable1.tab')