Free Statistics

of Irreproducible Research!

Author's title

Author*The author of this computation has been verified*
R Software Modulerwasp_exponentialsmoothing.wasp
Title produced by softwareExponential Smoothing
Date of computationFri, 11 Dec 2009 09:29:38 -0700
Cite this page as followsStatistical Computations at FreeStatistics.org, Office for Research Development and Education, URL https://freestatistics.org/blog/index.php?v=date/2009/Dec/11/t1260549035a30xy065dsmt6a2.htm/, Retrieved Sun, 28 Apr 2024 21:25:54 +0000
Statistical Computations at FreeStatistics.org, Office for Research Development and Education, URL https://freestatistics.org/blog/index.php?pk=66490, Retrieved Sun, 28 Apr 2024 21:25:54 +0000
QR Codes:

Original text written by user:
IsPrivate?No (this computation is public)
User-defined keywords
Estimated Impact105
Family? (F = Feedback message, R = changed R code, M = changed R Module, P = changed Parameters, D = changed Data)
-     [Univariate Data Series] [data set] [2008-12-01 19:54:57] [b98453cac15ba1066b407e146608df68]
- RMP   [Exponential Smoothing] [] [2009-11-27 15:04:36] [b98453cac15ba1066b407e146608df68]
- R  D    [Exponential Smoothing] [Shwws9_v2] [2009-12-09 18:52:11] [5f89c040fdf1f8599c99d7f78a662321]
-    D        [Exponential Smoothing] [Shwws9_v2] [2009-12-11 16:29:38] [93b66894f6318f3da4fcda772f2ffa6f] [Current]
Feedback Forum

Post a new message
Dataseries X:
102.1
102.86
102.99
103.73
105.02
104.43
104.63
104.93
105.87
105.66
106.76
106
107.22
107.33
107.11
108.86
107.72
107.88
108.38
107.72
108.41
109.9
111.45
112.18
113.34
113.46
114.06
115.54
116.39
115.94
116.97
115.94
115.91
116.43
116.26
116.35
117.9
117.7
117.53
117.86
117.65
116.51
115.93
115.31
115


Summary of computational transaction
Raw Inputview raw input (R code)
Raw Outputview raw output of R engine
Computing time3 seconds
R Server'Gwilym Jenkins' @ 72.249.127.135

\begin{tabular}{lllllllll}
\hline
Summary of computational transaction \tabularnewline
Raw Input & view raw input (R code)  \tabularnewline
Raw Output & view raw output of R engine  \tabularnewline
Computing time & 3 seconds \tabularnewline
R Server & 'Gwilym Jenkins' @ 72.249.127.135 \tabularnewline
\hline
\end{tabular}
%Source: https://freestatistics.org/blog/index.php?pk=66490&T=0

[TABLE]
[ROW][C]Summary of computational transaction[/C][/ROW]
[ROW][C]Raw Input[/C][C]view raw input (R code) [/C][/ROW]
[ROW][C]Raw Output[/C][C]view raw output of R engine [/C][/ROW]
[ROW][C]Computing time[/C][C]3 seconds[/C][/ROW]
[ROW][C]R Server[/C][C]'Gwilym Jenkins' @ 72.249.127.135[/C][/ROW]
[/TABLE]
Source: https://freestatistics.org/blog/index.php?pk=66490&T=0

Globally Unique Identifier (entire table): ba.freestatistics.org/blog/index.php?pk=66490&T=0

As an alternative you can also use a QR Code:  

The GUIDs for individual cells are displayed in the table below:

Summary of computational transaction
Raw Inputview raw input (R code)
Raw Outputview raw output of R engine
Computing time3 seconds
R Server'Gwilym Jenkins' @ 72.249.127.135


Estimated Parameters of Exponential Smoothing
ParameterValue
alpha0.781527354716212
beta0.167068730875885
gamma1

\begin{tabular}{lllllllll}
\hline
Estimated Parameters of Exponential Smoothing \tabularnewline
Parameter & Value \tabularnewline
alpha & 0.781527354716212 \tabularnewline
beta & 0.167068730875885 \tabularnewline
gamma & 1 \tabularnewline
\hline
\end{tabular}
%Source: https://freestatistics.org/blog/index.php?pk=66490&T=1

[TABLE]
[ROW][C]Estimated Parameters of Exponential Smoothing[/C][/ROW]
[ROW][C]Parameter[/C][C]Value[/C][/ROW]
[ROW][C]alpha[/C][C]0.781527354716212[/C][/ROW]
[ROW][C]beta[/C][C]0.167068730875885[/C][/ROW]
[ROW][C]gamma[/C][C]1[/C][/ROW]
[/TABLE]
Source: https://freestatistics.org/blog/index.php?pk=66490&T=1

Globally Unique Identifier (entire table): ba.freestatistics.org/blog/index.php?pk=66490&T=1

As an alternative you can also use a QR Code:  

The GUIDs for individual cells are displayed in the table below:

Estimated Parameters of Exponential Smoothing
ParameterValue
alpha0.781527354716212
beta0.167068730875885
gamma1


Interpolation Forecasts of Exponential Smoothing
tObservedFittedResiduals
13107.22105.2672614968371.95273850316312
14107.33107.1967886149640.133211385035580
15107.11107.440213638756-0.33021363875568
16108.86109.192405401537-0.332405401537116
17107.72107.915115055254-0.195115055254206
18107.88107.939844697002-0.0598446970022053
19108.38108.726662894449-0.346662894449253
20107.72108.769652750896-1.04965275089566
21108.41108.82763777212-0.417637772119988
22109.9108.1168564990681.78314350093233
23111.45110.7717610507780.678238949221722
24112.18110.7879373960921.39206260390803
25113.34114.031755868548-0.691755868548086
26113.46113.539795156877-0.0797951568771111
27114.06113.5317606081040.528239391896165
28115.54116.209424535710-0.669424535709823
29116.39114.7218517132041.66814828679625
30115.94116.5706971202-0.630697120199969
31116.97117.156822878021-0.186822878021488
32115.94117.45387530098-1.51387530098005
33115.91117.59093443875-1.68093443874993
34116.43116.439547916341-0.0095479163409209
35116.26117.329358455594-1.06935845559369
36116.35115.7114169657340.638583034266318
37117.9117.4618017123730.438198287627401
38117.7117.6340260345620.065973965438431
39117.53117.541630755777-0.0116307557772899
40117.86119.185354590308-1.32535459030792
41117.65117.1970422387270.452957761272913
42116.51116.959900913531-0.449900913531437
43115.93117.182351202069-1.25235120206877
44115.31115.617201985121-0.307201985120514
45115116.066295343314-1.06629534331367

\begin{tabular}{lllllllll}
\hline
Interpolation Forecasts of Exponential Smoothing \tabularnewline
t & Observed & Fitted & Residuals \tabularnewline
13 & 107.22 & 105.267261496837 & 1.95273850316312 \tabularnewline
14 & 107.33 & 107.196788614964 & 0.133211385035580 \tabularnewline
15 & 107.11 & 107.440213638756 & -0.33021363875568 \tabularnewline
16 & 108.86 & 109.192405401537 & -0.332405401537116 \tabularnewline
17 & 107.72 & 107.915115055254 & -0.195115055254206 \tabularnewline
18 & 107.88 & 107.939844697002 & -0.0598446970022053 \tabularnewline
19 & 108.38 & 108.726662894449 & -0.346662894449253 \tabularnewline
20 & 107.72 & 108.769652750896 & -1.04965275089566 \tabularnewline
21 & 108.41 & 108.82763777212 & -0.417637772119988 \tabularnewline
22 & 109.9 & 108.116856499068 & 1.78314350093233 \tabularnewline
23 & 111.45 & 110.771761050778 & 0.678238949221722 \tabularnewline
24 & 112.18 & 110.787937396092 & 1.39206260390803 \tabularnewline
25 & 113.34 & 114.031755868548 & -0.691755868548086 \tabularnewline
26 & 113.46 & 113.539795156877 & -0.0797951568771111 \tabularnewline
27 & 114.06 & 113.531760608104 & 0.528239391896165 \tabularnewline
28 & 115.54 & 116.209424535710 & -0.669424535709823 \tabularnewline
29 & 116.39 & 114.721851713204 & 1.66814828679625 \tabularnewline
30 & 115.94 & 116.5706971202 & -0.630697120199969 \tabularnewline
31 & 116.97 & 117.156822878021 & -0.186822878021488 \tabularnewline
32 & 115.94 & 117.45387530098 & -1.51387530098005 \tabularnewline
33 & 115.91 & 117.59093443875 & -1.68093443874993 \tabularnewline
34 & 116.43 & 116.439547916341 & -0.0095479163409209 \tabularnewline
35 & 116.26 & 117.329358455594 & -1.06935845559369 \tabularnewline
36 & 116.35 & 115.711416965734 & 0.638583034266318 \tabularnewline
37 & 117.9 & 117.461801712373 & 0.438198287627401 \tabularnewline
38 & 117.7 & 117.634026034562 & 0.065973965438431 \tabularnewline
39 & 117.53 & 117.541630755777 & -0.0116307557772899 \tabularnewline
40 & 117.86 & 119.185354590308 & -1.32535459030792 \tabularnewline
41 & 117.65 & 117.197042238727 & 0.452957761272913 \tabularnewline
42 & 116.51 & 116.959900913531 & -0.449900913531437 \tabularnewline
43 & 115.93 & 117.182351202069 & -1.25235120206877 \tabularnewline
44 & 115.31 & 115.617201985121 & -0.307201985120514 \tabularnewline
45 & 115 & 116.066295343314 & -1.06629534331367 \tabularnewline
\hline
\end{tabular}
%Source: https://freestatistics.org/blog/index.php?pk=66490&T=2

[TABLE]
[ROW][C]Interpolation Forecasts of Exponential Smoothing[/C][/ROW]
[ROW][C]t[/C][C]Observed[/C][C]Fitted[/C][C]Residuals[/C][/ROW]
[ROW][C]13[/C][C]107.22[/C][C]105.267261496837[/C][C]1.95273850316312[/C][/ROW]
[ROW][C]14[/C][C]107.33[/C][C]107.196788614964[/C][C]0.133211385035580[/C][/ROW]
[ROW][C]15[/C][C]107.11[/C][C]107.440213638756[/C][C]-0.33021363875568[/C][/ROW]
[ROW][C]16[/C][C]108.86[/C][C]109.192405401537[/C][C]-0.332405401537116[/C][/ROW]
[ROW][C]17[/C][C]107.72[/C][C]107.915115055254[/C][C]-0.195115055254206[/C][/ROW]
[ROW][C]18[/C][C]107.88[/C][C]107.939844697002[/C][C]-0.0598446970022053[/C][/ROW]
[ROW][C]19[/C][C]108.38[/C][C]108.726662894449[/C][C]-0.346662894449253[/C][/ROW]
[ROW][C]20[/C][C]107.72[/C][C]108.769652750896[/C][C]-1.04965275089566[/C][/ROW]
[ROW][C]21[/C][C]108.41[/C][C]108.82763777212[/C][C]-0.417637772119988[/C][/ROW]
[ROW][C]22[/C][C]109.9[/C][C]108.116856499068[/C][C]1.78314350093233[/C][/ROW]
[ROW][C]23[/C][C]111.45[/C][C]110.771761050778[/C][C]0.678238949221722[/C][/ROW]
[ROW][C]24[/C][C]112.18[/C][C]110.787937396092[/C][C]1.39206260390803[/C][/ROW]
[ROW][C]25[/C][C]113.34[/C][C]114.031755868548[/C][C]-0.691755868548086[/C][/ROW]
[ROW][C]26[/C][C]113.46[/C][C]113.539795156877[/C][C]-0.0797951568771111[/C][/ROW]
[ROW][C]27[/C][C]114.06[/C][C]113.531760608104[/C][C]0.528239391896165[/C][/ROW]
[ROW][C]28[/C][C]115.54[/C][C]116.209424535710[/C][C]-0.669424535709823[/C][/ROW]
[ROW][C]29[/C][C]116.39[/C][C]114.721851713204[/C][C]1.66814828679625[/C][/ROW]
[ROW][C]30[/C][C]115.94[/C][C]116.5706971202[/C][C]-0.630697120199969[/C][/ROW]
[ROW][C]31[/C][C]116.97[/C][C]117.156822878021[/C][C]-0.186822878021488[/C][/ROW]
[ROW][C]32[/C][C]115.94[/C][C]117.45387530098[/C][C]-1.51387530098005[/C][/ROW]
[ROW][C]33[/C][C]115.91[/C][C]117.59093443875[/C][C]-1.68093443874993[/C][/ROW]
[ROW][C]34[/C][C]116.43[/C][C]116.439547916341[/C][C]-0.0095479163409209[/C][/ROW]
[ROW][C]35[/C][C]116.26[/C][C]117.329358455594[/C][C]-1.06935845559369[/C][/ROW]
[ROW][C]36[/C][C]116.35[/C][C]115.711416965734[/C][C]0.638583034266318[/C][/ROW]
[ROW][C]37[/C][C]117.9[/C][C]117.461801712373[/C][C]0.438198287627401[/C][/ROW]
[ROW][C]38[/C][C]117.7[/C][C]117.634026034562[/C][C]0.065973965438431[/C][/ROW]
[ROW][C]39[/C][C]117.53[/C][C]117.541630755777[/C][C]-0.0116307557772899[/C][/ROW]
[ROW][C]40[/C][C]117.86[/C][C]119.185354590308[/C][C]-1.32535459030792[/C][/ROW]
[ROW][C]41[/C][C]117.65[/C][C]117.197042238727[/C][C]0.452957761272913[/C][/ROW]
[ROW][C]42[/C][C]116.51[/C][C]116.959900913531[/C][C]-0.449900913531437[/C][/ROW]
[ROW][C]43[/C][C]115.93[/C][C]117.182351202069[/C][C]-1.25235120206877[/C][/ROW]
[ROW][C]44[/C][C]115.31[/C][C]115.617201985121[/C][C]-0.307201985120514[/C][/ROW]
[ROW][C]45[/C][C]115[/C][C]116.066295343314[/C][C]-1.06629534331367[/C][/ROW]
[/TABLE]
Source: https://freestatistics.org/blog/index.php?pk=66490&T=2

Globally Unique Identifier (entire table): ba.freestatistics.org/blog/index.php?pk=66490&T=2

As an alternative you can also use a QR Code:  

The GUIDs for individual cells are displayed in the table below:

Interpolation Forecasts of Exponential Smoothing
tObservedFittedResiduals
13107.22105.2672614968371.95273850316312
14107.33107.1967886149640.133211385035580
15107.11107.440213638756-0.33021363875568
16108.86109.192405401537-0.332405401537116
17107.72107.915115055254-0.195115055254206
18107.88107.939844697002-0.0598446970022053
19108.38108.726662894449-0.346662894449253
20107.72108.769652750896-1.04965275089566
21108.41108.82763777212-0.417637772119988
22109.9108.1168564990681.78314350093233
23111.45110.7717610507780.678238949221722
24112.18110.7879373960921.39206260390803
25113.34114.031755868548-0.691755868548086
26113.46113.539795156877-0.0797951568771111
27114.06113.5317606081040.528239391896165
28115.54116.209424535710-0.669424535709823
29116.39114.7218517132041.66814828679625
30115.94116.5706971202-0.630697120199969
31116.97117.156822878021-0.186822878021488
32115.94117.45387530098-1.51387530098005
33115.91117.59093443875-1.68093443874993
34116.43116.439547916341-0.0095479163409209
35116.26117.329358455594-1.06935845559369
36116.35115.7114169657340.638583034266318
37117.9117.4618017123730.438198287627401
38117.7117.6340260345620.065973965438431
39117.53117.541630755777-0.0116307557772899
40117.86119.185354590308-1.32535459030792
41117.65117.1970422387270.452957761272913
42116.51116.959900913531-0.449900913531437
43115.93117.182351202069-1.25235120206877
44115.31115.617201985121-0.307201985120514
45115116.066295343314-1.06629534331367


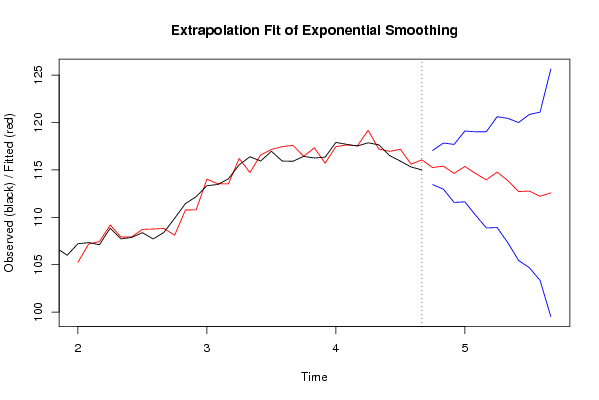
Extrapolation Forecasts of Exponential Smoothing
tForecast95% Lower Bound95% Upper Bound
46115.251016111138113.455650371297117.046381850979
47115.403023555089112.969626583469117.836420526709
48114.630344496376111.569387770653117.691301222099
49115.369038253103111.631510919358119.106565586847
50114.620191651546110.223876054895119.016507248197
51113.955922364756108.878998151014119.032846578499
52114.768465675007108.922918655949120.614012694064
53113.878539692984107.319242628010120.437836757959
54112.721572721518105.447905409429119.995240033607
55112.767700492496104.684804747219120.850596237773
56112.219088527184103.344746399564121.093430654804
57112.58614874971999.5228850780697125.649412421368

\begin{tabular}{lllllllll}
\hline
Extrapolation Forecasts of Exponential Smoothing \tabularnewline
t & Forecast & 95% Lower Bound & 95% Upper Bound \tabularnewline
46 & 115.251016111138 & 113.455650371297 & 117.046381850979 \tabularnewline
47 & 115.403023555089 & 112.969626583469 & 117.836420526709 \tabularnewline
48 & 114.630344496376 & 111.569387770653 & 117.691301222099 \tabularnewline
49 & 115.369038253103 & 111.631510919358 & 119.106565586847 \tabularnewline
50 & 114.620191651546 & 110.223876054895 & 119.016507248197 \tabularnewline
51 & 113.955922364756 & 108.878998151014 & 119.032846578499 \tabularnewline
52 & 114.768465675007 & 108.922918655949 & 120.614012694064 \tabularnewline
53 & 113.878539692984 & 107.319242628010 & 120.437836757959 \tabularnewline
54 & 112.721572721518 & 105.447905409429 & 119.995240033607 \tabularnewline
55 & 112.767700492496 & 104.684804747219 & 120.850596237773 \tabularnewline
56 & 112.219088527184 & 103.344746399564 & 121.093430654804 \tabularnewline
57 & 112.586148749719 & 99.5228850780697 & 125.649412421368 \tabularnewline
\hline
\end{tabular}
%Source: https://freestatistics.org/blog/index.php?pk=66490&T=3

[TABLE]
[ROW][C]Extrapolation Forecasts of Exponential Smoothing[/C][/ROW]
[ROW][C]t[/C][C]Forecast[/C][C]95% Lower Bound[/C][C]95% Upper Bound[/C][/ROW]
[ROW][C]46[/C][C]115.251016111138[/C][C]113.455650371297[/C][C]117.046381850979[/C][/ROW]
[ROW][C]47[/C][C]115.403023555089[/C][C]112.969626583469[/C][C]117.836420526709[/C][/ROW]
[ROW][C]48[/C][C]114.630344496376[/C][C]111.569387770653[/C][C]117.691301222099[/C][/ROW]
[ROW][C]49[/C][C]115.369038253103[/C][C]111.631510919358[/C][C]119.106565586847[/C][/ROW]
[ROW][C]50[/C][C]114.620191651546[/C][C]110.223876054895[/C][C]119.016507248197[/C][/ROW]
[ROW][C]51[/C][C]113.955922364756[/C][C]108.878998151014[/C][C]119.032846578499[/C][/ROW]
[ROW][C]52[/C][C]114.768465675007[/C][C]108.922918655949[/C][C]120.614012694064[/C][/ROW]
[ROW][C]53[/C][C]113.878539692984[/C][C]107.319242628010[/C][C]120.437836757959[/C][/ROW]
[ROW][C]54[/C][C]112.721572721518[/C][C]105.447905409429[/C][C]119.995240033607[/C][/ROW]
[ROW][C]55[/C][C]112.767700492496[/C][C]104.684804747219[/C][C]120.850596237773[/C][/ROW]
[ROW][C]56[/C][C]112.219088527184[/C][C]103.344746399564[/C][C]121.093430654804[/C][/ROW]
[ROW][C]57[/C][C]112.586148749719[/C][C]99.5228850780697[/C][C]125.649412421368[/C][/ROW]
[/TABLE]
Source: https://freestatistics.org/blog/index.php?pk=66490&T=3

Globally Unique Identifier (entire table): ba.freestatistics.org/blog/index.php?pk=66490&T=3

As an alternative you can also use a QR Code:  

The GUIDs for individual cells are displayed in the table below:

Extrapolation Forecasts of Exponential Smoothing
tForecast95% Lower Bound95% Upper Bound
46115.251016111138113.455650371297117.046381850979
47115.403023555089112.969626583469117.836420526709
48114.630344496376111.569387770653117.691301222099
49115.369038253103111.631510919358119.106565586847
50114.620191651546110.223876054895119.016507248197
51113.955922364756108.878998151014119.032846578499
52114.768465675007108.922918655949120.614012694064
53113.878539692984107.319242628010120.437836757959
54112.721572721518105.447905409429119.995240033607
55112.767700492496104.684804747219120.850596237773
56112.219088527184103.344746399564121.093430654804
57112.58614874971999.5228850780697125.649412421368


Parameters (Session):
par1 = 12 ; par2 = Triple ; par3 = multiplicative ;
Parameters (R input):
par1 = 12 ; par2 = Triple ; par3 = multiplicative ;
R code (references can be found in the software module):
par1 <- as.numeric(par1)
if (par2 == 'Single') K <- 1
if (par2 == 'Double') K <- 2
if (par2 == 'Triple') K <- par1
nx <- length(x)
nxmK <- nx - K
x <- ts(x, frequency = par1)
if (par2 == 'Single') fit <- HoltWinters(x, gamma=0, beta=0)
if (par2 == 'Double') fit <- HoltWinters(x, gamma=0)
if (par2 == 'Triple') fit <- HoltWinters(x, seasonal=par3)
fit
myresid <- x - fit$fitted[,'xhat']
bitmap(file='test1.png')
op <- par(mfrow=c(2,1))
plot(fit,ylab='Observed (black) / Fitted (red)',main='Interpolation Fit of Exponential Smoothing')
plot(myresid,ylab='Residuals',main='Interpolation Prediction Errors')
par(op)
dev.off()
bitmap(file='test2.png')
p <- predict(fit, par1, prediction.interval=TRUE)
np <- length(p[,1])
plot(fit,p,ylab='Observed (black) / Fitted (red)',main='Extrapolation Fit of Exponential Smoothing')
dev.off()
bitmap(file='test3.png')
op <- par(mfrow = c(2,2))
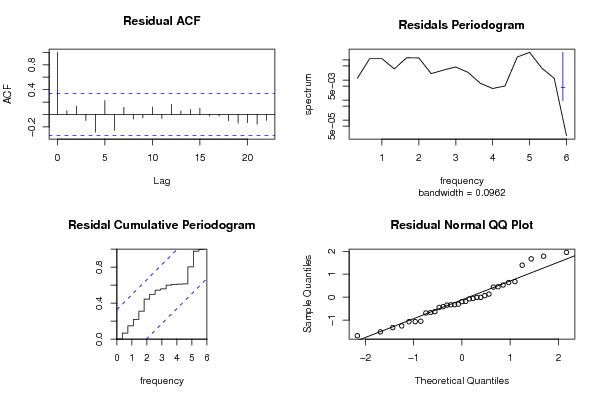
acf(as.numeric(myresid),lag.max = nx/2,main='Residual ACF')
spectrum(myresid,main='Residals Periodogram')
cpgram(myresid,main='Residal Cumulative Periodogram')
qqnorm(myresid,main='Residual Normal QQ Plot')
qqline(myresid)
par(op)
dev.off()
load(file='createtable')
a<-table.start()
a<-table.row.start(a)
a<-table.element(a,'Estimated Parameters of Exponential Smoothing',2,TRUE)
a<-table.row.end(a)
a<-table.row.start(a)
a<-table.element(a,'Parameter',header=TRUE)
a<-table.element(a,'Value',header=TRUE)
a<-table.row.end(a)
a<-table.row.start(a)
a<-table.element(a,'alpha',header=TRUE)
a<-table.element(a,fit$alpha)
a<-table.row.end(a)
a<-table.row.start(a)
a<-table.element(a,'beta',header=TRUE)
a<-table.element(a,fit$beta)
a<-table.row.end(a)
a<-table.row.start(a)
a<-table.element(a,'gamma',header=TRUE)
a<-table.element(a,fit$gamma)
a<-table.row.end(a)
a<-table.end(a)
table.save(a,file='mytable.tab')
a<-table.start()
a<-table.row.start(a)
a<-table.element(a,'Interpolation Forecasts of Exponential Smoothing',4,TRUE)
a<-table.row.end(a)
a<-table.row.start(a)
a<-table.element(a,'t',header=TRUE)
a<-table.element(a,'Observed',header=TRUE)
a<-table.element(a,'Fitted',header=TRUE)
a<-table.element(a,'Residuals',header=TRUE)
a<-table.row.end(a)
for (i in 1:nxmK) {
a<-table.row.start(a)
a<-table.element(a,i+K,header=TRUE)
a<-table.element(a,x[i+K])
a<-table.element(a,fit$fitted[i,'xhat'])
a<-table.element(a,myresid[i])
a<-table.row.end(a)
}
a<-table.end(a)
table.save(a,file='mytable1.tab')
a<-table.start()
a<-table.row.start(a)
a<-table.element(a,'Extrapolation Forecasts of Exponential Smoothing',4,TRUE)
a<-table.row.end(a)
a<-table.row.start(a)
a<-table.element(a,'t',header=TRUE)
a<-table.element(a,'Forecast',header=TRUE)
a<-table.element(a,'95% Lower Bound',header=TRUE)
a<-table.element(a,'95% Upper Bound',header=TRUE)
a<-table.row.end(a)
for (i in 1:np) {
a<-table.row.start(a)
a<-table.element(a,nx+i,header=TRUE)
a<-table.element(a,p[i,'fit'])
a<-table.element(a,p[i,'lwr'])
a<-table.element(a,p[i,'upr'])
a<-table.row.end(a)
}
a<-table.end(a)
table.save(a,file='mytable2.tab')