Free Statistics

of Irreproducible Research!

Author's title

Author*The author of this computation has been verified*
R Software Modulerwasp_arimaforecasting.wasp
Title produced by softwareARIMA Forecasting
Date of computationFri, 11 Dec 2009 08:28:17 -0700
Cite this page as followsStatistical Computations at FreeStatistics.org, Office for Research Development and Education, URL https://freestatistics.org/blog/index.php?v=date/2009/Dec/11/t1260545348ww3sxdschxcv351.htm/, Retrieved Mon, 29 Apr 2024 01:23:57 +0000
Statistical Computations at FreeStatistics.org, Office for Research Development and Education, URL https://freestatistics.org/blog/index.php?pk=66350, Retrieved Mon, 29 Apr 2024 01:23:57 +0000
QR Codes:

Original text written by user:
IsPrivate?No (this computation is public)
User-defined keywords
Estimated Impact111
Family? (F = Feedback message, R = changed R code, M = changed R Module, P = changed Parameters, D = changed Data)
-     [ARIMA Forecasting] [] [2009-12-07 09:54:52] [b98453cac15ba1066b407e146608df68]
-   PD    [ARIMA Forecasting] [] [2009-12-11 15:28:17] [54f12ba6dfaf5b88c7c2745223d9c32f] [Current]
Feedback Forum

Post a new message
Dataseries X:
20366
22782
19169
13807
29743
25591
29096
26482
22405
27044
17970
18730
19684
19785
18479
10698
31956
29506
34506
27165
26736
23691
18157
17328
18205
20995
17382
9367
31124
26551
30651
25859
25100
25778
20418
18688
20424
24776
19814
12738
31566
30111
30019
31934
25826
26835
20205
17789
20520
22518
15572
11509
25447
24090
27786
26195
20516
22759
19028
16971
20036


Summary of computational transaction
Raw Inputview raw input (R code)
Raw Outputview raw output of R engine
Computing time3 seconds
R Server'Gwilym Jenkins' @ 72.249.127.135

\begin{tabular}{lllllllll}
\hline
Summary of computational transaction \tabularnewline
Raw Input & view raw input (R code)  \tabularnewline
Raw Output & view raw output of R engine  \tabularnewline
Computing time & 3 seconds \tabularnewline
R Server & 'Gwilym Jenkins' @ 72.249.127.135 \tabularnewline
\hline
\end{tabular}
%Source: https://freestatistics.org/blog/index.php?pk=66350&T=0

[TABLE]
[ROW][C]Summary of computational transaction[/C][/ROW]
[ROW][C]Raw Input[/C][C]view raw input (R code) [/C][/ROW]
[ROW][C]Raw Output[/C][C]view raw output of R engine [/C][/ROW]
[ROW][C]Computing time[/C][C]3 seconds[/C][/ROW]
[ROW][C]R Server[/C][C]'Gwilym Jenkins' @ 72.249.127.135[/C][/ROW]
[/TABLE]
Source: https://freestatistics.org/blog/index.php?pk=66350&T=0

Globally Unique Identifier (entire table): ba.freestatistics.org/blog/index.php?pk=66350&T=0

As an alternative you can also use a QR Code:  

The GUIDs for individual cells are displayed in the table below:

Summary of computational transaction
Raw Inputview raw input (R code)
Raw Outputview raw output of R engine
Computing time3 seconds
R Server'Gwilym Jenkins' @ 72.249.127.135


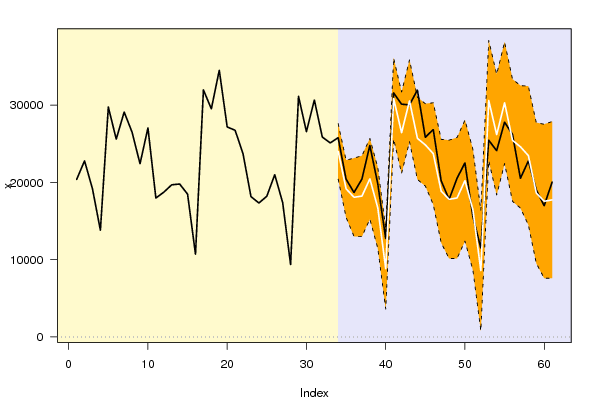
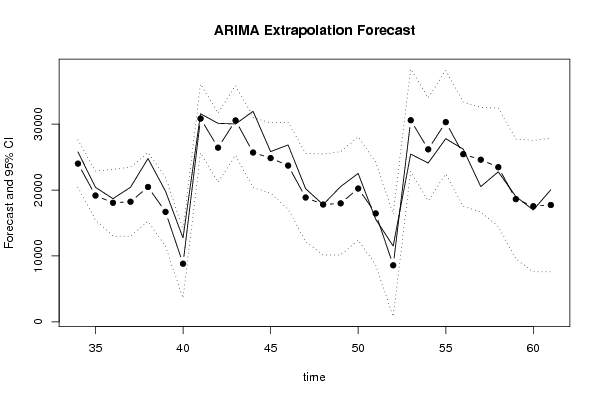
Univariate ARIMA Extrapolation Forecast
timeY[t]F[t]95% LB95% UBp-value(H0: Y[t] = F[t])P(F[t]>Y[t-1])P(F[t]>Y[t-s])P(F[t]>Y[33])
2126736-------
2223691-------
2318157-------
2417328-------
2518205-------
2620995-------
2717382-------
289367-------
2931124-------
3026551-------
3130651-------
3225859-------
3325100-------
342577824007.980620415.684227600.2770.16710.27560.56870.2756
352041819164.496415459.42822869.56490.25362e-040.7038e-04
361868818070.916613008.442223133.3910.40560.18180.61320.0033
372042418225.810713003.499423448.1220.20470.43110.50310.0049
382477620462.613815242.830725682.39690.05270.50580.42080.0408
391981416689.178911456.998621921.35920.12090.00120.39768e-04
40127388831.00833593.628214068.38850.071900.42050
413156630835.638725603.413536067.86390.392210.4570.9842
423011126424.785321173.655331675.91530.08440.02750.48120.6895
433001930547.6925259.771335835.60870.42230.56430.48470.9783
443193425686.906120371.521731002.29040.01060.05510.47470.5857
452582624845.288819519.794530170.78320.35910.00450.46270.4627
462683523708.841617123.349430294.33380.17610.26430.2690.3394
472020518867.355312178.341525556.36910.34750.00980.32480.0339
481778917801.035310143.217925458.85260.49880.26920.41020.0309
492052017982.351910163.747125800.95660.26230.51930.27020.0372
502251820230.385412402.695428058.07540.28340.47110.12750.1114
511557216453.29618650.048924256.54340.41240.06380.19930.0149
52115098585.0524802.147216367.95760.23080.03920.14780
532544730581.574422803.907238359.24150.097810.4020.9164
542409026168.24518359.341333977.14880.3010.57180.16120.6057
552778630293.252122433.908738152.59560.26590.93910.52730.9024
56261952543617535.630533336.36940.42530.27990.05350.5332
572051624596.759216674.803332518.71520.15630.34630.38050.4505
582275923460.708614487.699532433.71770.43910.740.23050.3601
591902818618.27349521.199527715.34730.46480.18620.36620.0813
601697117550.76877588.357727513.17980.45460.38570.48130.0687
612003617731.42677596.064927866.78850.32790.55850.29490.0771

\begin{tabular}{lllllllll}
\hline
Univariate ARIMA Extrapolation Forecast \tabularnewline
time & Y[t] & F[t] & 95% LB & 95% UB & p-value(H0: Y[t] = F[t]) & P(F[t]>Y[t-1]) & P(F[t]>Y[t-s]) & P(F[t]>Y[33]) \tabularnewline
21 & 26736 & - & - & - & - & - & - & - \tabularnewline
22 & 23691 & - & - & - & - & - & - & - \tabularnewline
23 & 18157 & - & - & - & - & - & - & - \tabularnewline
24 & 17328 & - & - & - & - & - & - & - \tabularnewline
25 & 18205 & - & - & - & - & - & - & - \tabularnewline
26 & 20995 & - & - & - & - & - & - & - \tabularnewline
27 & 17382 & - & - & - & - & - & - & - \tabularnewline
28 & 9367 & - & - & - & - & - & - & - \tabularnewline
29 & 31124 & - & - & - & - & - & - & - \tabularnewline
30 & 26551 & - & - & - & - & - & - & - \tabularnewline
31 & 30651 & - & - & - & - & - & - & - \tabularnewline
32 & 25859 & - & - & - & - & - & - & - \tabularnewline
33 & 25100 & - & - & - & - & - & - & - \tabularnewline
34 & 25778 & 24007.9806 & 20415.6842 & 27600.277 & 0.1671 & 0.2756 & 0.5687 & 0.2756 \tabularnewline
35 & 20418 & 19164.4964 & 15459.428 & 22869.5649 & 0.2536 & 2e-04 & 0.703 & 8e-04 \tabularnewline
36 & 18688 & 18070.9166 & 13008.4422 & 23133.391 & 0.4056 & 0.1818 & 0.6132 & 0.0033 \tabularnewline
37 & 20424 & 18225.8107 & 13003.4994 & 23448.122 & 0.2047 & 0.4311 & 0.5031 & 0.0049 \tabularnewline
38 & 24776 & 20462.6138 & 15242.8307 & 25682.3969 & 0.0527 & 0.5058 & 0.4208 & 0.0408 \tabularnewline
39 & 19814 & 16689.1789 & 11456.9986 & 21921.3592 & 0.1209 & 0.0012 & 0.3976 & 8e-04 \tabularnewline
40 & 12738 & 8831.0083 & 3593.6282 & 14068.3885 & 0.0719 & 0 & 0.4205 & 0 \tabularnewline
41 & 31566 & 30835.6387 & 25603.4135 & 36067.8639 & 0.3922 & 1 & 0.457 & 0.9842 \tabularnewline
42 & 30111 & 26424.7853 & 21173.6553 & 31675.9153 & 0.0844 & 0.0275 & 0.4812 & 0.6895 \tabularnewline
43 & 30019 & 30547.69 & 25259.7713 & 35835.6087 & 0.4223 & 0.5643 & 0.4847 & 0.9783 \tabularnewline
44 & 31934 & 25686.9061 & 20371.5217 & 31002.2904 & 0.0106 & 0.0551 & 0.4747 & 0.5857 \tabularnewline
45 & 25826 & 24845.2888 & 19519.7945 & 30170.7832 & 0.3591 & 0.0045 & 0.4627 & 0.4627 \tabularnewline
46 & 26835 & 23708.8416 & 17123.3494 & 30294.3338 & 0.1761 & 0.2643 & 0.269 & 0.3394 \tabularnewline
47 & 20205 & 18867.3553 & 12178.3415 & 25556.3691 & 0.3475 & 0.0098 & 0.3248 & 0.0339 \tabularnewline
48 & 17789 & 17801.0353 & 10143.2179 & 25458.8526 & 0.4988 & 0.2692 & 0.4102 & 0.0309 \tabularnewline
49 & 20520 & 17982.3519 & 10163.7471 & 25800.9566 & 0.2623 & 0.5193 & 0.2702 & 0.0372 \tabularnewline
50 & 22518 & 20230.3854 & 12402.6954 & 28058.0754 & 0.2834 & 0.4711 & 0.1275 & 0.1114 \tabularnewline
51 & 15572 & 16453.2961 & 8650.0489 & 24256.5434 & 0.4124 & 0.0638 & 0.1993 & 0.0149 \tabularnewline
52 & 11509 & 8585.0524 & 802.1472 & 16367.9576 & 0.2308 & 0.0392 & 0.1478 & 0 \tabularnewline
53 & 25447 & 30581.5744 & 22803.9072 & 38359.2415 & 0.0978 & 1 & 0.402 & 0.9164 \tabularnewline
54 & 24090 & 26168.245 & 18359.3413 & 33977.1488 & 0.301 & 0.5718 & 0.1612 & 0.6057 \tabularnewline
55 & 27786 & 30293.2521 & 22433.9087 & 38152.5956 & 0.2659 & 0.9391 & 0.5273 & 0.9024 \tabularnewline
56 & 26195 & 25436 & 17535.6305 & 33336.3694 & 0.4253 & 0.2799 & 0.0535 & 0.5332 \tabularnewline
57 & 20516 & 24596.7592 & 16674.8033 & 32518.7152 & 0.1563 & 0.3463 & 0.3805 & 0.4505 \tabularnewline
58 & 22759 & 23460.7086 & 14487.6995 & 32433.7177 & 0.4391 & 0.74 & 0.2305 & 0.3601 \tabularnewline
59 & 19028 & 18618.2734 & 9521.1995 & 27715.3473 & 0.4648 & 0.1862 & 0.3662 & 0.0813 \tabularnewline
60 & 16971 & 17550.7687 & 7588.3577 & 27513.1798 & 0.4546 & 0.3857 & 0.4813 & 0.0687 \tabularnewline
61 & 20036 & 17731.4267 & 7596.0649 & 27866.7885 & 0.3279 & 0.5585 & 0.2949 & 0.0771 \tabularnewline
\hline
\end{tabular}
%Source: https://freestatistics.org/blog/index.php?pk=66350&T=1

[TABLE]
[ROW][C]Univariate ARIMA Extrapolation Forecast[/C][/ROW]
[ROW][C]time[/C][C]Y[t][/C][C]F[t][/C][C]95% LB[/C][C]95% UB[/C][C]p-value(H0: Y[t] = F[t])[/C][C]P(F[t]>Y[t-1])[/C][C]P(F[t]>Y[t-s])[/C][C]P(F[t]>Y[33])[/C][/ROW]
[ROW][C]21[/C][C]26736[/C][C]-[/C][C]-[/C][C]-[/C][C]-[/C][C]-[/C][C]-[/C][C]-[/C][/ROW]
[ROW][C]22[/C][C]23691[/C][C]-[/C][C]-[/C][C]-[/C][C]-[/C][C]-[/C][C]-[/C][C]-[/C][/ROW]
[ROW][C]23[/C][C]18157[/C][C]-[/C][C]-[/C][C]-[/C][C]-[/C][C]-[/C][C]-[/C][C]-[/C][/ROW]
[ROW][C]24[/C][C]17328[/C][C]-[/C][C]-[/C][C]-[/C][C]-[/C][C]-[/C][C]-[/C][C]-[/C][/ROW]
[ROW][C]25[/C][C]18205[/C][C]-[/C][C]-[/C][C]-[/C][C]-[/C][C]-[/C][C]-[/C][C]-[/C][/ROW]
[ROW][C]26[/C][C]20995[/C][C]-[/C][C]-[/C][C]-[/C][C]-[/C][C]-[/C][C]-[/C][C]-[/C][/ROW]
[ROW][C]27[/C][C]17382[/C][C]-[/C][C]-[/C][C]-[/C][C]-[/C][C]-[/C][C]-[/C][C]-[/C][/ROW]
[ROW][C]28[/C][C]9367[/C][C]-[/C][C]-[/C][C]-[/C][C]-[/C][C]-[/C][C]-[/C][C]-[/C][/ROW]
[ROW][C]29[/C][C]31124[/C][C]-[/C][C]-[/C][C]-[/C][C]-[/C][C]-[/C][C]-[/C][C]-[/C][/ROW]
[ROW][C]30[/C][C]26551[/C][C]-[/C][C]-[/C][C]-[/C][C]-[/C][C]-[/C][C]-[/C][C]-[/C][/ROW]
[ROW][C]31[/C][C]30651[/C][C]-[/C][C]-[/C][C]-[/C][C]-[/C][C]-[/C][C]-[/C][C]-[/C][/ROW]
[ROW][C]32[/C][C]25859[/C][C]-[/C][C]-[/C][C]-[/C][C]-[/C][C]-[/C][C]-[/C][C]-[/C][/ROW]
[ROW][C]33[/C][C]25100[/C][C]-[/C][C]-[/C][C]-[/C][C]-[/C][C]-[/C][C]-[/C][C]-[/C][/ROW]
[ROW][C]34[/C][C]25778[/C][C]24007.9806[/C][C]20415.6842[/C][C]27600.277[/C][C]0.1671[/C][C]0.2756[/C][C]0.5687[/C][C]0.2756[/C][/ROW]
[ROW][C]35[/C][C]20418[/C][C]19164.4964[/C][C]15459.428[/C][C]22869.5649[/C][C]0.2536[/C][C]2e-04[/C][C]0.703[/C][C]8e-04[/C][/ROW]
[ROW][C]36[/C][C]18688[/C][C]18070.9166[/C][C]13008.4422[/C][C]23133.391[/C][C]0.4056[/C][C]0.1818[/C][C]0.6132[/C][C]0.0033[/C][/ROW]
[ROW][C]37[/C][C]20424[/C][C]18225.8107[/C][C]13003.4994[/C][C]23448.122[/C][C]0.2047[/C][C]0.4311[/C][C]0.5031[/C][C]0.0049[/C][/ROW]
[ROW][C]38[/C][C]24776[/C][C]20462.6138[/C][C]15242.8307[/C][C]25682.3969[/C][C]0.0527[/C][C]0.5058[/C][C]0.4208[/C][C]0.0408[/C][/ROW]
[ROW][C]39[/C][C]19814[/C][C]16689.1789[/C][C]11456.9986[/C][C]21921.3592[/C][C]0.1209[/C][C]0.0012[/C][C]0.3976[/C][C]8e-04[/C][/ROW]
[ROW][C]40[/C][C]12738[/C][C]8831.0083[/C][C]3593.6282[/C][C]14068.3885[/C][C]0.0719[/C][C]0[/C][C]0.4205[/C][C]0[/C][/ROW]
[ROW][C]41[/C][C]31566[/C][C]30835.6387[/C][C]25603.4135[/C][C]36067.8639[/C][C]0.3922[/C][C]1[/C][C]0.457[/C][C]0.9842[/C][/ROW]
[ROW][C]42[/C][C]30111[/C][C]26424.7853[/C][C]21173.6553[/C][C]31675.9153[/C][C]0.0844[/C][C]0.0275[/C][C]0.4812[/C][C]0.6895[/C][/ROW]
[ROW][C]43[/C][C]30019[/C][C]30547.69[/C][C]25259.7713[/C][C]35835.6087[/C][C]0.4223[/C][C]0.5643[/C][C]0.4847[/C][C]0.9783[/C][/ROW]
[ROW][C]44[/C][C]31934[/C][C]25686.9061[/C][C]20371.5217[/C][C]31002.2904[/C][C]0.0106[/C][C]0.0551[/C][C]0.4747[/C][C]0.5857[/C][/ROW]
[ROW][C]45[/C][C]25826[/C][C]24845.2888[/C][C]19519.7945[/C][C]30170.7832[/C][C]0.3591[/C][C]0.0045[/C][C]0.4627[/C][C]0.4627[/C][/ROW]
[ROW][C]46[/C][C]26835[/C][C]23708.8416[/C][C]17123.3494[/C][C]30294.3338[/C][C]0.1761[/C][C]0.2643[/C][C]0.269[/C][C]0.3394[/C][/ROW]
[ROW][C]47[/C][C]20205[/C][C]18867.3553[/C][C]12178.3415[/C][C]25556.3691[/C][C]0.3475[/C][C]0.0098[/C][C]0.3248[/C][C]0.0339[/C][/ROW]
[ROW][C]48[/C][C]17789[/C][C]17801.0353[/C][C]10143.2179[/C][C]25458.8526[/C][C]0.4988[/C][C]0.2692[/C][C]0.4102[/C][C]0.0309[/C][/ROW]
[ROW][C]49[/C][C]20520[/C][C]17982.3519[/C][C]10163.7471[/C][C]25800.9566[/C][C]0.2623[/C][C]0.5193[/C][C]0.2702[/C][C]0.0372[/C][/ROW]
[ROW][C]50[/C][C]22518[/C][C]20230.3854[/C][C]12402.6954[/C][C]28058.0754[/C][C]0.2834[/C][C]0.4711[/C][C]0.1275[/C][C]0.1114[/C][/ROW]
[ROW][C]51[/C][C]15572[/C][C]16453.2961[/C][C]8650.0489[/C][C]24256.5434[/C][C]0.4124[/C][C]0.0638[/C][C]0.1993[/C][C]0.0149[/C][/ROW]
[ROW][C]52[/C][C]11509[/C][C]8585.0524[/C][C]802.1472[/C][C]16367.9576[/C][C]0.2308[/C][C]0.0392[/C][C]0.1478[/C][C]0[/C][/ROW]
[ROW][C]53[/C][C]25447[/C][C]30581.5744[/C][C]22803.9072[/C][C]38359.2415[/C][C]0.0978[/C][C]1[/C][C]0.402[/C][C]0.9164[/C][/ROW]
[ROW][C]54[/C][C]24090[/C][C]26168.245[/C][C]18359.3413[/C][C]33977.1488[/C][C]0.301[/C][C]0.5718[/C][C]0.1612[/C][C]0.6057[/C][/ROW]
[ROW][C]55[/C][C]27786[/C][C]30293.2521[/C][C]22433.9087[/C][C]38152.5956[/C][C]0.2659[/C][C]0.9391[/C][C]0.5273[/C][C]0.9024[/C][/ROW]
[ROW][C]56[/C][C]26195[/C][C]25436[/C][C]17535.6305[/C][C]33336.3694[/C][C]0.4253[/C][C]0.2799[/C][C]0.0535[/C][C]0.5332[/C][/ROW]
[ROW][C]57[/C][C]20516[/C][C]24596.7592[/C][C]16674.8033[/C][C]32518.7152[/C][C]0.1563[/C][C]0.3463[/C][C]0.3805[/C][C]0.4505[/C][/ROW]
[ROW][C]58[/C][C]22759[/C][C]23460.7086[/C][C]14487.6995[/C][C]32433.7177[/C][C]0.4391[/C][C]0.74[/C][C]0.2305[/C][C]0.3601[/C][/ROW]
[ROW][C]59[/C][C]19028[/C][C]18618.2734[/C][C]9521.1995[/C][C]27715.3473[/C][C]0.4648[/C][C]0.1862[/C][C]0.3662[/C][C]0.0813[/C][/ROW]
[ROW][C]60[/C][C]16971[/C][C]17550.7687[/C][C]7588.3577[/C][C]27513.1798[/C][C]0.4546[/C][C]0.3857[/C][C]0.4813[/C][C]0.0687[/C][/ROW]
[ROW][C]61[/C][C]20036[/C][C]17731.4267[/C][C]7596.0649[/C][C]27866.7885[/C][C]0.3279[/C][C]0.5585[/C][C]0.2949[/C][C]0.0771[/C][/ROW]
[/TABLE]
Source: https://freestatistics.org/blog/index.php?pk=66350&T=1

Globally Unique Identifier (entire table): ba.freestatistics.org/blog/index.php?pk=66350&T=1

As an alternative you can also use a QR Code:  

The GUIDs for individual cells are displayed in the table below:

Univariate ARIMA Extrapolation Forecast
timeY[t]F[t]95% LB95% UBp-value(H0: Y[t] = F[t])P(F[t]>Y[t-1])P(F[t]>Y[t-s])P(F[t]>Y[33])
2126736-------
2223691-------
2318157-------
2417328-------
2518205-------
2620995-------
2717382-------
289367-------
2931124-------
3026551-------
3130651-------
3225859-------
3325100-------
342577824007.980620415.684227600.2770.16710.27560.56870.2756
352041819164.496415459.42822869.56490.25362e-040.7038e-04
361868818070.916613008.442223133.3910.40560.18180.61320.0033
372042418225.810713003.499423448.1220.20470.43110.50310.0049
382477620462.613815242.830725682.39690.05270.50580.42080.0408
391981416689.178911456.998621921.35920.12090.00120.39768e-04
40127388831.00833593.628214068.38850.071900.42050
413156630835.638725603.413536067.86390.392210.4570.9842
423011126424.785321173.655331675.91530.08440.02750.48120.6895
433001930547.6925259.771335835.60870.42230.56430.48470.9783
443193425686.906120371.521731002.29040.01060.05510.47470.5857
452582624845.288819519.794530170.78320.35910.00450.46270.4627
462683523708.841617123.349430294.33380.17610.26430.2690.3394
472020518867.355312178.341525556.36910.34750.00980.32480.0339
481778917801.035310143.217925458.85260.49880.26920.41020.0309
492052017982.351910163.747125800.95660.26230.51930.27020.0372
502251820230.385412402.695428058.07540.28340.47110.12750.1114
511557216453.29618650.048924256.54340.41240.06380.19930.0149
52115098585.0524802.147216367.95760.23080.03920.14780
532544730581.574422803.907238359.24150.097810.4020.9164
542409026168.24518359.341333977.14880.3010.57180.16120.6057
552778630293.252122433.908738152.59560.26590.93910.52730.9024
56261952543617535.630533336.36940.42530.27990.05350.5332
572051624596.759216674.803332518.71520.15630.34630.38050.4505
582275923460.708614487.699532433.71770.43910.740.23050.3601
591902818618.27349521.199527715.34730.46480.18620.36620.0813
601697117550.76877588.357727513.17980.45460.38570.48130.0687
612003617731.42677596.064927866.78850.32790.55850.29490.0771


Univariate ARIMA Extrapolation Forecast Performance
time% S.E.PEMAPESq.EMSERMSE
340.07630.073703132968.727400
350.09860.06540.06961571271.1522352119.93971533.6623
360.14290.03410.0578380791.91821695010.59921301.9257
370.14620.12060.07354832036.11092479266.97711574.5688
380.13010.21080.100918605300.40215704473.66212388.404
390.160.18720.11539764507.00776381145.88642526.093
400.30260.44240.16215264583.7827650208.44292765.901
410.08660.02370.1448533427.68966760610.84872600.1175
420.10140.13950.144213588178.99467519229.53162742.1214
430.0883-0.01730.1315279513.12066795257.89052606.7715
440.10560.24320.141639026182.76819725341.97033118.5481
450.10940.03950.1331961794.37598995046.33742999.1743
460.14170.13190.1339772866.14359054878.63023009.1325
470.18090.07090.12861789293.27938535908.2482921.6277
480.2195-7e-040.1201144.84767966857.35462822.5622
490.22180.14110.12146439658.02787871407.39672805.6029
500.19740.11310.12095233180.46277716217.57712777.8081
510.242-0.05360.1171776682.8957330687.87252707.5243
520.46250.34060.12898549469.53997394834.2762719.3445
530.1298-0.16790.130926363853.8378343285.25412888.4746
540.1523-0.07940.12844319102.47518151657.50272855.1108
550.1324-0.08280.12636286313.23968066869.12712840.2234
560.15850.02980.1221576081.05027741182.6892782.2981
570.1643-0.16590.12416652595.9578112491.57522848.2436
580.1951-0.02990.1202492394.95497807687.71032794.224
590.24930.0220.1164167875.89937513848.79452741.1401
600.2896-0.0330.1133336131.7917248007.4242692.2124
610.29160.130.11395311058.03947178830.66032679.334

\begin{tabular}{lllllllll}
\hline
Univariate ARIMA Extrapolation Forecast Performance \tabularnewline
time & % S.E. & PE & MAPE & Sq.E & MSE & RMSE \tabularnewline
34 & 0.0763 & 0.0737 & 0 & 3132968.7274 & 0 & 0 \tabularnewline
35 & 0.0986 & 0.0654 & 0.0696 & 1571271.152 & 2352119.9397 & 1533.6623 \tabularnewline
36 & 0.1429 & 0.0341 & 0.0578 & 380791.9182 & 1695010.5992 & 1301.9257 \tabularnewline
37 & 0.1462 & 0.1206 & 0.0735 & 4832036.1109 & 2479266.9771 & 1574.5688 \tabularnewline
38 & 0.1301 & 0.2108 & 0.1009 & 18605300.4021 & 5704473.6621 & 2388.404 \tabularnewline
39 & 0.16 & 0.1872 & 0.1153 & 9764507.0077 & 6381145.8864 & 2526.093 \tabularnewline
40 & 0.3026 & 0.4424 & 0.162 & 15264583.782 & 7650208.4429 & 2765.901 \tabularnewline
41 & 0.0866 & 0.0237 & 0.1448 & 533427.6896 & 6760610.8487 & 2600.1175 \tabularnewline
42 & 0.1014 & 0.1395 & 0.1442 & 13588178.9946 & 7519229.5316 & 2742.1214 \tabularnewline
43 & 0.0883 & -0.0173 & 0.1315 & 279513.1206 & 6795257.8905 & 2606.7715 \tabularnewline
44 & 0.1056 & 0.2432 & 0.1416 & 39026182.7681 & 9725341.9703 & 3118.5481 \tabularnewline
45 & 0.1094 & 0.0395 & 0.1331 & 961794.3759 & 8995046.3374 & 2999.1743 \tabularnewline
46 & 0.1417 & 0.1319 & 0.133 & 9772866.1435 & 9054878.6302 & 3009.1325 \tabularnewline
47 & 0.1809 & 0.0709 & 0.1286 & 1789293.2793 & 8535908.248 & 2921.6277 \tabularnewline
48 & 0.2195 & -7e-04 & 0.1201 & 144.8476 & 7966857.3546 & 2822.5622 \tabularnewline
49 & 0.2218 & 0.1411 & 0.1214 & 6439658.0278 & 7871407.3967 & 2805.6029 \tabularnewline
50 & 0.1974 & 0.1131 & 0.1209 & 5233180.4627 & 7716217.5771 & 2777.8081 \tabularnewline
51 & 0.242 & -0.0536 & 0.1171 & 776682.895 & 7330687.8725 & 2707.5243 \tabularnewline
52 & 0.4625 & 0.3406 & 0.1289 & 8549469.5399 & 7394834.276 & 2719.3445 \tabularnewline
53 & 0.1298 & -0.1679 & 0.1309 & 26363853.837 & 8343285.2541 & 2888.4746 \tabularnewline
54 & 0.1523 & -0.0794 & 0.1284 & 4319102.4751 & 8151657.5027 & 2855.1108 \tabularnewline
55 & 0.1324 & -0.0828 & 0.1263 & 6286313.2396 & 8066869.1271 & 2840.2234 \tabularnewline
56 & 0.1585 & 0.0298 & 0.1221 & 576081.0502 & 7741182.689 & 2782.2981 \tabularnewline
57 & 0.1643 & -0.1659 & 0.124 & 16652595.957 & 8112491.5752 & 2848.2436 \tabularnewline
58 & 0.1951 & -0.0299 & 0.1202 & 492394.9549 & 7807687.7103 & 2794.224 \tabularnewline
59 & 0.2493 & 0.022 & 0.1164 & 167875.8993 & 7513848.7945 & 2741.1401 \tabularnewline
60 & 0.2896 & -0.033 & 0.1133 & 336131.791 & 7248007.424 & 2692.2124 \tabularnewline
61 & 0.2916 & 0.13 & 0.1139 & 5311058.0394 & 7178830.6603 & 2679.334 \tabularnewline
\hline
\end{tabular}
%Source: https://freestatistics.org/blog/index.php?pk=66350&T=2

[TABLE]
[ROW][C]Univariate ARIMA Extrapolation Forecast Performance[/C][/ROW]
[ROW][C]time[/C][C]% S.E.[/C][C]PE[/C][C]MAPE[/C][C]Sq.E[/C][C]MSE[/C][C]RMSE[/C][/ROW]
[ROW][C]34[/C][C]0.0763[/C][C]0.0737[/C][C]0[/C][C]3132968.7274[/C][C]0[/C][C]0[/C][/ROW]
[ROW][C]35[/C][C]0.0986[/C][C]0.0654[/C][C]0.0696[/C][C]1571271.152[/C][C]2352119.9397[/C][C]1533.6623[/C][/ROW]
[ROW][C]36[/C][C]0.1429[/C][C]0.0341[/C][C]0.0578[/C][C]380791.9182[/C][C]1695010.5992[/C][C]1301.9257[/C][/ROW]
[ROW][C]37[/C][C]0.1462[/C][C]0.1206[/C][C]0.0735[/C][C]4832036.1109[/C][C]2479266.9771[/C][C]1574.5688[/C][/ROW]
[ROW][C]38[/C][C]0.1301[/C][C]0.2108[/C][C]0.1009[/C][C]18605300.4021[/C][C]5704473.6621[/C][C]2388.404[/C][/ROW]
[ROW][C]39[/C][C]0.16[/C][C]0.1872[/C][C]0.1153[/C][C]9764507.0077[/C][C]6381145.8864[/C][C]2526.093[/C][/ROW]
[ROW][C]40[/C][C]0.3026[/C][C]0.4424[/C][C]0.162[/C][C]15264583.782[/C][C]7650208.4429[/C][C]2765.901[/C][/ROW]
[ROW][C]41[/C][C]0.0866[/C][C]0.0237[/C][C]0.1448[/C][C]533427.6896[/C][C]6760610.8487[/C][C]2600.1175[/C][/ROW]
[ROW][C]42[/C][C]0.1014[/C][C]0.1395[/C][C]0.1442[/C][C]13588178.9946[/C][C]7519229.5316[/C][C]2742.1214[/C][/ROW]
[ROW][C]43[/C][C]0.0883[/C][C]-0.0173[/C][C]0.1315[/C][C]279513.1206[/C][C]6795257.8905[/C][C]2606.7715[/C][/ROW]
[ROW][C]44[/C][C]0.1056[/C][C]0.2432[/C][C]0.1416[/C][C]39026182.7681[/C][C]9725341.9703[/C][C]3118.5481[/C][/ROW]
[ROW][C]45[/C][C]0.1094[/C][C]0.0395[/C][C]0.1331[/C][C]961794.3759[/C][C]8995046.3374[/C][C]2999.1743[/C][/ROW]
[ROW][C]46[/C][C]0.1417[/C][C]0.1319[/C][C]0.133[/C][C]9772866.1435[/C][C]9054878.6302[/C][C]3009.1325[/C][/ROW]
[ROW][C]47[/C][C]0.1809[/C][C]0.0709[/C][C]0.1286[/C][C]1789293.2793[/C][C]8535908.248[/C][C]2921.6277[/C][/ROW]
[ROW][C]48[/C][C]0.2195[/C][C]-7e-04[/C][C]0.1201[/C][C]144.8476[/C][C]7966857.3546[/C][C]2822.5622[/C][/ROW]
[ROW][C]49[/C][C]0.2218[/C][C]0.1411[/C][C]0.1214[/C][C]6439658.0278[/C][C]7871407.3967[/C][C]2805.6029[/C][/ROW]
[ROW][C]50[/C][C]0.1974[/C][C]0.1131[/C][C]0.1209[/C][C]5233180.4627[/C][C]7716217.5771[/C][C]2777.8081[/C][/ROW]
[ROW][C]51[/C][C]0.242[/C][C]-0.0536[/C][C]0.1171[/C][C]776682.895[/C][C]7330687.8725[/C][C]2707.5243[/C][/ROW]
[ROW][C]52[/C][C]0.4625[/C][C]0.3406[/C][C]0.1289[/C][C]8549469.5399[/C][C]7394834.276[/C][C]2719.3445[/C][/ROW]
[ROW][C]53[/C][C]0.1298[/C][C]-0.1679[/C][C]0.1309[/C][C]26363853.837[/C][C]8343285.2541[/C][C]2888.4746[/C][/ROW]
[ROW][C]54[/C][C]0.1523[/C][C]-0.0794[/C][C]0.1284[/C][C]4319102.4751[/C][C]8151657.5027[/C][C]2855.1108[/C][/ROW]
[ROW][C]55[/C][C]0.1324[/C][C]-0.0828[/C][C]0.1263[/C][C]6286313.2396[/C][C]8066869.1271[/C][C]2840.2234[/C][/ROW]
[ROW][C]56[/C][C]0.1585[/C][C]0.0298[/C][C]0.1221[/C][C]576081.0502[/C][C]7741182.689[/C][C]2782.2981[/C][/ROW]
[ROW][C]57[/C][C]0.1643[/C][C]-0.1659[/C][C]0.124[/C][C]16652595.957[/C][C]8112491.5752[/C][C]2848.2436[/C][/ROW]
[ROW][C]58[/C][C]0.1951[/C][C]-0.0299[/C][C]0.1202[/C][C]492394.9549[/C][C]7807687.7103[/C][C]2794.224[/C][/ROW]
[ROW][C]59[/C][C]0.2493[/C][C]0.022[/C][C]0.1164[/C][C]167875.8993[/C][C]7513848.7945[/C][C]2741.1401[/C][/ROW]
[ROW][C]60[/C][C]0.2896[/C][C]-0.033[/C][C]0.1133[/C][C]336131.791[/C][C]7248007.424[/C][C]2692.2124[/C][/ROW]
[ROW][C]61[/C][C]0.2916[/C][C]0.13[/C][C]0.1139[/C][C]5311058.0394[/C][C]7178830.6603[/C][C]2679.334[/C][/ROW]
[/TABLE]
Source: https://freestatistics.org/blog/index.php?pk=66350&T=2

Globally Unique Identifier (entire table): ba.freestatistics.org/blog/index.php?pk=66350&T=2

As an alternative you can also use a QR Code:  

The GUIDs for individual cells are displayed in the table below:

Univariate ARIMA Extrapolation Forecast Performance
time% S.E.PEMAPESq.EMSERMSE
340.07630.073703132968.727400
350.09860.06540.06961571271.1522352119.93971533.6623
360.14290.03410.0578380791.91821695010.59921301.9257
370.14620.12060.07354832036.11092479266.97711574.5688
380.13010.21080.100918605300.40215704473.66212388.404
390.160.18720.11539764507.00776381145.88642526.093
400.30260.44240.16215264583.7827650208.44292765.901
410.08660.02370.1448533427.68966760610.84872600.1175
420.10140.13950.144213588178.99467519229.53162742.1214
430.0883-0.01730.1315279513.12066795257.89052606.7715
440.10560.24320.141639026182.76819725341.97033118.5481
450.10940.03950.1331961794.37598995046.33742999.1743
460.14170.13190.1339772866.14359054878.63023009.1325
470.18090.07090.12861789293.27938535908.2482921.6277
480.2195-7e-040.1201144.84767966857.35462822.5622
490.22180.14110.12146439658.02787871407.39672805.6029
500.19740.11310.12095233180.46277716217.57712777.8081
510.242-0.05360.1171776682.8957330687.87252707.5243
520.46250.34060.12898549469.53997394834.2762719.3445
530.1298-0.16790.130926363853.8378343285.25412888.4746
540.1523-0.07940.12844319102.47518151657.50272855.1108
550.1324-0.08280.12636286313.23968066869.12712840.2234
560.15850.02980.1221576081.05027741182.6892782.2981
570.1643-0.16590.12416652595.9578112491.57522848.2436
580.1951-0.02990.1202492394.95497807687.71032794.224
590.24930.0220.1164167875.89937513848.79452741.1401
600.2896-0.0330.1133336131.7917248007.4242692.2124
610.29160.130.11395311058.03947178830.66032679.334


Parameters (Session):
par1 = 24 ; par2 = 1 ; par3 = 1 ; par4 = 1 ; par5 = 12 ; par6 = 1 ; par7 = 0 ; par8 = 0 ; par9 = 0 ; par10 = FALSE ;
Parameters (R input):
par1 = 24 ; par2 = 1 ; par3 = 1 ; par4 = 1 ; par5 = 12 ; par6 = 1 ; par7 = 0 ; par8 = 0 ; par9 = 0 ; par10 = FALSE ;
R code (references can be found in the software module):
par1 <- as.numeric(par1) #cut off periods
par1 <- 28
par2 <- as.numeric(par2) #lambda
par3 <- as.numeric(par3) #degree of non-seasonal differencing
par4 <- as.numeric(par4) #degree of seasonal differencing
par5 <- as.numeric(par5) #seasonal period
par6 <- as.numeric(par6) #p
par6 <- 3
par7 <- as.numeric(par7) #q
par7 <- 3
par8 <- as.numeric(par8) #P
par9 <- as.numeric(par9) #Q
if (par10 == 'TRUE') par10 <- TRUE
if (par10 == 'FALSE') par10 <- FALSE
if (par2 == 0) x <- log(x)
if (par2 != 0) x <- x^par2
lx <- length(x)
first <- lx - 2*par1
nx <- lx - par1
nx1 <- nx + 1
fx <- lx - nx
if (fx < 1) {
fx <- par5
nx1 <- lx + fx - 1
first <- lx - 2*fx
}
first <- 1
if (fx < 3) fx <- round(lx/10,0)
(arima.out <- arima(x[1:nx], order=c(par6,par3,par7), seasonal=list(order=c(par8,par4,par9), period=par5), include.mean=par10, method='ML'))
(forecast <- predict(arima.out,par1))
(lb <- forecast$pred - 1.96 * forecast$se)
(ub <- forecast$pred + 1.96 * forecast$se)
if (par2 == 0) {
x <- exp(x)
forecast$pred <- exp(forecast$pred)
lb <- exp(lb)
ub <- exp(ub)
}
if (par2 != 0) {
x <- x^(1/par2)
forecast$pred <- forecast$pred^(1/par2)
lb <- lb^(1/par2)
ub <- ub^(1/par2)
}
if (par2 < 0) {
olb <- lb
lb <- ub
ub <- olb
}
(actandfor <- c(x[1:nx], forecast$pred))
(perc.se <- (ub-forecast$pred)/1.96/forecast$pred)
bitmap(file='test1.png')
opar <- par(mar=c(4,4,2,2),las=1)
ylim <- c( min(x[first:nx],lb), max(x[first:nx],ub))
plot(x,ylim=ylim,type='n',xlim=c(first,lx))
usr <- par('usr')
rect(usr[1],usr[3],nx+1,usr[4],border=NA,col='lemonchiffon')
rect(nx1,usr[3],usr[2],usr[4],border=NA,col='lavender')
abline(h= (-3:3)*2 , col ='gray', lty =3)
polygon( c(nx1:lx,lx:nx1), c(lb,rev(ub)), col = 'orange', lty=2,border=NA)
lines(nx1:lx, lb , lty=2)
lines(nx1:lx, ub , lty=2)
lines(x, lwd=2)
lines(nx1:lx, forecast$pred , lwd=2 , col ='white')
box()
par(opar)
dev.off()
prob.dec <- array(NA, dim=fx)
prob.sdec <- array(NA, dim=fx)
prob.ldec <- array(NA, dim=fx)
prob.pval <- array(NA, dim=fx)
perf.pe <- array(0, dim=fx)
perf.mape <- array(0, dim=fx)
perf.mape1 <- array(0, dim=fx)
perf.se <- array(0, dim=fx)
perf.mse <- array(0, dim=fx)
perf.mse1 <- array(0, dim=fx)
perf.rmse <- array(0, dim=fx)
for (i in 1:fx) {
locSD <- (ub[i] - forecast$pred[i]) / 1.96
perf.pe[i] = (x[nx+i] - forecast$pred[i]) / forecast$pred[i]
perf.se[i] = (x[nx+i] - forecast$pred[i])^2
prob.dec[i] = pnorm((x[nx+i-1] - forecast$pred[i]) / locSD)
prob.sdec[i] = pnorm((x[nx+i-par5] - forecast$pred[i]) / locSD)
prob.ldec[i] = pnorm((x[nx] - forecast$pred[i]) / locSD)
prob.pval[i] = pnorm(abs(x[nx+i] - forecast$pred[i]) / locSD)
}
perf.mape[1] = abs(perf.pe[1])
perf.mse[1] = abs(perf.se[1])
for (i in 2:fx) {
perf.mape[i] = perf.mape[i-1] + abs(perf.pe[i])
perf.mape1[i] = perf.mape[i] / i
perf.mse[i] = perf.mse[i-1] + perf.se[i]
perf.mse1[i] = perf.mse[i] / i
}
perf.rmse = sqrt(perf.mse1)
bitmap(file='test2.png')
plot(forecast$pred, pch=19, type='b',main='ARIMA Extrapolation Forecast', ylab='Forecast and 95% CI', xlab='time',ylim=c(min(lb),max(ub)))
dum <- forecast$pred
dum[1:par1] <- x[(nx+1):lx]
lines(dum, lty=1)
lines(ub,lty=3)
lines(lb,lty=3)
dev.off()
load(file='createtable')
a<-table.start()
a<-table.row.start(a)
a<-table.element(a,'Univariate ARIMA Extrapolation Forecast',9,TRUE)
a<-table.row.end(a)
a<-table.row.start(a)
a<-table.element(a,'time',1,header=TRUE)
a<-table.element(a,'Y[t]',1,header=TRUE)
a<-table.element(a,'F[t]',1,header=TRUE)
a<-table.element(a,'95% LB',1,header=TRUE)
a<-table.element(a,'95% UB',1,header=TRUE)
a<-table.element(a,'p-value
(H0: Y[t] = F[t])',1,header=TRUE)
a<-table.element(a,'P(F[t]>Y[t-1])',1,header=TRUE)
a<-table.element(a,'P(F[t]>Y[t-s])',1,header=TRUE)
mylab <- paste('P(F[t]>Y[',nx,sep='')
mylab <- paste(mylab,'])',sep='')
a<-table.element(a,mylab,1,header=TRUE)
a<-table.row.end(a)
for (i in (nx-par5):nx) {
a<-table.row.start(a)
a<-table.element(a,i,header=TRUE)
a<-table.element(a,x[i])
a<-table.element(a,'-')
a<-table.row.end(a)
}
for (i in 1:fx) {
a<-table.row.start(a)
a<-table.element(a,nx+i,header=TRUE)
a<-table.element(a,round(x[nx+i],4))
a<-table.element(a,round(forecast$pred[i],4))
a<-table.element(a,round(lb[i],4))
a<-table.element(a,round(ub[i],4))
a<-table.element(a,round((1-prob.pval[i]),4))
a<-table.element(a,round((1-prob.dec[i]),4))
a<-table.element(a,round((1-prob.sdec[i]),4))
a<-table.element(a,round((1-prob.ldec[i]),4))
a<-table.row.end(a)
}
a<-table.end(a)
table.save(a,file='mytable.tab')
a<-table.start()
a<-table.row.start(a)
a<-table.element(a,'Univariate ARIMA Extrapolation Forecast Performance',7,TRUE)
a<-table.row.end(a)
a<-table.row.start(a)
a<-table.element(a,'time',1,header=TRUE)
a<-table.element(a,'% S.E.',1,header=TRUE)
a<-table.element(a,'PE',1,header=TRUE)
a<-table.element(a,'MAPE',1,header=TRUE)
a<-table.element(a,'Sq.E',1,header=TRUE)
a<-table.element(a,'MSE',1,header=TRUE)
a<-table.element(a,'RMSE',1,header=TRUE)
a<-table.row.end(a)
for (i in 1:fx) {
a<-table.row.start(a)
a<-table.element(a,nx+i,header=TRUE)
a<-table.element(a,round(perc.se[i],4))
a<-table.element(a,round(perf.pe[i],4))
a<-table.element(a,round(perf.mape1[i],4))
a<-table.element(a,round(perf.se[i],4))
a<-table.element(a,round(perf.mse1[i],4))
a<-table.element(a,round(perf.rmse[i],4))
a<-table.row.end(a)
}
a<-table.end(a)
table.save(a,file='mytable1.tab')