Free Statistics

of Irreproducible Research!

Author's title

Author*The author of this computation has been verified*
R Software Modulerwasp_arimaforecasting.wasp
Title produced by softwareARIMA Forecasting
Date of computationFri, 11 Dec 2009 08:05:23 -0700
Cite this page as followsStatistical Computations at FreeStatistics.org, Office for Research Development and Education, URL https://freestatistics.org/blog/index.php?v=date/2009/Dec/11/t12605442469my1ueydcd9fh18.htm/, Retrieved Sun, 28 Apr 2024 22:39:04 +0000
Statistical Computations at FreeStatistics.org, Office for Research Development and Education, URL https://freestatistics.org/blog/index.php?pk=66317, Retrieved Sun, 28 Apr 2024 22:39:04 +0000
QR Codes:

Original text written by user:
IsPrivate?No (this computation is public)
User-defined keywords
Estimated Impact143
Family? (F = Feedback message, R = changed R code, M = changed R Module, P = changed Parameters, D = changed Data)
-     [ARIMA Forecasting] [] [2009-12-07 09:54:52] [b98453cac15ba1066b407e146608df68]
F   PD    [ARIMA Forecasting] [WS 10 f] [2009-12-11 15:05:23] [dd4f17965cad1d38de7a1c062d32d75d] [Current]
-   P       [ARIMA Forecasting] [Verbetering works...] [2009-12-16 18:09:19] [7c2a5b25a196bd646844b8f5223c9b3e]
-             [ARIMA Forecasting] [Verbetering Works...] [2009-12-16 18:21:40] [7c2a5b25a196bd646844b8f5223c9b3e]
Feedback Forum
2009-12-16 18:19:51 [Marie-Lien De Graeve] [reply
Hier geef ik volgende linken weer waar jij fouten hebt gemaakt:

Arima backward selection
http://www.freestatistics.org/blog/index.php?v=date/2009/Dec/16/t1260987071hvq3jh3xiasylz2.htm/

Arima forecasting
http://www.freestatistics.org/blog/index.php?v=date/2009/Dec/16/t1260987228pwjaqh56fbq4dox.htm/

Granger met stationaire tijdreeks
http://www.freestatistics.org/blog/index.php?v=date/2009/Dec/16/t1260984879fyknxu68loqw2p0.htm/

Beste oplossing van granger ingevuld in de arima backward selection
http://www.freestatistics.org/blog/index.php?v=date/2009/Dec/16/t1260985977tdeakqatoxk1s8r.htm/
  2009-12-16 18:27:17 [Marie-Lien De Graeve] [reply
Ik heb voor uw arima forecasting de verkeerde link weergegeven dit is de juiste.
http://www.freestatistics.org/blog/index.php?v=date/2009/Dec/16/t1260987878b8jt7vpl8mhmqfc.htm/

Je had een parameter verkeerd ingesteld, namelijk uw SMA-proces had je niet ingevuld. Deze waarde bedraagt Q=1

Post a new message
Dataseries X:
8.2
8
7.5
6.8
6.5
6.6
7.6
8
8.1
7.7
7.5
7.6
7.8
7.8
7.8
7.5
7.5
7.1
7.5
7.5
7.6
7.7
7.7
7.9
8.1
8.2
8.2
8.2
7.9
7.3
6.9
6.6
6.7
6.9
7
7.1
7.2
7.1
6.9
7
6.8
6.4
6.7
6.6
6.4
6.3
6.2
6.5
6.8
6.8
6.4
6.1
5.8
6.1
7.2
7.3
6.9
6.1
5.8
6.2
7.1
7.7
7.9
7.7
7.4
7.5
8
8.1


Summary of computational transaction
Raw Inputview raw input (R code)
Raw Outputview raw output of R engine
Computing time1 seconds
R Server'Gwilym Jenkins' @ 72.249.127.135

\begin{tabular}{lllllllll}
\hline
Summary of computational transaction \tabularnewline
Raw Input & view raw input (R code)  \tabularnewline
Raw Output & view raw output of R engine  \tabularnewline
Computing time & 1 seconds \tabularnewline
R Server & 'Gwilym Jenkins' @ 72.249.127.135 \tabularnewline
\hline
\end{tabular}
%Source: https://freestatistics.org/blog/index.php?pk=66317&T=0

[TABLE]
[ROW][C]Summary of computational transaction[/C][/ROW]
[ROW][C]Raw Input[/C][C]view raw input (R code) [/C][/ROW]
[ROW][C]Raw Output[/C][C]view raw output of R engine [/C][/ROW]
[ROW][C]Computing time[/C][C]1 seconds[/C][/ROW]
[ROW][C]R Server[/C][C]'Gwilym Jenkins' @ 72.249.127.135[/C][/ROW]
[/TABLE]
Source: https://freestatistics.org/blog/index.php?pk=66317&T=0

Globally Unique Identifier (entire table): ba.freestatistics.org/blog/index.php?pk=66317&T=0

As an alternative you can also use a QR Code:  

The GUIDs for individual cells are displayed in the table below:

Summary of computational transaction
Raw Inputview raw input (R code)
Raw Outputview raw output of R engine
Computing time1 seconds
R Server'Gwilym Jenkins' @ 72.249.127.135


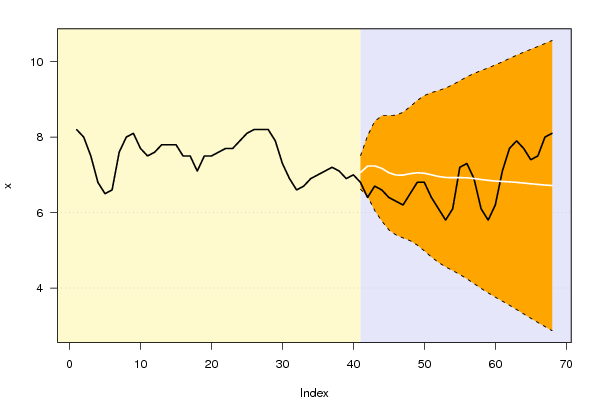
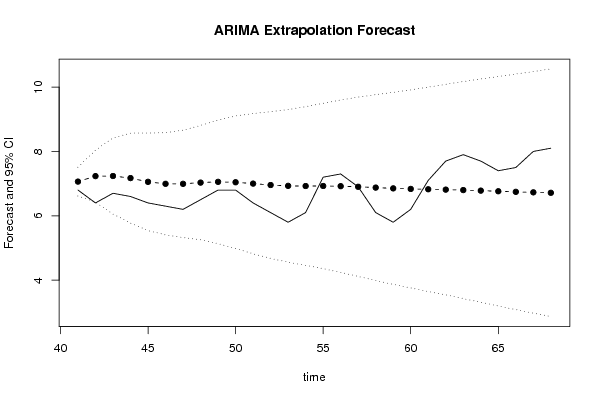
Univariate ARIMA Extrapolation Forecast
timeY[t]F[t]95% LB95% UBp-value(H0: Y[t] = F[t])P(F[t]>Y[t-1])P(F[t]>Y[t-s])P(F[t]>Y[40])
288.2-------
297.9-------
307.3-------
316.9-------
326.6-------
336.7-------
346.9-------
357-------
367.1-------
377.2-------
387.1-------
396.9-------
407-------
416.87.06286.61657.5090.12420.60861e-040.6086
426.47.23286.4278.03850.02140.85380.43510.7144
436.77.23646.05488.41810.18680.91730.71160.6525
446.67.17175.7758.56840.21120.7460.78880.5952
456.47.05485.53898.57060.19860.72170.67680.5282
466.36.99435.40698.58170.19560.76850.54640.4972
476.26.99315.32678.65950.17550.79250.49680.4968
486.57.03145.25438.80840.27890.82040.46980.5138
496.87.0555.13698.9730.39720.71470.44110.5224
506.87.04254.98299.1020.40880.59120.47820.5161
516.47.00014.81999.18040.29480.57140.53590.5
526.16.9564.67659.23550.23090.68370.48490.4849
535.86.93014.569.30030.1750.75380.54290.477
546.16.92474.45999.38950.2560.81440.66170.4761
557.26.92624.35739.4950.41730.73580.56850.4775
567.36.92044.24189.59890.39060.41890.59270.4768
576.96.9024.11559.68850.49940.38980.6380.4725
586.16.87643.98849.76440.29910.49360.65220.4666
595.86.85243.86849.83640.24470.68940.66590.4614
606.26.83533.75719.91360.34290.74510.58450.4582
617.16.82393.64989.99810.43230.650.50590.4567
627.76.81343.540910.08580.29770.43190.50320.4555
637.96.79963.42810.17120.26120.30030.59180.4536
647.76.78193.312410.25140.3020.26380.650.451
657.46.76273.197310.3280.3630.30320.70170.4481
667.56.74463.085110.40410.34290.36280.6350.4456
6786.72892.975510.48230.25340.34360.40280.4437
688.16.71472.86710.56240.24020.25630.38280.4422

\begin{tabular}{lllllllll}
\hline
Univariate ARIMA Extrapolation Forecast \tabularnewline
time & Y[t] & F[t] & 95% LB & 95% UB & p-value(H0: Y[t] = F[t]) & P(F[t]>Y[t-1]) & P(F[t]>Y[t-s]) & P(F[t]>Y[40]) \tabularnewline
28 & 8.2 & - & - & - & - & - & - & - \tabularnewline
29 & 7.9 & - & - & - & - & - & - & - \tabularnewline
30 & 7.3 & - & - & - & - & - & - & - \tabularnewline
31 & 6.9 & - & - & - & - & - & - & - \tabularnewline
32 & 6.6 & - & - & - & - & - & - & - \tabularnewline
33 & 6.7 & - & - & - & - & - & - & - \tabularnewline
34 & 6.9 & - & - & - & - & - & - & - \tabularnewline
35 & 7 & - & - & - & - & - & - & - \tabularnewline
36 & 7.1 & - & - & - & - & - & - & - \tabularnewline
37 & 7.2 & - & - & - & - & - & - & - \tabularnewline
38 & 7.1 & - & - & - & - & - & - & - \tabularnewline
39 & 6.9 & - & - & - & - & - & - & - \tabularnewline
40 & 7 & - & - & - & - & - & - & - \tabularnewline
41 & 6.8 & 7.0628 & 6.6165 & 7.509 & 0.1242 & 0.6086 & 1e-04 & 0.6086 \tabularnewline
42 & 6.4 & 7.2328 & 6.427 & 8.0385 & 0.0214 & 0.8538 & 0.4351 & 0.7144 \tabularnewline
43 & 6.7 & 7.2364 & 6.0548 & 8.4181 & 0.1868 & 0.9173 & 0.7116 & 0.6525 \tabularnewline
44 & 6.6 & 7.1717 & 5.775 & 8.5684 & 0.2112 & 0.746 & 0.7888 & 0.5952 \tabularnewline
45 & 6.4 & 7.0548 & 5.5389 & 8.5706 & 0.1986 & 0.7217 & 0.6768 & 0.5282 \tabularnewline
46 & 6.3 & 6.9943 & 5.4069 & 8.5817 & 0.1956 & 0.7685 & 0.5464 & 0.4972 \tabularnewline
47 & 6.2 & 6.9931 & 5.3267 & 8.6595 & 0.1755 & 0.7925 & 0.4968 & 0.4968 \tabularnewline
48 & 6.5 & 7.0314 & 5.2543 & 8.8084 & 0.2789 & 0.8204 & 0.4698 & 0.5138 \tabularnewline
49 & 6.8 & 7.055 & 5.1369 & 8.973 & 0.3972 & 0.7147 & 0.4411 & 0.5224 \tabularnewline
50 & 6.8 & 7.0425 & 4.9829 & 9.102 & 0.4088 & 0.5912 & 0.4782 & 0.5161 \tabularnewline
51 & 6.4 & 7.0001 & 4.8199 & 9.1804 & 0.2948 & 0.5714 & 0.5359 & 0.5 \tabularnewline
52 & 6.1 & 6.956 & 4.6765 & 9.2355 & 0.2309 & 0.6837 & 0.4849 & 0.4849 \tabularnewline
53 & 5.8 & 6.9301 & 4.56 & 9.3003 & 0.175 & 0.7538 & 0.5429 & 0.477 \tabularnewline
54 & 6.1 & 6.9247 & 4.4599 & 9.3895 & 0.256 & 0.8144 & 0.6617 & 0.4761 \tabularnewline
55 & 7.2 & 6.9262 & 4.3573 & 9.495 & 0.4173 & 0.7358 & 0.5685 & 0.4775 \tabularnewline
56 & 7.3 & 6.9204 & 4.2418 & 9.5989 & 0.3906 & 0.4189 & 0.5927 & 0.4768 \tabularnewline
57 & 6.9 & 6.902 & 4.1155 & 9.6885 & 0.4994 & 0.3898 & 0.638 & 0.4725 \tabularnewline
58 & 6.1 & 6.8764 & 3.9884 & 9.7644 & 0.2991 & 0.4936 & 0.6522 & 0.4666 \tabularnewline
59 & 5.8 & 6.8524 & 3.8684 & 9.8364 & 0.2447 & 0.6894 & 0.6659 & 0.4614 \tabularnewline
60 & 6.2 & 6.8353 & 3.7571 & 9.9136 & 0.3429 & 0.7451 & 0.5845 & 0.4582 \tabularnewline
61 & 7.1 & 6.8239 & 3.6498 & 9.9981 & 0.4323 & 0.65 & 0.5059 & 0.4567 \tabularnewline
62 & 7.7 & 6.8134 & 3.5409 & 10.0858 & 0.2977 & 0.4319 & 0.5032 & 0.4555 \tabularnewline
63 & 7.9 & 6.7996 & 3.428 & 10.1712 & 0.2612 & 0.3003 & 0.5918 & 0.4536 \tabularnewline
64 & 7.7 & 6.7819 & 3.3124 & 10.2514 & 0.302 & 0.2638 & 0.65 & 0.451 \tabularnewline
65 & 7.4 & 6.7627 & 3.1973 & 10.328 & 0.363 & 0.3032 & 0.7017 & 0.4481 \tabularnewline
66 & 7.5 & 6.7446 & 3.0851 & 10.4041 & 0.3429 & 0.3628 & 0.635 & 0.4456 \tabularnewline
67 & 8 & 6.7289 & 2.9755 & 10.4823 & 0.2534 & 0.3436 & 0.4028 & 0.4437 \tabularnewline
68 & 8.1 & 6.7147 & 2.867 & 10.5624 & 0.2402 & 0.2563 & 0.3828 & 0.4422 \tabularnewline
\hline
\end{tabular}
%Source: https://freestatistics.org/blog/index.php?pk=66317&T=1

[TABLE]
[ROW][C]Univariate ARIMA Extrapolation Forecast[/C][/ROW]
[ROW][C]time[/C][C]Y[t][/C][C]F[t][/C][C]95% LB[/C][C]95% UB[/C][C]p-value(H0: Y[t] = F[t])[/C][C]P(F[t]>Y[t-1])[/C][C]P(F[t]>Y[t-s])[/C][C]P(F[t]>Y[40])[/C][/ROW]
[ROW][C]28[/C][C]8.2[/C][C]-[/C][C]-[/C][C]-[/C][C]-[/C][C]-[/C][C]-[/C][C]-[/C][/ROW]
[ROW][C]29[/C][C]7.9[/C][C]-[/C][C]-[/C][C]-[/C][C]-[/C][C]-[/C][C]-[/C][C]-[/C][/ROW]
[ROW][C]30[/C][C]7.3[/C][C]-[/C][C]-[/C][C]-[/C][C]-[/C][C]-[/C][C]-[/C][C]-[/C][/ROW]
[ROW][C]31[/C][C]6.9[/C][C]-[/C][C]-[/C][C]-[/C][C]-[/C][C]-[/C][C]-[/C][C]-[/C][/ROW]
[ROW][C]32[/C][C]6.6[/C][C]-[/C][C]-[/C][C]-[/C][C]-[/C][C]-[/C][C]-[/C][C]-[/C][/ROW]
[ROW][C]33[/C][C]6.7[/C][C]-[/C][C]-[/C][C]-[/C][C]-[/C][C]-[/C][C]-[/C][C]-[/C][/ROW]
[ROW][C]34[/C][C]6.9[/C][C]-[/C][C]-[/C][C]-[/C][C]-[/C][C]-[/C][C]-[/C][C]-[/C][/ROW]
[ROW][C]35[/C][C]7[/C][C]-[/C][C]-[/C][C]-[/C][C]-[/C][C]-[/C][C]-[/C][C]-[/C][/ROW]
[ROW][C]36[/C][C]7.1[/C][C]-[/C][C]-[/C][C]-[/C][C]-[/C][C]-[/C][C]-[/C][C]-[/C][/ROW]
[ROW][C]37[/C][C]7.2[/C][C]-[/C][C]-[/C][C]-[/C][C]-[/C][C]-[/C][C]-[/C][C]-[/C][/ROW]
[ROW][C]38[/C][C]7.1[/C][C]-[/C][C]-[/C][C]-[/C][C]-[/C][C]-[/C][C]-[/C][C]-[/C][/ROW]
[ROW][C]39[/C][C]6.9[/C][C]-[/C][C]-[/C][C]-[/C][C]-[/C][C]-[/C][C]-[/C][C]-[/C][/ROW]
[ROW][C]40[/C][C]7[/C][C]-[/C][C]-[/C][C]-[/C][C]-[/C][C]-[/C][C]-[/C][C]-[/C][/ROW]
[ROW][C]41[/C][C]6.8[/C][C]7.0628[/C][C]6.6165[/C][C]7.509[/C][C]0.1242[/C][C]0.6086[/C][C]1e-04[/C][C]0.6086[/C][/ROW]
[ROW][C]42[/C][C]6.4[/C][C]7.2328[/C][C]6.427[/C][C]8.0385[/C][C]0.0214[/C][C]0.8538[/C][C]0.4351[/C][C]0.7144[/C][/ROW]
[ROW][C]43[/C][C]6.7[/C][C]7.2364[/C][C]6.0548[/C][C]8.4181[/C][C]0.1868[/C][C]0.9173[/C][C]0.7116[/C][C]0.6525[/C][/ROW]
[ROW][C]44[/C][C]6.6[/C][C]7.1717[/C][C]5.775[/C][C]8.5684[/C][C]0.2112[/C][C]0.746[/C][C]0.7888[/C][C]0.5952[/C][/ROW]
[ROW][C]45[/C][C]6.4[/C][C]7.0548[/C][C]5.5389[/C][C]8.5706[/C][C]0.1986[/C][C]0.7217[/C][C]0.6768[/C][C]0.5282[/C][/ROW]
[ROW][C]46[/C][C]6.3[/C][C]6.9943[/C][C]5.4069[/C][C]8.5817[/C][C]0.1956[/C][C]0.7685[/C][C]0.5464[/C][C]0.4972[/C][/ROW]
[ROW][C]47[/C][C]6.2[/C][C]6.9931[/C][C]5.3267[/C][C]8.6595[/C][C]0.1755[/C][C]0.7925[/C][C]0.4968[/C][C]0.4968[/C][/ROW]
[ROW][C]48[/C][C]6.5[/C][C]7.0314[/C][C]5.2543[/C][C]8.8084[/C][C]0.2789[/C][C]0.8204[/C][C]0.4698[/C][C]0.5138[/C][/ROW]
[ROW][C]49[/C][C]6.8[/C][C]7.055[/C][C]5.1369[/C][C]8.973[/C][C]0.3972[/C][C]0.7147[/C][C]0.4411[/C][C]0.5224[/C][/ROW]
[ROW][C]50[/C][C]6.8[/C][C]7.0425[/C][C]4.9829[/C][C]9.102[/C][C]0.4088[/C][C]0.5912[/C][C]0.4782[/C][C]0.5161[/C][/ROW]
[ROW][C]51[/C][C]6.4[/C][C]7.0001[/C][C]4.8199[/C][C]9.1804[/C][C]0.2948[/C][C]0.5714[/C][C]0.5359[/C][C]0.5[/C][/ROW]
[ROW][C]52[/C][C]6.1[/C][C]6.956[/C][C]4.6765[/C][C]9.2355[/C][C]0.2309[/C][C]0.6837[/C][C]0.4849[/C][C]0.4849[/C][/ROW]
[ROW][C]53[/C][C]5.8[/C][C]6.9301[/C][C]4.56[/C][C]9.3003[/C][C]0.175[/C][C]0.7538[/C][C]0.5429[/C][C]0.477[/C][/ROW]
[ROW][C]54[/C][C]6.1[/C][C]6.9247[/C][C]4.4599[/C][C]9.3895[/C][C]0.256[/C][C]0.8144[/C][C]0.6617[/C][C]0.4761[/C][/ROW]
[ROW][C]55[/C][C]7.2[/C][C]6.9262[/C][C]4.3573[/C][C]9.495[/C][C]0.4173[/C][C]0.7358[/C][C]0.5685[/C][C]0.4775[/C][/ROW]
[ROW][C]56[/C][C]7.3[/C][C]6.9204[/C][C]4.2418[/C][C]9.5989[/C][C]0.3906[/C][C]0.4189[/C][C]0.5927[/C][C]0.4768[/C][/ROW]
[ROW][C]57[/C][C]6.9[/C][C]6.902[/C][C]4.1155[/C][C]9.6885[/C][C]0.4994[/C][C]0.3898[/C][C]0.638[/C][C]0.4725[/C][/ROW]
[ROW][C]58[/C][C]6.1[/C][C]6.8764[/C][C]3.9884[/C][C]9.7644[/C][C]0.2991[/C][C]0.4936[/C][C]0.6522[/C][C]0.4666[/C][/ROW]
[ROW][C]59[/C][C]5.8[/C][C]6.8524[/C][C]3.8684[/C][C]9.8364[/C][C]0.2447[/C][C]0.6894[/C][C]0.6659[/C][C]0.4614[/C][/ROW]
[ROW][C]60[/C][C]6.2[/C][C]6.8353[/C][C]3.7571[/C][C]9.9136[/C][C]0.3429[/C][C]0.7451[/C][C]0.5845[/C][C]0.4582[/C][/ROW]
[ROW][C]61[/C][C]7.1[/C][C]6.8239[/C][C]3.6498[/C][C]9.9981[/C][C]0.4323[/C][C]0.65[/C][C]0.5059[/C][C]0.4567[/C][/ROW]
[ROW][C]62[/C][C]7.7[/C][C]6.8134[/C][C]3.5409[/C][C]10.0858[/C][C]0.2977[/C][C]0.4319[/C][C]0.5032[/C][C]0.4555[/C][/ROW]
[ROW][C]63[/C][C]7.9[/C][C]6.7996[/C][C]3.428[/C][C]10.1712[/C][C]0.2612[/C][C]0.3003[/C][C]0.5918[/C][C]0.4536[/C][/ROW]
[ROW][C]64[/C][C]7.7[/C][C]6.7819[/C][C]3.3124[/C][C]10.2514[/C][C]0.302[/C][C]0.2638[/C][C]0.65[/C][C]0.451[/C][/ROW]
[ROW][C]65[/C][C]7.4[/C][C]6.7627[/C][C]3.1973[/C][C]10.328[/C][C]0.363[/C][C]0.3032[/C][C]0.7017[/C][C]0.4481[/C][/ROW]
[ROW][C]66[/C][C]7.5[/C][C]6.7446[/C][C]3.0851[/C][C]10.4041[/C][C]0.3429[/C][C]0.3628[/C][C]0.635[/C][C]0.4456[/C][/ROW]
[ROW][C]67[/C][C]8[/C][C]6.7289[/C][C]2.9755[/C][C]10.4823[/C][C]0.2534[/C][C]0.3436[/C][C]0.4028[/C][C]0.4437[/C][/ROW]
[ROW][C]68[/C][C]8.1[/C][C]6.7147[/C][C]2.867[/C][C]10.5624[/C][C]0.2402[/C][C]0.2563[/C][C]0.3828[/C][C]0.4422[/C][/ROW]
[/TABLE]
Source: https://freestatistics.org/blog/index.php?pk=66317&T=1

Globally Unique Identifier (entire table): ba.freestatistics.org/blog/index.php?pk=66317&T=1

As an alternative you can also use a QR Code:  

The GUIDs for individual cells are displayed in the table below:

Univariate ARIMA Extrapolation Forecast
timeY[t]F[t]95% LB95% UBp-value(H0: Y[t] = F[t])P(F[t]>Y[t-1])P(F[t]>Y[t-s])P(F[t]>Y[40])
288.2-------
297.9-------
307.3-------
316.9-------
326.6-------
336.7-------
346.9-------
357-------
367.1-------
377.2-------
387.1-------
396.9-------
407-------
416.87.06286.61657.5090.12420.60861e-040.6086
426.47.23286.4278.03850.02140.85380.43510.7144
436.77.23646.05488.41810.18680.91730.71160.6525
446.67.17175.7758.56840.21120.7460.78880.5952
456.47.05485.53898.57060.19860.72170.67680.5282
466.36.99435.40698.58170.19560.76850.54640.4972
476.26.99315.32678.65950.17550.79250.49680.4968
486.57.03145.25438.80840.27890.82040.46980.5138
496.87.0555.13698.9730.39720.71470.44110.5224
506.87.04254.98299.1020.40880.59120.47820.5161
516.47.00014.81999.18040.29480.57140.53590.5
526.16.9564.67659.23550.23090.68370.48490.4849
535.86.93014.569.30030.1750.75380.54290.477
546.16.92474.45999.38950.2560.81440.66170.4761
557.26.92624.35739.4950.41730.73580.56850.4775
567.36.92044.24189.59890.39060.41890.59270.4768
576.96.9024.11559.68850.49940.38980.6380.4725
586.16.87643.98849.76440.29910.49360.65220.4666
595.86.85243.86849.83640.24470.68940.66590.4614
606.26.83533.75719.91360.34290.74510.58450.4582
617.16.82393.64989.99810.43230.650.50590.4567
627.76.81343.540910.08580.29770.43190.50320.4555
637.96.79963.42810.17120.26120.30030.59180.4536
647.76.78193.312410.25140.3020.26380.650.451
657.46.76273.197310.3280.3630.30320.70170.4481
667.56.74463.085110.40410.34290.36280.6350.4456
6786.72892.975510.48230.25340.34360.40280.4437
688.16.71472.86710.56240.24020.25630.38280.4422


Univariate ARIMA Extrapolation Forecast Performance
time% S.E.PEMAPESq.EMSERMSE
410.0322-0.037200.06900
420.0568-0.11510.07620.69350.38130.6175
430.0833-0.07410.07550.28780.35010.5917
440.0994-0.07970.07650.32680.34430.5868
450.1096-0.09280.07980.42870.36120.601
460.1158-0.09930.0830.48210.38130.6175
470.1216-0.11340.08740.6290.41670.6455
480.1289-0.07560.08590.28230.39990.6324
490.1387-0.03610.08040.0650.36270.6022
500.1492-0.03440.07580.05880.33230.5765
510.1589-0.08570.07670.36020.33480.5787
520.1672-0.12310.08060.73280.3680.6066
530.1745-0.16310.08691.27720.43790.6618
540.1816-0.11910.08920.68010.45520.6747
550.18920.03950.08590.0750.42990.6557
560.19750.05490.08390.14410.4120.6419
570.206-3e-040.07900.38780.6227
580.2143-0.11290.08090.60280.39970.6322
590.2222-0.15360.08471.10760.4370.661
600.2298-0.09290.08510.40360.43530.6598
610.23730.04050.0830.07620.41820.6467
620.2450.13010.08520.78610.43490.6595
630.2530.16180.08851.21090.46870.6846
640.2610.13540.09040.84290.48430.6959
650.2690.09420.09060.40620.48110.6936
660.27680.1120.09140.57060.48460.6961
670.28460.18890.0951.61570.52650.7256
680.29240.20630.0991.91910.57620.7591

\begin{tabular}{lllllllll}
\hline
Univariate ARIMA Extrapolation Forecast Performance \tabularnewline
time & % S.E. & PE & MAPE & Sq.E & MSE & RMSE \tabularnewline
41 & 0.0322 & -0.0372 & 0 & 0.069 & 0 & 0 \tabularnewline
42 & 0.0568 & -0.1151 & 0.0762 & 0.6935 & 0.3813 & 0.6175 \tabularnewline
43 & 0.0833 & -0.0741 & 0.0755 & 0.2878 & 0.3501 & 0.5917 \tabularnewline
44 & 0.0994 & -0.0797 & 0.0765 & 0.3268 & 0.3443 & 0.5868 \tabularnewline
45 & 0.1096 & -0.0928 & 0.0798 & 0.4287 & 0.3612 & 0.601 \tabularnewline
46 & 0.1158 & -0.0993 & 0.083 & 0.4821 & 0.3813 & 0.6175 \tabularnewline
47 & 0.1216 & -0.1134 & 0.0874 & 0.629 & 0.4167 & 0.6455 \tabularnewline
48 & 0.1289 & -0.0756 & 0.0859 & 0.2823 & 0.3999 & 0.6324 \tabularnewline
49 & 0.1387 & -0.0361 & 0.0804 & 0.065 & 0.3627 & 0.6022 \tabularnewline
50 & 0.1492 & -0.0344 & 0.0758 & 0.0588 & 0.3323 & 0.5765 \tabularnewline
51 & 0.1589 & -0.0857 & 0.0767 & 0.3602 & 0.3348 & 0.5787 \tabularnewline
52 & 0.1672 & -0.1231 & 0.0806 & 0.7328 & 0.368 & 0.6066 \tabularnewline
53 & 0.1745 & -0.1631 & 0.0869 & 1.2772 & 0.4379 & 0.6618 \tabularnewline
54 & 0.1816 & -0.1191 & 0.0892 & 0.6801 & 0.4552 & 0.6747 \tabularnewline
55 & 0.1892 & 0.0395 & 0.0859 & 0.075 & 0.4299 & 0.6557 \tabularnewline
56 & 0.1975 & 0.0549 & 0.0839 & 0.1441 & 0.412 & 0.6419 \tabularnewline
57 & 0.206 & -3e-04 & 0.079 & 0 & 0.3878 & 0.6227 \tabularnewline
58 & 0.2143 & -0.1129 & 0.0809 & 0.6028 & 0.3997 & 0.6322 \tabularnewline
59 & 0.2222 & -0.1536 & 0.0847 & 1.1076 & 0.437 & 0.661 \tabularnewline
60 & 0.2298 & -0.0929 & 0.0851 & 0.4036 & 0.4353 & 0.6598 \tabularnewline
61 & 0.2373 & 0.0405 & 0.083 & 0.0762 & 0.4182 & 0.6467 \tabularnewline
62 & 0.245 & 0.1301 & 0.0852 & 0.7861 & 0.4349 & 0.6595 \tabularnewline
63 & 0.253 & 0.1618 & 0.0885 & 1.2109 & 0.4687 & 0.6846 \tabularnewline
64 & 0.261 & 0.1354 & 0.0904 & 0.8429 & 0.4843 & 0.6959 \tabularnewline
65 & 0.269 & 0.0942 & 0.0906 & 0.4062 & 0.4811 & 0.6936 \tabularnewline
66 & 0.2768 & 0.112 & 0.0914 & 0.5706 & 0.4846 & 0.6961 \tabularnewline
67 & 0.2846 & 0.1889 & 0.095 & 1.6157 & 0.5265 & 0.7256 \tabularnewline
68 & 0.2924 & 0.2063 & 0.099 & 1.9191 & 0.5762 & 0.7591 \tabularnewline
\hline
\end{tabular}
%Source: https://freestatistics.org/blog/index.php?pk=66317&T=2

[TABLE]
[ROW][C]Univariate ARIMA Extrapolation Forecast Performance[/C][/ROW]
[ROW][C]time[/C][C]% S.E.[/C][C]PE[/C][C]MAPE[/C][C]Sq.E[/C][C]MSE[/C][C]RMSE[/C][/ROW]
[ROW][C]41[/C][C]0.0322[/C][C]-0.0372[/C][C]0[/C][C]0.069[/C][C]0[/C][C]0[/C][/ROW]
[ROW][C]42[/C][C]0.0568[/C][C]-0.1151[/C][C]0.0762[/C][C]0.6935[/C][C]0.3813[/C][C]0.6175[/C][/ROW]
[ROW][C]43[/C][C]0.0833[/C][C]-0.0741[/C][C]0.0755[/C][C]0.2878[/C][C]0.3501[/C][C]0.5917[/C][/ROW]
[ROW][C]44[/C][C]0.0994[/C][C]-0.0797[/C][C]0.0765[/C][C]0.3268[/C][C]0.3443[/C][C]0.5868[/C][/ROW]
[ROW][C]45[/C][C]0.1096[/C][C]-0.0928[/C][C]0.0798[/C][C]0.4287[/C][C]0.3612[/C][C]0.601[/C][/ROW]
[ROW][C]46[/C][C]0.1158[/C][C]-0.0993[/C][C]0.083[/C][C]0.4821[/C][C]0.3813[/C][C]0.6175[/C][/ROW]
[ROW][C]47[/C][C]0.1216[/C][C]-0.1134[/C][C]0.0874[/C][C]0.629[/C][C]0.4167[/C][C]0.6455[/C][/ROW]
[ROW][C]48[/C][C]0.1289[/C][C]-0.0756[/C][C]0.0859[/C][C]0.2823[/C][C]0.3999[/C][C]0.6324[/C][/ROW]
[ROW][C]49[/C][C]0.1387[/C][C]-0.0361[/C][C]0.0804[/C][C]0.065[/C][C]0.3627[/C][C]0.6022[/C][/ROW]
[ROW][C]50[/C][C]0.1492[/C][C]-0.0344[/C][C]0.0758[/C][C]0.0588[/C][C]0.3323[/C][C]0.5765[/C][/ROW]
[ROW][C]51[/C][C]0.1589[/C][C]-0.0857[/C][C]0.0767[/C][C]0.3602[/C][C]0.3348[/C][C]0.5787[/C][/ROW]
[ROW][C]52[/C][C]0.1672[/C][C]-0.1231[/C][C]0.0806[/C][C]0.7328[/C][C]0.368[/C][C]0.6066[/C][/ROW]
[ROW][C]53[/C][C]0.1745[/C][C]-0.1631[/C][C]0.0869[/C][C]1.2772[/C][C]0.4379[/C][C]0.6618[/C][/ROW]
[ROW][C]54[/C][C]0.1816[/C][C]-0.1191[/C][C]0.0892[/C][C]0.6801[/C][C]0.4552[/C][C]0.6747[/C][/ROW]
[ROW][C]55[/C][C]0.1892[/C][C]0.0395[/C][C]0.0859[/C][C]0.075[/C][C]0.4299[/C][C]0.6557[/C][/ROW]
[ROW][C]56[/C][C]0.1975[/C][C]0.0549[/C][C]0.0839[/C][C]0.1441[/C][C]0.412[/C][C]0.6419[/C][/ROW]
[ROW][C]57[/C][C]0.206[/C][C]-3e-04[/C][C]0.079[/C][C]0[/C][C]0.3878[/C][C]0.6227[/C][/ROW]
[ROW][C]58[/C][C]0.2143[/C][C]-0.1129[/C][C]0.0809[/C][C]0.6028[/C][C]0.3997[/C][C]0.6322[/C][/ROW]
[ROW][C]59[/C][C]0.2222[/C][C]-0.1536[/C][C]0.0847[/C][C]1.1076[/C][C]0.437[/C][C]0.661[/C][/ROW]
[ROW][C]60[/C][C]0.2298[/C][C]-0.0929[/C][C]0.0851[/C][C]0.4036[/C][C]0.4353[/C][C]0.6598[/C][/ROW]
[ROW][C]61[/C][C]0.2373[/C][C]0.0405[/C][C]0.083[/C][C]0.0762[/C][C]0.4182[/C][C]0.6467[/C][/ROW]
[ROW][C]62[/C][C]0.245[/C][C]0.1301[/C][C]0.0852[/C][C]0.7861[/C][C]0.4349[/C][C]0.6595[/C][/ROW]
[ROW][C]63[/C][C]0.253[/C][C]0.1618[/C][C]0.0885[/C][C]1.2109[/C][C]0.4687[/C][C]0.6846[/C][/ROW]
[ROW][C]64[/C][C]0.261[/C][C]0.1354[/C][C]0.0904[/C][C]0.8429[/C][C]0.4843[/C][C]0.6959[/C][/ROW]
[ROW][C]65[/C][C]0.269[/C][C]0.0942[/C][C]0.0906[/C][C]0.4062[/C][C]0.4811[/C][C]0.6936[/C][/ROW]
[ROW][C]66[/C][C]0.2768[/C][C]0.112[/C][C]0.0914[/C][C]0.5706[/C][C]0.4846[/C][C]0.6961[/C][/ROW]
[ROW][C]67[/C][C]0.2846[/C][C]0.1889[/C][C]0.095[/C][C]1.6157[/C][C]0.5265[/C][C]0.7256[/C][/ROW]
[ROW][C]68[/C][C]0.2924[/C][C]0.2063[/C][C]0.099[/C][C]1.9191[/C][C]0.5762[/C][C]0.7591[/C][/ROW]
[/TABLE]
Source: https://freestatistics.org/blog/index.php?pk=66317&T=2

Globally Unique Identifier (entire table): ba.freestatistics.org/blog/index.php?pk=66317&T=2

As an alternative you can also use a QR Code:  

The GUIDs for individual cells are displayed in the table below:

Univariate ARIMA Extrapolation Forecast Performance
time% S.E.PEMAPESq.EMSERMSE
410.0322-0.037200.06900
420.0568-0.11510.07620.69350.38130.6175
430.0833-0.07410.07550.28780.35010.5917
440.0994-0.07970.07650.32680.34430.5868
450.1096-0.09280.07980.42870.36120.601
460.1158-0.09930.0830.48210.38130.6175
470.1216-0.11340.08740.6290.41670.6455
480.1289-0.07560.08590.28230.39990.6324
490.1387-0.03610.08040.0650.36270.6022
500.1492-0.03440.07580.05880.33230.5765
510.1589-0.08570.07670.36020.33480.5787
520.1672-0.12310.08060.73280.3680.6066
530.1745-0.16310.08691.27720.43790.6618
540.1816-0.11910.08920.68010.45520.6747
550.18920.03950.08590.0750.42990.6557
560.19750.05490.08390.14410.4120.6419
570.206-3e-040.07900.38780.6227
580.2143-0.11290.08090.60280.39970.6322
590.2222-0.15360.08471.10760.4370.661
600.2298-0.09290.08510.40360.43530.6598
610.23730.04050.0830.07620.41820.6467
620.2450.13010.08520.78610.43490.6595
630.2530.16180.08851.21090.46870.6846
640.2610.13540.09040.84290.48430.6959
650.2690.09420.09060.40620.48110.6936
660.27680.1120.09140.57060.48460.6961
670.28460.18890.0951.61570.52650.7256
680.29240.20630.0991.91910.57620.7591


Parameters (Session):
par1 = 12 ; par2 = 1 ; par3 = 2 ; par4 = 0 ; par5 = 12 ; par6 = 3 ; par7 = 1 ; par8 = 0 ; par9 = 0 ; par10 = FALSE ;
Parameters (R input):
par1 = 12 ; par2 = 1 ; par3 = 2 ; par4 = 0 ; par5 = 12 ; par6 = 3 ; par7 = 1 ; par8 = 0 ; par9 = 0 ; par10 = FALSE ;
R code (references can be found in the software module):
par1 <- as.numeric(par1) #cut off periods
par1 <- 28
par2 <- as.numeric(par2) #lambda
par3 <- as.numeric(par3) #degree of non-seasonal differencing
par4 <- as.numeric(par4) #degree of seasonal differencing
par5 <- as.numeric(par5) #seasonal period
par6 <- as.numeric(par6) #p
par6 <- 3
par7 <- as.numeric(par7) #q
par7 <- 3
par8 <- as.numeric(par8) #P
par9 <- as.numeric(par9) #Q
if (par10 == 'TRUE') par10 <- TRUE
if (par10 == 'FALSE') par10 <- FALSE
if (par2 == 0) x <- log(x)
if (par2 != 0) x <- x^par2
lx <- length(x)
first <- lx - 2*par1
nx <- lx - par1
nx1 <- nx + 1
fx <- lx - nx
if (fx < 1) {
fx <- par5
nx1 <- lx + fx - 1
first <- lx - 2*fx
}
first <- 1
if (fx < 3) fx <- round(lx/10,0)
(arima.out <- arima(x[1:nx], order=c(par6,par3,par7), seasonal=list(order=c(par8,par4,par9), period=par5), include.mean=par10, method='ML'))
(forecast <- predict(arima.out,par1))
(lb <- forecast$pred - 1.96 * forecast$se)
(ub <- forecast$pred + 1.96 * forecast$se)
if (par2 == 0) {
x <- exp(x)
forecast$pred <- exp(forecast$pred)
lb <- exp(lb)
ub <- exp(ub)
}
if (par2 != 0) {
x <- x^(1/par2)
forecast$pred <- forecast$pred^(1/par2)
lb <- lb^(1/par2)
ub <- ub^(1/par2)
}
if (par2 < 0) {
olb <- lb
lb <- ub
ub <- olb
}
(actandfor <- c(x[1:nx], forecast$pred))
(perc.se <- (ub-forecast$pred)/1.96/forecast$pred)
bitmap(file='test1.png')
opar <- par(mar=c(4,4,2,2),las=1)
ylim <- c( min(x[first:nx],lb), max(x[first:nx],ub))
plot(x,ylim=ylim,type='n',xlim=c(first,lx))
usr <- par('usr')
rect(usr[1],usr[3],nx+1,usr[4],border=NA,col='lemonchiffon')
rect(nx1,usr[3],usr[2],usr[4],border=NA,col='lavender')
abline(h= (-3:3)*2 , col ='gray', lty =3)
polygon( c(nx1:lx,lx:nx1), c(lb,rev(ub)), col = 'orange', lty=2,border=NA)
lines(nx1:lx, lb , lty=2)
lines(nx1:lx, ub , lty=2)
lines(x, lwd=2)
lines(nx1:lx, forecast$pred , lwd=2 , col ='white')
box()
par(opar)
dev.off()
prob.dec <- array(NA, dim=fx)
prob.sdec <- array(NA, dim=fx)
prob.ldec <- array(NA, dim=fx)
prob.pval <- array(NA, dim=fx)
perf.pe <- array(0, dim=fx)
perf.mape <- array(0, dim=fx)
perf.mape1 <- array(0, dim=fx)
perf.se <- array(0, dim=fx)
perf.mse <- array(0, dim=fx)
perf.mse1 <- array(0, dim=fx)
perf.rmse <- array(0, dim=fx)
for (i in 1:fx) {
locSD <- (ub[i] - forecast$pred[i]) / 1.96
perf.pe[i] = (x[nx+i] - forecast$pred[i]) / forecast$pred[i]
perf.se[i] = (x[nx+i] - forecast$pred[i])^2
prob.dec[i] = pnorm((x[nx+i-1] - forecast$pred[i]) / locSD)
prob.sdec[i] = pnorm((x[nx+i-par5] - forecast$pred[i]) / locSD)
prob.ldec[i] = pnorm((x[nx] - forecast$pred[i]) / locSD)
prob.pval[i] = pnorm(abs(x[nx+i] - forecast$pred[i]) / locSD)
}
perf.mape[1] = abs(perf.pe[1])
perf.mse[1] = abs(perf.se[1])
for (i in 2:fx) {
perf.mape[i] = perf.mape[i-1] + abs(perf.pe[i])
perf.mape1[i] = perf.mape[i] / i
perf.mse[i] = perf.mse[i-1] + perf.se[i]
perf.mse1[i] = perf.mse[i] / i
}
perf.rmse = sqrt(perf.mse1)
bitmap(file='test2.png')
plot(forecast$pred, pch=19, type='b',main='ARIMA Extrapolation Forecast', ylab='Forecast and 95% CI', xlab='time',ylim=c(min(lb),max(ub)))
dum <- forecast$pred
dum[1:par1] <- x[(nx+1):lx]
lines(dum, lty=1)
lines(ub,lty=3)
lines(lb,lty=3)
dev.off()
load(file='createtable')
a<-table.start()
a<-table.row.start(a)
a<-table.element(a,'Univariate ARIMA Extrapolation Forecast',9,TRUE)
a<-table.row.end(a)
a<-table.row.start(a)
a<-table.element(a,'time',1,header=TRUE)
a<-table.element(a,'Y[t]',1,header=TRUE)
a<-table.element(a,'F[t]',1,header=TRUE)
a<-table.element(a,'95% LB',1,header=TRUE)
a<-table.element(a,'95% UB',1,header=TRUE)
a<-table.element(a,'p-value
(H0: Y[t] = F[t])',1,header=TRUE)
a<-table.element(a,'P(F[t]>Y[t-1])',1,header=TRUE)
a<-table.element(a,'P(F[t]>Y[t-s])',1,header=TRUE)
mylab <- paste('P(F[t]>Y[',nx,sep='')
mylab <- paste(mylab,'])',sep='')
a<-table.element(a,mylab,1,header=TRUE)
a<-table.row.end(a)
for (i in (nx-par5):nx) {
a<-table.row.start(a)
a<-table.element(a,i,header=TRUE)
a<-table.element(a,x[i])
a<-table.element(a,'-')
a<-table.row.end(a)
}
for (i in 1:fx) {
a<-table.row.start(a)
a<-table.element(a,nx+i,header=TRUE)
a<-table.element(a,round(x[nx+i],4))
a<-table.element(a,round(forecast$pred[i],4))
a<-table.element(a,round(lb[i],4))
a<-table.element(a,round(ub[i],4))
a<-table.element(a,round((1-prob.pval[i]),4))
a<-table.element(a,round((1-prob.dec[i]),4))
a<-table.element(a,round((1-prob.sdec[i]),4))
a<-table.element(a,round((1-prob.ldec[i]),4))
a<-table.row.end(a)
}
a<-table.end(a)
table.save(a,file='mytable.tab')
a<-table.start()
a<-table.row.start(a)
a<-table.element(a,'Univariate ARIMA Extrapolation Forecast Performance',7,TRUE)
a<-table.row.end(a)
a<-table.row.start(a)
a<-table.element(a,'time',1,header=TRUE)
a<-table.element(a,'% S.E.',1,header=TRUE)
a<-table.element(a,'PE',1,header=TRUE)
a<-table.element(a,'MAPE',1,header=TRUE)
a<-table.element(a,'Sq.E',1,header=TRUE)
a<-table.element(a,'MSE',1,header=TRUE)
a<-table.element(a,'RMSE',1,header=TRUE)
a<-table.row.end(a)
for (i in 1:fx) {
a<-table.row.start(a)
a<-table.element(a,nx+i,header=TRUE)
a<-table.element(a,round(perc.se[i],4))
a<-table.element(a,round(perf.pe[i],4))
a<-table.element(a,round(perf.mape1[i],4))
a<-table.element(a,round(perf.se[i],4))
a<-table.element(a,round(perf.mse1[i],4))
a<-table.element(a,round(perf.rmse[i],4))
a<-table.row.end(a)
}
a<-table.end(a)
table.save(a,file='mytable1.tab')